

数据科学与机器学习(第四十五部分):利用Facebook的Prophet模型进行外汇时间序列预测
 178
178
 0
0

内容
什么是Prophet模型?
Prophet模型是由Meta(原Facebook)推出的开源时间序列预测工具。该模型面向业务和分析用途,提供准确且用户友好的预测,尤其适用于具备显著季节性与趋势特征的时间序列数据。
该模型由Facebook团队(S.J. 泰勒、本杰明・莱瑟姆)于2018年发布,最初用于按日频记录的数据预测,可捕捉周度、年度季节性规律以及节假日带来的数据波动,后续经过拓展,能够适配更多类型的季节性时序数据。当时间序列存在明显季节性、且拥有多段历史周期数据时,该模型预测效果最优。
专业术语释义:
- 趋势:趋势反映在排除季节性波动影响后数据的长期变化。
- 季节性:季节性指数据短期内周期性波动,这类短期变化不足以构成长期“趋势”。

在本文中,我们将基于外汇行情数据解析并搭建Prophet模型,探究该模型是否有助于我们在市场中取得优势。在此之前,我们先详细拆解该模型的核心原理。
Prophet模型原理详解
Prophet模型本质为非线性回归模型,其计算公式如下:

图例01
其中:
-
 代表分段线性趋势项(或称为“增长项”)
 -
 代表各类季节性周期规律
 -
 用于刻画节假日效应,
 为白噪声误差项。
01:趋势分量
趋势分量 支持突变点设置,如果不手动指定,则模型会自动筛选突变点。突变点指时间序列中趋势发生转折的位置(例如行情突然大幅上涨或下跌)。
您也可以选择使用逻辑增长模型替代线性模型,该模型引入上限参数,用于模拟增长饱和效应。当增长达到自然上限后增速放缓时,该模型十分适用。
02:季节性
Prophet模型采用傅里叶级数对季节性 进行建模。
进行建模。
默认设置:
- 年度季节性采用10阶傅里叶项
- 周度季节性采用3阶傅里叶项
傅里叶项能够帮助模型捕捉周期性重复的季节波动规律。
03:节假日效应部分
节假日效应 通过虚拟变量(独热编码)引入模型,使模型在特殊日期自动修正预测值 —— 这类日期在历史数据中往往会造成走势偏离常规。例如经济数据公布日或法定节假日。
整个模型基于贝叶斯框架完成参数估计,可自动筛选突变点并优化其余模型参数。
尽管这种基础加法分解模型形式简洁,但公式内各项的计算涉及大量复杂数学运算,因此,如果您不熟悉原理,很容易得到错误的预测结果。
Prophet提供两种建模方案:
- 分段线性增长模型(默认模型)
- 逻辑增长模型
01. 分段线性模型
这是Prophet默认使用的模型。该模型假设数据趋势呈线性变化,但会在特定时间点发生改变(这类点称为突变点)。适用于具有平稳增长或下降趋势、且可能出现突然转折的数据。
该建模方式对应图例01中的公式。
02. 逻辑增长模型
该模型适用于呈现饱和增长特征的数据:初期快速增长,在接近最大容量或上限后增速逐渐放缓。这类模式常见于存在自然上限或业务限制的实际系统中(例如市场趋于饱和时的用户增长)。
逻辑增长模型通过引入容量参数来定义这一增长上限。
用于表示该建模方式的公式如下:

图例02
其中:
 为容量上限,
 为增长率,
为增长率, 为偏移参数。
在Python中实现Prophet模型
我们将使用欧元兑美元(EURUSD)小时图数据,通过该模型识别趋势、季节性并预测未来数值。
首先需要从requirements.txt文件安装所有依赖库 —— 该文件附在本文结尾。
pip install -r requirements.txt
导入:
import pandas as pd
import numpy as np
import MetaTrader5 as mt5
import matplotlib.pyplot as plt
import seaborn as sns
from prophet import Prophet

plt.style.use('fivethirtyeight')
sns.set_style("darkgrid")
让我们从MetaTrader 5中获取数据。
if not mt5.initialize(r"c:\Program Files\MetaTrader 5 IC Markets (SC)\terminal64.exe"):
    print("Failed to initialize MetaTrader5. Error = ",mt5.last_error())
    mt5.shutdown()

symbol = "EURUSD"
timeframe = mt5.TIMEFRAME_H1

rates = mt5.copy_rates_from_pos(symbol, timeframe, 1, 10000)

if rates is None:
    print(f"Failed to copy rates for symbol={symbol}. MT5 Error = {mt5.last_error()}")
Prophet模型高度依赖日期时间或时间戳特征。这一特征是模型正常运行的必要条件。
从MetaTrader 5获取到行情数据(价格)后,我们将其转换为Pandas-DataFrame对象。接下来,把以秒为单位的时间列转换为日期时间格式。
rates_df = pd.DataFrame(rates) # we convert rates object to a dataframe
rates_df["time"] = pd.to_datetime(rates_df["time"], unit="s") # we convert the time from seconds to datatime

rates_df
输出:
| 时间 | 开盘价 | 最高价 | 最低价 | 收盘价 | 分时成交量 | 点差 | 真实成交量 | |
|---|---|---|---|---|---|---|---|---|
| 0 | 2023-11-10 23:00:00 | 1.06849 | 1.06873 | 1.06826 | 1.06846 | 762 | 0 | 0 |
| 1 | 2023-11-13 00:00:00 | 1.06828 | 1.06853 | 1.06779 | 1.06841 | 1059 | 10 | 0 |
| 2 | 2023-11-13 01:00:00 | 1.06854 | 1.06907 | 1.06854 | 1.06906 | 571 | 0 | 0 |
| 3 | 2023-11-13 02:00:00 | 1.06904 | 1.06904 | 1.06822 | 1.06839 | 1053 | 0 | 0 |
| 4 | 2023-11-13 03:00:00 | 1.06840 | 1.06886 | 1.06811 | 1.06867 | 1204 | 0 | 0 |
Prophet模型属于单变量模型,在Pandas-DataFrame中仅需两个特征即可运行,例如,一个是名为"ds"的日期时间特征(时间戳),另一个是标记为"y"的目标变量。
现在,我们从MetaTrader 5获取的数据中,提取出仅包含时间和波动率这两个特征的简易数据集。这就是我们后续要传入Prophet模型进行训练的数据。
prophet_df = pd.DataFrame({
    "time": rates_df["time"],
    "volatility": rates_df["high"] - rates_df["low"]
}).set_index("time")

prophet_df
波动率(计算方式为最高价与最低价之差)是我们的目标变量。
与之前提到的ARIMA、VAR等时间序列预测模型不同,那些模型要求目标变量是平稳序列,而Prophet模型则不受这一条件限制。它同样可以处理非平稳数据。不过,所有机器学习模型在平稳序列上通常表现更好,因为平稳序列具有恒定的均值、方差与标准差,更易于模型学习。
我这里选择使用平稳的目标变量来建模,能让整个过程更简单。
接下来,我们对数据框进行绘图,观察各项特征。
# Color pallete for plotting
color_pal = ["#F8766D", "#D39200", "#93AA00",
             "#00BA38", "#00C19F", "#00B9E3",
             "#619CFF", "#DB72FB"]

prophet_df.plot(figsize=(7,5), color=color_pal, title="Volatility (high-low) against time", ylabel="volatility", xlabel="time")
输出:
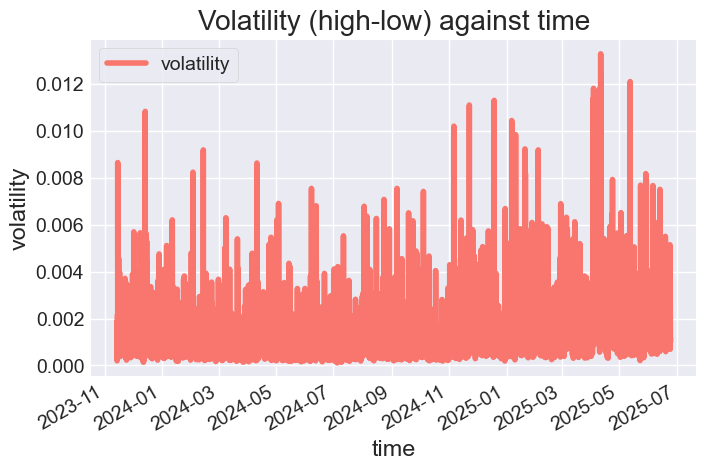
图例03
我们也可以选择构建特征X和目标变量y,用于分析时间特征对市场波动率的影响程度。
def create_features(df, label=None):
    """
    Creates time series features from datetime index.
    """

    df = df.copy()
    df['date'] = df.index
    df['hour'] = df['date'].dt.hour
    df['dayofweek'] = df['date'].dt.dayofweek
    df['quarter'] = df['date'].dt.quarter
    df['month'] = df['date'].dt.month
    df['year'] = df['date'].dt.year
    df['dayofyear'] = df['date'].dt.dayofyear
    df['dayofmonth'] = df['date'].dt.day
    df['weekofyear'] = df['date'].dt.isocalendar().week

    X = df[['hour','dayofweek','quarter','month','year',
           'dayofyear','dayofmonth','weekofyear']]
    if label:
        y = df[label]
        return X, y
    return X

X, y = create_features(prophet_df, label='volatility')

features_and_target = pd.concat([X, y], axis=1)
输出:
| 小时 | 周内天数 | 季度 | 月份 | 年份 | 年内天数 | 月内天数 | 年内周数 | 波动率 | |
|---|---|---|---|---|---|---|---|---|---|
| 时间 | |||||||||
| 2023-11-13 16:00:00 | 16 | 0 | 4 | 11 | 2023 | 317 | 13 | 46 | 0.00122 |
| 2023-11-13 17:00:00 | 17 | 0 | 4 | 11 | 2023 | 317 | 13 | 46 | 0.00179 |
| 2023-11-13 18:00:00 | 18 | 0 | 4 | 11 | 2023 | 317 | 13 | 46 | 0.00186 |
| 2023-11-13 19:00:00 | 19 | 0 | 4 | 11 | 2023 | 317 | 13 | 46 | 0.00125 |
| 2023-11-13 20:00:00 | 20 | 0 | 4 | 11 | 2023 | 317 | 13 | 46 | 0.00150 |
我们可以将这些特征与波动率一同绘图,以便进行直观分析。
sns.pairplot(features_and_target.dropna(),
             hue='hour',
             x_vars=['hour','dayofweek',
                     'year','weekofyear'],
             y_vars='volatility',
             height=5,
             plot_kws={'alpha':0.45, 'linewidth':0.5}
            )

plt.suptitle(f"{symbol} close prices by Hour, Day of Week, Year, and Week")
plt.show()
输出:

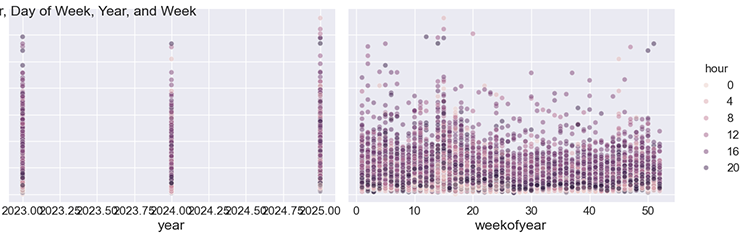
图例04
由子图可见,小时、星期几、年份以及一年中的第几周,都会对图表中每小时的市场波动率产生影响。了解这一点后,我们就可以更有把握地使用这份数据来训练Prophet模型。
训练Prophet模型
首先,我们按指定日期将数据划分为训练集和测试集。
split_date = '01-Jan-2025' # threshold date between training and testing samples, all values after this date are for testing

prophet_df_train = prophet_df.loc[prophet_df.index <= split_date].copy().reset_index().rename(columns={"time": "ds", "volatility": "y"})
prophet_df_test = prophet_df.loc[prophet_df.index > split_date].copy().reset_index().rename(columns={"time": "ds", "volatility": "y"})
在训练数据上训练Prophet模型。
model = Prophet()
model.fit(prophet_df_train)
模型训练完成后,我们通常需要在样本外数据(模型从未见过的新数据)上测试其效果。与其他模型不同,Prophet生成预测结果的方式略有区别。
test_fcst = model.predict(df=prophet_df_test)
该模型不会只返回一个包含预测值的向量,而是会返回一整个DataFrame,其中包含各类代表预测结果和模型状态的特征。
test_fcst.head()
输出:
	ds      trend   	yhat_lower      yhat_upper      trend_lower     trend_upper     additive_terms  additive_terms_lower    additive_terms_upper    daily   daily_lower     daily_upper     weekly  weekly_lower    weekly_upper    multiplicative_terms    multiplicative_terms_lower      multiplicative_terms_upper      yhat
0       2025-01-02 00:00:00     0.001674        0.000168        0.001993        0.001674        0.001674        -0.000571       -0.000571       -0.000571       -0.000510       -0.000510       -0.000510       -0.000061       -0.000061       -0.000061       0.0     0.0     0.0     0.001102
1       2025-01-02 01:00:00     0.001674        0.000161        0.001977        0.001674        0.001674        -0.000614       -0.000614       -0.000614       -0.000556       -0.000556       -0.000556       -0.000057       -0.000057       -0.000057       0.0     0.0     0.0     0.001060
2       2025-01-02 02:00:00     0.001674        0.000337        0.002123        0.001674        0.001674        -0.000483       -0.000483       -0.000483       -0.000430       -0.000430       -0.000430       -0.000054       -0.000054       -0.000054       0.0     0.0     0.0     0.001191
下表列出了predict方法返回的部分列(特征)的含义。
| 列 | 含义 |
|---|---|
| ds | 预测点的日期时间(时间戳) |
| yhat | 最终预测值(Prophet在该时间点的预测结果) |
| yhat_lower, yhat_upper | 预测值yhat对应的80%(或95%)置信区间的下限与上限 |
| trend | 时间点ds对应的趋势分量值(例如随时间缓慢增长或下降) |
| trend_lower, trend_upper | 趋势分量的置信区间 |
| additive_terms | 时间点ds处所有季节性分量与节假日分量之和(如日内波动 + 周内规律 + 节假日影响)。 |
| additive_terms_lower, additive_terms_upper | 加法分量的上下界 |
| daily | 日内季节性效应(如一天内的小时级波动规律) |
| daily_lower, daily_upper | 日内分量的置信区间 |
| weekly | 周度季节性效应(如周末与工作日的波动差异) |
| weekly_lower, weekly_upper | 周度分量的置信区间 |
我们最需要的列是:yhat(预测值)、yhat_lower(预测下限)、yhat_upper(预测上限)、trend(趋势)、季节性规律(daily日内、weekly周内、yearly年度)、holidays(节假日,如果启用),以及各分量的误差区间(*_lower和 *_upper)列。
让我们绘制测试集上的真实值与预测值曲线,并同时展示训练集的真实值作为参考。
f, ax = plt.subplots(figsize=(7,5))
ax.scatter(prophet_df_test["ds"], prophet_df_test['y'], color='r') # plot actual values from the testing sample in red

fig = model.plot(test_fcst, ax=ax) # plot the forecasts
输出图:
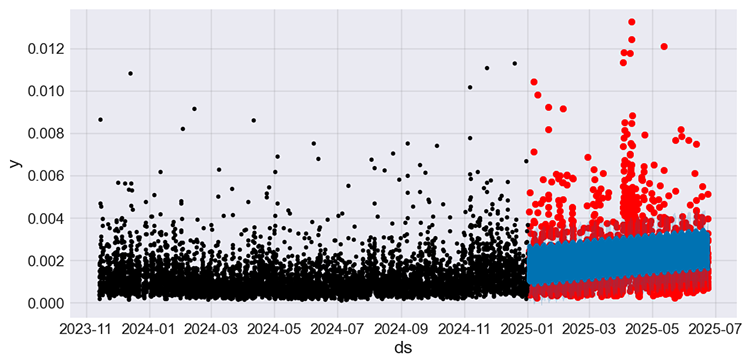
图例05
黑色曲线代表训练集数据,红色曲线为测试集真实值,蓝色曲线则是模型对测试集的预测结果。
仅通过此图表很难直观判断模型的效果。让我们来绘制小图,专门展示测试集的真实值与预测值。
接下来以测试集中的第一个月份 —— 2025年1月为例,对模型进行评估。
f, ax = plt.subplots(figsize=(7, 5))

ax.scatter(prophet_df_test["ds"], prophet_df_test['y'], color='r')
fig = model.plot(test_fcst, ax=ax)
ax.set_xbound(
            lower=pd.to_datetime("2025-01-01"), # starting data on the x axis
            upper=pd.to_datetime("2025-02-01")) # ending data on the x axis

ax.set_ylim(0, 0.005)
plot = plt.suptitle("January 2025, Actual vs Forecasts")
输出:
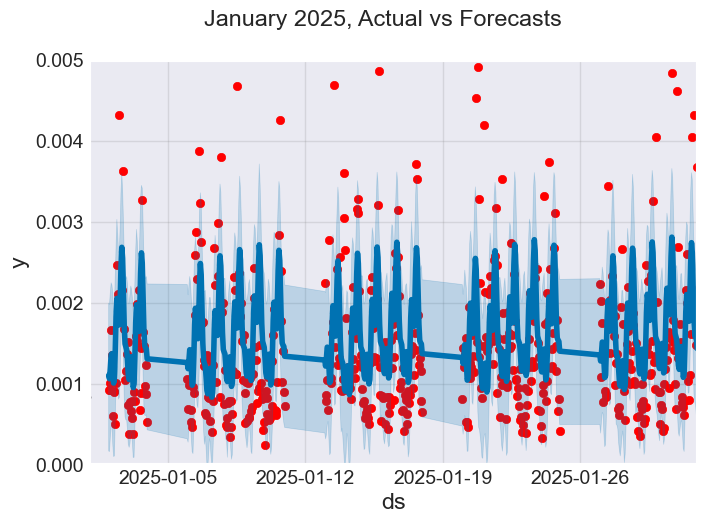
图例06
由上图可见,Prophet模型的部分预测是准确的,但似乎不太擅长处理异常值。
我们也可以进一步分析预测效果,对比1月第一周(1月1日至1月8日)的真实值与模型预测值。
f, ax = plt.subplots(figsize=(9, 5))

ax.scatter(prophet_df_test["ds"], prophet_df_test['y'], color='r')
fig = model.plot(test_fcst, ax=ax)
ax.set_xbound(
            lower=pd.to_datetime("2025-01-01"),
            upper=pd.to_datetime("2025-01-08"))

ax.set_ylim(0, 0.005)
plot = plt.suptitle("January 01-08, 2025. Actual vs Forecasts")
输出:
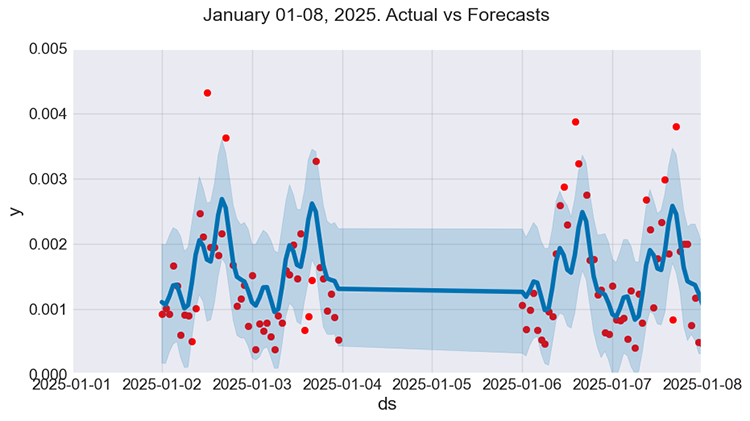
图例07
看起来效果要好不少。然而,尽管模型捕捉到了部分规律,但其预测值与真实值仍有一定差距,而这正是我们使用回归模型时通常希望尽可能缩小的误差。
不过它的概括性预测还算可以。
让我们通过一些评估指标来量化评价模型效果。
import sklearn.metrics as metric

def forecast_accuracy(forecast, actual):
    # Convert to numpy arrays if they aren't already
    forecast = np.asarray(forecast)
    actual = np.asarray(actual)

    metrics = {
        'mape': metric.mean_absolute_percentage_error(actual, forecast),
        'me': np.mean(forecast - actual),  # Mean Error
        'mae': metric.mean_absolute_error(actual, forecast),
        'mpe': np.mean((forecast - actual) / actual),  # Mean Percentage Error
        'rmse': metric.root_mean_squared_error(actual, forecast),
        'minmax': 1 - np.mean(np.minimum(forecast, actual) / np.maximum(forecast, actual)),
        "r2_score": metric.r2_score(forecast, actual)
    }
    return metrics

results = forecast_accuracy(test_pred, prophet_df_test["y"])

for metric_name, value in results.items():
    print(f"{metric_name:<10}: {value:.6f}")
输出:
mape      : 0.603277
me        : 0.000130
mae       : 0.000829
mpe       : 0.430299
rmse      : 0.001221
minmax    : 0.339292
r2_score  : -4.547775
我重点关注的评估指标是MAPE(平均绝对百分比误差)—— 该指标数值约为0.6,意味着模型的预测结果平均偏离真实值60%。简言之,模型预测效果很差,误差非常大。
为Prophet模型添加节假日
Prophet模型在设计时就考虑到,任何时间序列数据中都可能存在引发异常波动的事件,这类事件我们称之为“节假日”(holidays)。
在现实场景中,节假日往往会对业务数据产生不规则影响,其中包括:
- 法定节假日(如元旦、圣诞节)
- 商业活动(如黑色星期五、产品发布会)
- 金融事件(如央行决议、季度末结算)
- 地方性事件(如选举、极端天气)
这些日期并不遵循固定的季节性规律,但会以年、季度、日等周期重复出现。
在金融(交易)数据中,我们可以把财经新闻事件视作节假日,因为它们同样会造成上述的异常波动。通过这样处理,或许能改善模型当前的问题 —— 无法捕捉极端值。
如图例01中的Prophet模型公式所示,加入节假日项(如果存在) 会让模型结构更完整,因为节假日是公式的核心组成部分之一。
话虽如此,我们还需要通过MQL5语言 来采集新闻数据。
文件名:OHLC + News.mq5
input datetime start_date = D'01.01.2023';
input datetime end_date = D'24.6.2025';
input ENUM_TIMEFRAMES timeframe = PERIOD_H1;

MqlRates rates[];
struct news_data_struct
  {
    datetime time[]; //News release time
    double open[]; //Candle opening price
    double high[]; //Candle high price
    double low[]; //Candle low price
    double close[]; //Candle close price
    string name[]; //Name of the news
    ENUM_CALENDAR_EVENT_SECTOR sector[]; //The sector a news is related to
    ENUM_CALENDAR_EVENT_IMPORTANCE importance[]; //Event importance
    double actual[]; //actual value
    double forecast[]; //forecast value
    double previous[]; //previous value

    void Resize(uint size)
      {
          ArrayResize(time, size);
          ArrayResize(open, size);
          ArrayResize(high, size);
          ArrayResize(low, size);
          ArrayResize(close, size);
          ArrayResize(name, size);
          ArrayResize(sector, size);
          ArrayResize(importance, size);
          ArrayResize(actual, size);
          ArrayResize(forecast, size);
          ArrayResize(previous, size);
      }

  } news_data;
//+------------------------------------------------------------------+
//| Script program start function                                    |
//+------------------------------------------------------------------+
void OnStart()
  {
//---

   if (!ChartSetSymbolPeriod(0, Symbol(), timeframe))
      return;

   SaveNews(StringFormat("%s.%s.OHLC + News.csv",Symbol(),EnumToString(timeframe)));
  }
//+------------------------------------------------------------------+
//|                                                                  |
//|   The function which collects news alongsided OHLC values and    |
//|   saves the data to a CSV file                                   |
//|                                                                  |
//+------------------------------------------------------------------+
void SaveNews(string csv_name)
 {
//--- get OHLC values first

   ResetLastError();
   if (CopyRates(Symbol(), timeframe, start_date, end_date, rates)<=0)
     {
       printf("%s failed to get price information from %s to %s. Error = %d",__FUNCTION__,string(start_date),string(end_date),GetLastError());
       return;
     }

   uint size = rates.Size();
   news_data.Resize(size-1);

//---

   FileDelete(csv_name); //Delete an existing csv file of a given name
   int csv_handle = FileOpen(csv_name,FILE_WRITE|FILE_SHARE_WRITE|FILE_CSV|FILE_ANSI|FILE_COMMON,",",CP_UTF8); //csv handle

   if(csv_handle == INVALID_HANDLE)
     {
       printf("Invalid %s handle Error %d ",csv_name,GetLastError());
       return; //stop the process
     }

   FileSeek(csv_handle,0,SEEK_SET); //go to file begining
   FileWrite(csv_handle,"Time,Open,High,Low,Close,Name,Sector,Importance,Actual,Forecast,Previous"); //write csv header

   MqlCalendarValue values[]; //https://www.mql5.com/en/docs/constants/structures/mqlcalendar#mqlcalendarvalue
   for (uint i=0; i<size-1; i++)
      {
         news_data.time[i] = rates[i].time;
         news_data.open[i] = rates[i].open;
         news_data.high[i] = rates[i].high;
         news_data.low[i] = rates[i].low;
         news_data.close[i] = rates[i].close;

         int all_news = CalendarValueHistory(values, rates[i].time, rates[i+1].time, NULL, NULL); //we obtain all the news with their values https://www.mql5.com/en/docs/calendar/calendarvaluehistory

         for (int n=0; n<all_news; n++)
            {
              MqlCalendarEvent event;
              CalendarEventById(values[n].event_id, event); //Here among all the news we select one after the other by its id https://www.mql5.com/en/docs/calendar/calendareventbyid

              MqlCalendarCountry country; //The couhtry where the currency pair originates
              CalendarCountryById(event.country_id, country); //https://www.mql5.com/en/docs/calendar/calendarcountrybyid

              if (StringFind(Symbol(), country.currency)>-1) //We want to ensure that we filter news that has nothing to do with the base and the quote currency for the current symbol pair
                {
                     news_data.name[i] = event.name;
                     news_data.sector[i] = event.sector;
                     news_data.importance[i] = event.importance;

                     news_data.actual[i] = !MathIsValidNumber(values[n].GetActualValue()) ? 0 : values[n].GetActualValue();
                     news_data.forecast[i] = !MathIsValidNumber(values[n].GetForecastValue()) ? 0 : values[n].GetForecastValue();
                     news_data.previous[i] = !MathIsValidNumber(values[n].GetPreviousValue()) ? 0 : values[n].GetPreviousValue();
                }
            }

          FileWrite(csv_handle,StringFormat("%s,%f,%f,%f,%f,%s,%s,%s,%f,%f,%f",
                                 (string)news_data.time[i],
                                 news_data.open[i],
                                 news_data.high[i],
                                 news_data.low[i],
                                 news_data.close[i],
                                 news_data.name[i],
                                 EnumToString(news_data.sector[i]),
                                 EnumToString(news_data.importance[i]),
                                 news_data.actual[i],
                                 news_data.forecast[i],
                                 news_data.previous[i]
                               ));
       }
//---

   FileClose(csv_handle);
 }
在SaveNews函数中采集完新闻数据后,获取到的数据会以CSV格式保存至“公共路径”(文件夹)中。
在Python脚本中,我们再从同一目录下加载这份数据。
from Trade.TerminalInfo import CTerminalInfo
import os

terminal = CTerminalInfo()
data_path = os.path.join(terminal.common_data_path(), "Files")

timeframe = "PERIOD_H1"
df = pd.read_csv(os.path.join(data_path, f"{symbol}.{timeframe}.OHLC + News.csv"))

df
输出:
| 时间 | 开盘价 | 最高价 | 最低价 | 收盘价 | 名称 | 领域 | 重要性 | 实际值 | 预测值 | 先前值 | |
|---|---|---|---|---|---|---|---|---|---|---|---|
| 0 | 2023.01.02 01:00:00 | 1.06967 | 1.06983 | 1.06927 | 1.06983 | New Year's Day | CALENDAR_SECTOR_HOLIDAYS | CALENDAR_IMPORTANCE_NONE | 0.0 | 0.0 | 0.0 |
| 1 | 2023.01.02 02:00:00 | 1.06984 | 1.07059 | 1.06914 | 1.07041 | New Year's Day | CALENDAR_SECTOR_HOLIDAYS | CALENDAR_IMPORTANCE_NONE | 0.0 | 0.0 | 0.0 |
| 2 | 2023.01.02 03:00:00 | 1.07059 | 1.07069 | 1.06858 | 1.06910 | New Year's Day | CALENDAR_SECTOR_HOLIDAYS | CALENDAR_IMPORTANCE_NONE | 0.0 | 0.0 | 0.0 |
| 3 | 2023.01.02 04:00:00 | 1.06909 | 1.06909 | 1.06828 | 1.06880 | New Year's Day | CALENDAR_SECTOR_HOLIDAYS | CALENDAR_IMPORTANCE_NONE | 0.0 | 0.0 | 0.0 |
| 4 | 2023.01.02 05:00:00 | 1.06881 | 1.07029 | 1.06880 | 1.06897 | New Year's Day | CALENDAR_SECTOR_HOLIDAYS | CALENDAR_IMPORTANCE_NONE | 0.0 | 0.0 | 0.0 |
由于我们在MQL5脚本中逐行采集新闻数据,最终新闻列中会出现部分标记为"(null)"的行,代表该时刻无新闻,我们需要过滤掉这些行。
news_df = df[df['Name'] != "(null)"].copy()
和之前为模型构造只包含ds和y两列的数据格式类似,节假日数据集也必须保证只有两列 —— ds和holiday。holiday列用于存放新闻事件名称。
holidays = news_df[['Time', 'Name']].rename(columns={
    'Time': 'ds',
    'Name': 'holiday'
})

holidays['ds'] = pd.to_datetime(holidays['ds'])  # Ensure datetime format
holidays
输出:
| ds | holiday | |
|---|---|---|
| 0 | 2023-01-02 01:00:00 | New Year's Day |
| 1 | 2023-01-02 02:00:00 | New Year's Day |
| 2 | 2023-01-02 03:00:00 | New Year's Day |
| 3 | 2023-01-02 04:00:00 | New Year's Day |
| 4 | 2023-01-02 05:00:00 | New Year's Day |
除这些字段外,节假日数据框还可以包含两个可选列:lower_window和upper_window。这两列用来告诉模型,每个节假日事件在发生之前和之后分别会产生多长时间的影响。
我们了解到,现实中任何节假日并不会只在当天产生影响,通常在其发生前后都会产生持续效应。
holidays['lower_window'] = 0
holidays['upper_window'] = 1  # Extend effect to 1 hour after
lower_window列表示该节假日 / 事件在发生之前对时间序列产生的影响时长,而upper_window列表示在发生之后的影响时长。
- lower_window的取值小于或等于0(≤0),默认值为0,表示该事件不会影响之前的数据。取值为-1表示该事件会影响其发生前的一个时间点数据,依此类推。
- upper_window的取值大于或等于0(≥0),默认值为0,表示该事件不会影响之后的数据。取值为1表示该事件会影响其发生后的一个时间点数据,依此类推。
现在,让我们按照上述说明添加这些特征。
holidays['lower_window'] = -1 # The anticipation of the news affect the volatility 1 bar before it's release
holidays['upper_window'] = 1  # The news affects the volatility 1 bar after its release

holidays
我们的节假日数据框则变为:
| ds | holiday | lower_window | upper_window | |
|---|---|---|---|---|
| 0 | 2023-01-02 01:00:00 | New Year's Day | -1 | 1 |
| 1 | 2023-01-02 02:00:00 | New Year's Day | -1 | 1 |
| 2 | 2023-01-02 03:00:00 | New Year's Day | -1 | 1 |
| 3 | 2023-01-02 04:00:00 | New Year's Day | -1 | 1 |
| 4 | 2023-01-02 05:00:00 | New Year's Day | -1 | 1 |
| ... | ... | ... | ... | ... |
| 15369 | 2025-06-20 18:00:00 | Eurogroup Meeting | -1 | 1 |
| 15370 | 2025-06-20 19:00:00 | Eurogroup Meeting | -1 | 1 |
| 15371 | 2025-06-20 20:00:00 | Eurogroup Meeting | -1 | 1 |
| 15372 | 2025-06-20 21:00:00 | Eurogroup Meeting | -1 | 1 |
| 15373 | 2025-06-20 22:00:00 | Eurogroup Meeting | -1 | 1 |
最后,我们将构造好的节假日数据集与之前准备好的训练数据一并传入Prophet模型。
model_w_holidays = Prophet(holidays=holidays)
model_w_holidays.fit(prophet_df_train)
和之前一样,我们可以绘制预测值与真实值的对比曲线,来测试加入节假日后的模型预测效果。
# Predict on training set with model
test_fcst = model_w_holidays.predict(df=prophet_df_test)

test_pred = test_fcst.yhat # We get the predictions

# Plot the forecast with the actuals

f, ax = plt.subplots(figsize=(10,5))
ax.scatter(prophet_df_test["ds"], prophet_df_test['y'], color='r')

fig = model_w_holidays.plot(test_fcst, ax=ax)
输出:
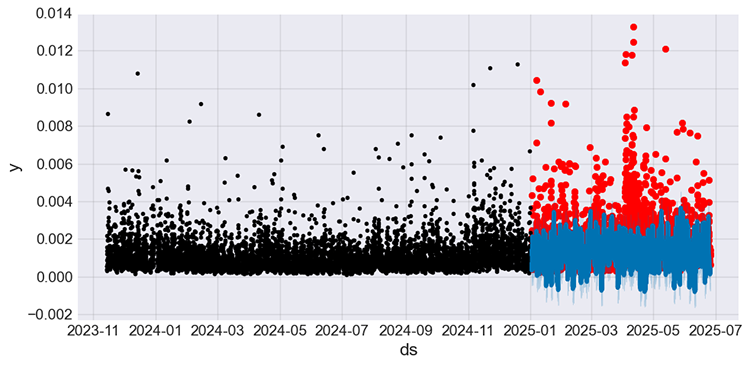
图例08
与图例05中未加入新闻(节假日)的模型预测结果不同 —— 之前的预测曲线显得较为呆板,而加入了新闻事件的新模型,能够捕捉到一些原模型遗漏的波动。
我们再次使用与之前相同的评估指标,对该模型进行评测。
results = forecast_accuracy(test_pred, prophet_df_test["y"])

for metric_name, value in results.items():
    print(f"{metric_name:<10}: {value:.6f}")
输出:
mape      : 0.549152
me        : -0.000633
mae       : 0.000970
mpe       : -0.175082
rmse      : 0.001487
minmax    : 0.461444
r2_score  : -2.793478
MAPE指标显示,模型预测精度提升了约10%。之前的模型误差约为60%,而当前模型误差约为55%。这一提升在决定系数r2_score上也同样能体现。
误差仍有55%的模型依然不算理想,理想模型的误差至少要低于50%(< 50%),但我们仍可以通过优化节假日(新闻事件)的处理方式来进一步改进模型。
在本例中,我们将lower_window和upper_window分别固定设置为-1和1,表示新闻在发布前后各一个K线周期内影响市场波动。虽然这一设置让模型效果有所提升,但我仍质疑它并非最优方案。
我们了解到,不同新闻的影响时长和力度各不相同,对所有新闻使用固定值本质上是不合理的。此外,我们使用了全部新闻,包括重要性较低的消息,而交易者通常会忽略这类新闻 —— 因为它们出现过于频繁,且很难在图表上观测和衡量其影响。
要解决这两个问题,必须根据新闻类型及其历史可观测影响,动态设置lower_window和upper_window。
示例伪代码如下:
def get_windows(name):
    if "CPI" in name:
        return (-1, 4) # CPI news affects one previous bar volatility, and it affects the volatility of four bars ahead (4 hours impact forward)
    elif "NFP" in name:
        return (-1, 2) # NFP news affects one previous bar volatility, and it affects the volatility of two bars ahead (2 hours impact afterward)
    elif "FOMC" in name or "Rate" in name:
        return (-2, 6) # NFP news affects two previous bar volatility, and it affects the volatility of six bars ahead (6 hours impact afterward)
    else:
        return (0, 1)  # Default


holidays[['lower_window', 'upper_window']] = holidays['holiday'].apply(
    lambda name: pd.Series(get_windows(name))
)
由于新闻的类型多达数万种,且必须确保所设置的影响数值准确可靠,这种实现方式难度极大,但的确是最理想的方案。所以,这部分就当作课后练习吧。
就目前而言,最直接可行的做法是:对新闻进行筛选,只保留高重要性和中等重要性的新闻事件。
news_df = df[
    (df['Name'] != "(null)") & # Filter rows without news at all
    ((df['Importance'] == "CALENDAR_IMPORTANCE_HIGH") | (df['Importance'] == "CALENDAR_IMPORTANCE_MODERATE")) # Filter other news except high importance news
].copy()

news_df
输出:
| 时间 | 开盘价 | 最高价 | 最低价 | 收盘价 | 名称 | 领域 | 重要性 | 实际值 | 预测值 | 先前值 | |
|---|---|---|---|---|---|---|---|---|---|---|---|
| 7 | 2023.01.02 08:00:00 | 1.06921 | 1.06973 | 1.06724 | 1.06858 | S&P Global Manufacturing PMI | CALENDAR_SECTOR_BUSINESS | CALENDAR_IMPORTANCE_MODERATE | 47.10 | 47.400 | 47.400 |
| 8 | 2023.01.02 09:00:00 | 1.06878 | 1.06909 | 1.06627 | 1.06784 | S&P Global Manufacturing PMI | CALENDAR_SECTOR_BUSINESS | CALENDAR_IMPORTANCE_MODERATE | 47.80 | 47.800 | 47.800 |
| 31 | 2023.01.03 08:00:00 | 1.06636 | 1.06677 | 1.06514 | 1.06524 | Unemployment | CALENDAR_SECTOR_JOBS | CALENDAR_IMPORTANCE_MODERATE | 2.52 | 2.522 | 2.538 |
| 37 | 2023.01.03 14:00:00 | 1.05283 | 1.05490 | 1.05241 | 1.05355 | S&P Global Manufacturing PMI | CALENDAR_SECTOR_BUSINESS | CALENDAR_IMPORTANCE_HIGH | 46.20 | 46.200 | 46.200 |
| 38 | 2023.01.03 15:00:00 | 1.05353 | 1.05698 | 1.05304 | 1.05602 | Construction Spending m/m | CALENDAR_SECTOR_HOUSING | CALENDAR_IMPORTANCE_MODERATE | 0.20 | 0.200 | -0.300 |
看起来很不错。在将时间和名称列提取到节假日数据框后,我们再添加lower_window和upper_window的值。
holidays = news_df[['Time', 'Name']].rename(columns={
    'Time': 'ds',
    'Name': 'holiday'
})

holidays['ds'] = pd.to_datetime(holidays['ds'])  # Ensure datetime format

holidays['lower_window'] = 0
holidays['upper_window'] = 1

holidays
模型训练完成后,下方图表中的黑色线条代表训练集真实值,红色线条为测试集真实值,蓝色线条为测试集对应的模型预测结果。
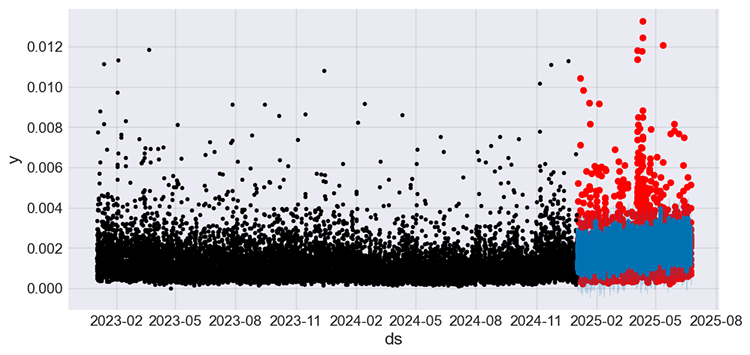
图例09
模型效果得到进一步优化,MAPE指标显示整体误差降至约50%。现阶段我们便可使用该回归模型开展预测工作。
mape      : 0.506827
me        : -0.000053
mae       : 0.000783
mpe       : 0.271597
rmse      : 0.001234
minmax    : 0.320422
r2_score  : -3.318859
您可能已经注意到,我们的新闻数据单独从CSV文件导入,而训练数据则直接从MetaTrader 5中读取并一起使用。
只要"节假日"数据框中的时间戳落在训练区间或未来预测区间内,Prophet模型就会自动将节假日数据与主训练数据的日期进行对齐(同步)。
尽管模型具备日期同步能力,想要充分发挥两组数据的效果,仍需手动确保两份数据集的起始日期一致。
我回过头去修改了main.ipynb从MetaTrader 5中获取价格数据的逻辑,现在的起止日期已与OHLC + News.mq5脚本中的设置保持一致。
# set time zone to UTC
timezone = pytz.timezone("Etc/UTC")

# create 'datetime' objects in UTC-time to avoid the implementation of a local time zone offset
utc_from = datetime(2023, 1, 1, tzinfo=timezone)
utc_to = datetime(2025, 6, 24, hour = 0, tzinfo=timezone)

rates = mt5.copy_rates_range(symbol, timeframe, utc_from, utc_to)
基于Prophet模型开发MetaTrader 5交易机器人
要构建基于Prophet模型的EA,首先必须让模型对目标变量(本例中为波动率)进行实时预测。
为此,我们需要一套流程,一次性获取市场最新行情数据(交易品种)以及最新新闻数据。在训练脚本main.ipynb中,我们通过MetaTrader5-Python库从MetaTrader 5获取数据,但该库无法获取新闻,因此这一步必须使用MQL5来完成。
整体思路:在Python脚本(交易机器人)与 MQL5智能交易系统(EA)之间进行数据交互。
- 将名为Data for Prophet.mq5的EA加载到MetaTrader 5图表上,它会定期将MetaTrader 5中的新闻数据与OHLC价格数据保存到共享文件夹的CSV文件中。
- 随后,从Python脚本(Prophet-trading-bot.py)读取该文件,定期重新训练Prophet模型。
- 训练完成后,使用模型生成预测值,并在同一Python脚本内依据预测结果做出交易决策。
文件名:Data for Prophet.mq5
input uint collect_news_interval_seconds = 60;
input uint training_bars = 1000;

input ENUM_TIMEFRAMES timeframe = PERIOD_H1;
//... other lines of code
//+------------------------------------------------------------------+
//| Expert initialization function                                   |
//+------------------------------------------------------------------+
int OnInit()
  {
//--- create timer

   EventSetTimer(collect_news_interval_seconds);

   if (!ChartSetSymbolPeriod(0, Symbol(), timeframe))
      return INIT_FAILED;
//---
   return(INIT_SUCCEEDED);
  }
//+------------------------------------------------------------------+
//| Expert deinitialization function                                 |
//+------------------------------------------------------------------+
void OnDeinit(const int reason)
  {
//--- destroy timer
   EventKillTimer();
  }
//+------------------------------------------------------------------+
//| Expert tick function                                             |
//+------------------------------------------------------------------+
void OnTick()
  {
//---
  }
//+------------------------------------------------------------------+
//| Timer function                                                   |
//+------------------------------------------------------------------+
void OnTimer()
  {
//---
   MqlDateTime time_struct;
   TimeToStruct(TimeGMT(), time_struct);

   SaveNews(StringFormat("%s.%s.OHLC.date=%s.hour=%d + News.csv",Symbol(),EnumToString(timeframe), TimeToString(TimeGMT(), TIME_DATE), time_struct.hour));
  }
为确保使用的文件正确,CSV文件名中会包含日期和当前小时(UTC时间)。
该EA默认通过OnTimer函数,每分钟采集一次新闻及其他数据并保存至CSV文件中。
在Python脚本中,我们同样从公共文件夹读取该CSV文件并导入数据。
文件名:Prophet-trading-bot.py
def prophet_vol_predict() -> float:

    # Getting the data with news

    now_utc = datetime.utcnow()
    current_date = now_utc.strftime("%Y.%m.%d")
    current_hour = now_utc.hour

    filename = f"{symbol}.{timeframe}.OHLC.date={current_date}.hour={current_hour} + News.csv" # the same file naming as in MQL5 script
    common_path = os.path.join(terminal.common_data_path(), "Files")
    csv_path = os.path.join(common_path, filename)

    # Keep trying to read a CSV file until it is found, as there could be a temporary difference in values for the file due to the change in time
    while True:
        if os.path.exists(csv_path):
            try:
                rates_df = pd.read_csv(csv_path)
                rates_df["Time"] = pd.to_datetime(rates_df["Time"], unit="s", errors="ignore")  # Convert time from seconds to datetime

                print("File loaded successfully.")
                break  # Exit the loop once file is read
            except Exception as e:
                print(f"Error reading the file: {e}")
                time.sleep(30)
        else:
            print("File not found. Retrying in 30 seconds...")
            time.sleep(30)
我们构造波动率列,并分别为训练数据和节假日数据提取对应的新闻名称。
# Getting continous variables for the prophet model

prophet_df = pd.DataFrame({
    "time": rates_df["Time"],
    "volatility": rates_df["High"] - rates_df["Low"]
}).set_index("time")

prophet_df = prophet_df.reset_index().rename(columns={"time": "ds", "volatility": "y"}).copy()

print("Prophet df\n",prophet_df.head())

# Getting the news data for the model as well

news_df = rates_df[
    (rates_df['Name'] != "(null)") & # Filter rows without news at all
    ((rates_df['Importance'] == "CALENDAR_IMPORTANCE_HIGH") | (rates_df['Importance'] == "CALENDAR_IMPORTANCE_MODERATE")) # Filter other news except high importance news
].copy()

holidays = news_df[['Time', 'Name']].rename(columns={
    'Time': 'ds',
    'Name': 'holiday'
})

holidays['ds'] = pd.to_datetime(holidays['ds'])  # Ensure datetime format

holidays['lower_window'] = 0
holidays['upper_window'] = 1

print("Holidays df\n", holidays)
在prophet_vol_pred函数的最后,我们用获取到的数据训练模型,并返回单个预测值,该值代表模型预测的市场下一根K线的波动率。
    # re-training the prophet model

    prophet_model = Prophet(holidays=holidays)
    prophet_model.fit(prophet_df)

    # Making future predictions

    future = prophet_model.make_future_dataframe(periods=1) # prepare the dataframe for a single value prediction
    forecast = prophet_model.predict(future) # Predict the next one value

    return forecast.yhat[0] # return a single predicted value
与其他用于时间序列预测的机器学习模型类似,我们必须频繁更新模型,使其纳入与未来预测相关的最新数据。这也是我们在每次进行新预测前,都会重新训练模型的主要原因。
现在运行该函数,观察输出结果。
print("predicted volatility: ",prophet_vol_predict())
输出:
文件加载成功。
Prophet df
                     ds        y
0  2025.04.29 01:00:00  0.00100
1  2025.04.29 02:00:00  0.00210
2  2025.04.29 03:00:00  0.00170
3  2025.04.29 04:00:00  0.00215
4  2025.04.29 05:00:00  0.00278
Holidays df
                      ds                                     holiday  lower_window  upper_window
8   2025-04-29 09:00:00                        GfK Consumer Climate             0             1
14  2025-04-29 15:00:00          Retail Inventories excl. Autos m/m             0             1
31  2025-04-30 08:00:00                       Consumer Spending m/m             0             1
33  2025-04-30 10:00:00                                Unemployment             0             1
35  2025-04-30 12:00:00                                     GDP y/y             0             1
..                  ...                                         ...           ...           ...
978 2025-06-24 19:00:00                 FOMC Member Williams Speech             0             1
979 2025-06-24 20:00:00                         2-Year Note Auction             0             1
982 2025-06-24 23:00:00  Fed Vice Chair for Supervision Barr Speech             0             1
984 2025-06-25 01:00:00                            Jobseekers Total             0             1
994 2025-06-25 11:00:00  Bbk Executive Board Member Mauderer Speech             0             1

[186 rows x 4 columns]
16:01:50 - cmdstanpy - INFO - Chain [1] start processing
16:01:50 - cmdstanpy - INFO - Chain [1] done processing
predicted volatility:  0.0013592111956094713
既然我们已经获取到预测值,就可以将其运用到交易策略中了。
symbol = "EURUSD"
timeframe = "PERIOD_H1"
terminal = CTerminalInfo()
m_position = CPositionInfo()

def main():

    m_symbol = CSymbolInfo(symbol=symbol)

    magic_number = 25062025
    slippage = 100

    m_trade = CTrade(magic_number=magic_number,
                     filling_type_symbol=symbol,
                     deviation_points=slippage)

    m_symbol.refresh_rates() # Get recent information from the market

    # we want to open random buy and sell trades if they don't exist and use the predicted volatility to set our stoploss and takeprofit targets

    predicted_volatility = prophet_vol_predict()
    print("predicted volatility: ",prophet_vol_predict())

    if pos_exists(mt5.POSITION_TYPE_BUY, magic_number, symbol) is False:
        m_trade.buy(volume=m_symbol.lots_min(),
                    symbol=symbol,
                    price=m_symbol.ask(),
                    sl=m_symbol.ask()-predicted_volatility,
                    tp=m_symbol.ask()+predicted_volatility)

    if pos_exists(mt5.POSITION_TYPE_SELL, magic_number, symbol) is False:
        m_trade.sell(volume=m_symbol.lots_min(),
                     symbol=symbol,
                     price=m_symbol.bid(),
                     sl=m_symbol.bid()+predicted_volatility,
                     tp=m_symbol.bid()-predicted_volatility)
上述函数从Prophet模型获取预测波动率,并用于设置交易的止损和止盈目标。在随机开出买入或卖出订单之前,程序会先检查是否已存在同方向持仓,避免重复开单。
函数调用。
main()
结果:
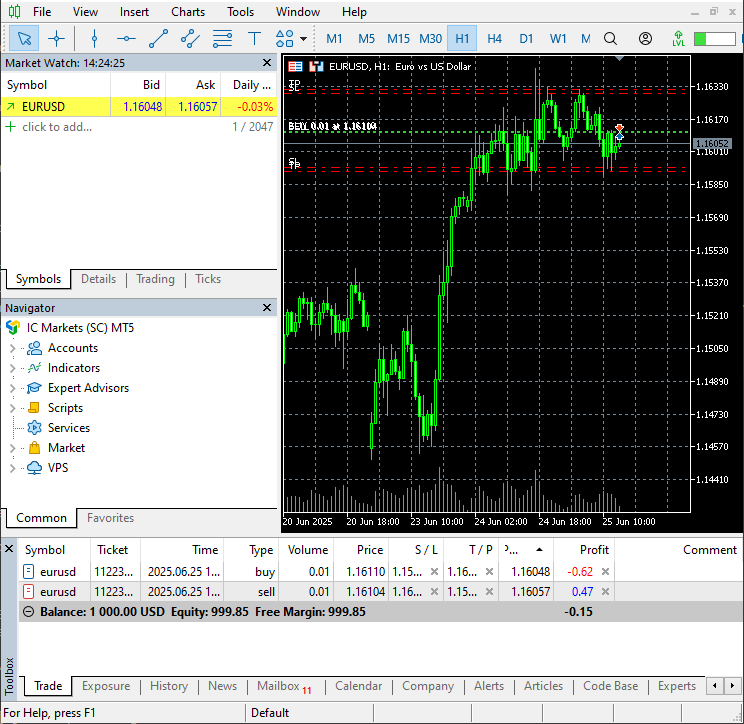
图例10
在MetaTrader 5中开出了两笔反向交易,止损和止盈数值均采用模型预测得出的波动率。
我们可以将这一训练流程自动化,并定期监控交易执行与信号情况。
schedule.every(1).minute.do(main) # train and run trading operations after every one minute

while True:

    schedule.run_pending()
    time.sleep(1)
结论
尽管网上不少文章、帖子和教程都宣称Prophet模型适用于时间序列预测,但我认为,它是本系列文章中我们讨论过效果最差的模型之一。
它或许在预测一些简单的时间序列问题时表现尚可,例如预测受天气、节假日或某种季节性规律影响的商业需求。但金融市场远比这些场景复杂,从展示测试集真实值与预测值的图表(05、06、07、08、09)中就能明显看出问题。Prophet模型的大多数预测值都与实际值偏差较大。
当然您可以通过一些手段对其进行优化,但我建议目前只将它用在简单场景中。
该模型的局限性总结如下:
- 模型结构简单,无法刻画复杂的变量交互关系;
- 对波动率拟合效果差 —— 如上所示,在外汇数据上表现不佳;
- 不支持多变量建模 —— 仅支持时间和目标变量两个特征;
- 对交叉验证和超参数调优的支持有限,很多趋势、季节性与突变点设置仍需自行控制。
谨此结束。
源文件与参考文献
- https://facebook.github.io/prophet/
- https://otexts.com/fpp3/prophet.html
- https://www.geeksforgeeks.org/time-series-analysis-using-facebook-prophet/
- https://www.kaggle.com/code/omegajoctan/time-series-forecasting-with-prophet/edit
附件表
| 文件名 | 说明/用法 |
|---|---|
| Python code\main.ipynb | 用于Prophet模型数据分析与探索的Jupyter notebook |
| Python code\Prophet-trading-bot.py | 基于Python的MetaTrader 5交易机器人 |
| Python code\requirementx.txt | 包含Python依赖项及其版本号的文本文件 |
| Python code\error_description.py | 包含MetaTrader 5所有错误代码说明 |
| Python code\Trade\* | 包含适用于Python的交易类(如CTrade、CPositionInfo等),与MQL5语言中提供的类功能相似 |
| Experts\Data for Prophet.mq5 | EA脚本,用于定期采集并保存训练Prophet模型所需的数据至CSV文件。 |
| Scripts\OHLC + News.mq5 | 用于采集训练Prophet模型所需数据并保存至CSV文件的脚本 |
本文由MetaQuotes Ltd译自英文
原文地址: https://www.mql5.com/en/articles/18549
注意: MetaQuotes Ltd.将保留所有关于这些材料的权利。全部或部分复制或者转载这些材料将被禁止。
本文由网站的一位用户撰写,反映了他们的个人观点。MetaQuotes Ltd 不对所提供信息的准确性负责,也不对因使用所述解决方案、策略或建议而产生的任何后果负责。

 您应该了解的MQL5向导技巧(第七十二部分):MACD与OBV组合形态的监督学习应用
 市场模拟(第 21 部分):SQL 入门(四)
 按小时、星期几和每月日期分析的季节性指标

