
重新定义MQL5与MetaTrader 5指标

概述
MQL5已不再仅仅是用于编写简单交易机器人的简单编程语言。如今,该语言已发展成熟,几乎可以创建出高度复杂的交易程序,并以更稳健、便捷的方式进行部署和测试。
在交易过程中,我们所有人都曾使用过“内置指标”或“自定义指标”。MetaTrader 5提供了简便的界面来加载和附加指标到图表上,这使得交易者(主要是手动交易者)能够以一种便捷的方式使用指标来分析市场。然而,在算法交易中,重要的并非图表上显示的内容,而是指标的计算结果。
例如,在手动交易中,人们可能需要观察移动平均线指标以检测趋势(如果这是他们的目标)。但在算法交易中,我们可能会根据收盘价是否高于或低于在特定数量K线周期上计算出的移动平均值来判断是否存在上升趋势。
在算法交易中,若要使用某个特定指标,例如周期为20的简单移动平均线(SMA),您需要:
int sma_handle; //Declare an indicator handle
//+------------------------------------------------------------------+
//| Expert initialization function                                   |
//+------------------------------------------------------------------+
int OnInit()
  {
   sma_handle = iMA(Symbol(), Period(), 20, 0, MODE_SMA, PRICE_CLOSE); //Initialize the indicator inside the OnInit function

//---
   return(INIT_SUCCEEDED);
  }
//+------------------------------------------------------------------+
//| Expert deinitialization function                                 |
//+------------------------------------------------------------------+
void OnDeinit(const int reason)
  {
//---

  }
//+------------------------------------------------------------------+
//| Expert tick function                                             |
//+------------------------------------------------------------------+
void OnTick()
  {
//---

   double sma_buffer[];
   CopyBuffer(sma_handle, 0, 0, 1, sma_buffer); //Copy the indicator buffers inside the Ontick function
  }
这种方法至少还算方便且运行良好,但它却显得较为简略,无法让我们灵活、自主地决定可以向指标传递哪些信息以进行即时计算。
基于此方法,文档中指出移动平均线(MA)指标只能应用于文档中提供的价格常量之一。
| ID | 描述 |
|---|---|
| PRICE_CLOSE | 收盘价 |
| PRICE_OPEN | 开盘价 |
| PRICE_HIGH | 该时间段内的最高价 |
| PRICE_LOW | 该时间段内的最低价 |
| PRICE_MEDIAN | 中间价(中位价)=(最高价+最低价)/ 2 |
| PRICE_TYPICAL | 典型价格 =(最高价+最低价+收盘价)/ 3 |
| PRICE_WEIGHTED | 平均价格 =(最高价 + 最低价 + 收盘价 + 收盘价)/ 4 |
更不用说,您还受到文档中所述的平滑方法/技术的限制。
| ID | 描述 |
|---|---|
| MODE_SMA | 简单移动平均线 |
| MODE_EMA | 指数移动平均线 |
| MODE_SMMA | 平滑移动平均线 |
| MODE_LWMA | 线性加权移动平均线 |
当您想要尝试一些非传统的方法 时,会发生什么呢?比如说,想要计算最高价与最低价之差的移动平均值,按照目前的方法,这是不可能实现的,因为我们在使用指标时受到了诸多限制和约束。
我明白,大多数指标都是基于其数学定义和推导方式而设定的,但是,如果我们能够向指标传递不同的输入和参数,以便观察市场中的新模式,那岂不是太棒了吗?
受技术分析库(TA-Lib) Python库的启发,这种创新方法旨在让交易者和算法系统开发者能够更灵活地控制输入到指标中的信息,以便立即进行计算。

在本文中,我们将采用这种即插即用的方法来实现一些(最常用的)指标。
按类别分组
趋势指标
- 简单移动平均线指标
- 指数移动平均线指标
- 布林带
- 抛物线转向
- 标准差
振荡器
- 移动平均收敛发散(MACD)
- 相对强弱指数(RSI)
- 随机振荡器
- 平均真实波幅(ATR)
- 动量指标
比尔.威廉姆斯
- 加速振荡器
- 动量振荡器
简单移动平均线(SMA)指标
这是最常用的技术指标之一,它计算指定周期内价格序列的平均值。
由以下公式给出:
![]()
其中:
-
 价格在此(例如,某个
  时间段内的收盘价)。
 -
 SMA的周期。
我们可以轻松地通过向量化函数实现这个公式。
文件:ta-lib.mqh
vector CTrendIndicators::SMA(const vector &price, uint period, uint shift = 0)
  {
   uint size = (uint)price.Size();

   if(!CheckShiftPeriod(size, period, shift))
      return price;

//---

   vector ma(size);
   ma.Fill(NaN);

   for(uint i = shift + period - 1; i < size; i++) //Loop through all the prices considering the period and shift
     {
      double sum = 0;
      for(uint j = i - period + 1; j <= i; j++)
         sum += price[j]; //sum of the prices

      ma[i] = sum / period; //divided by period to find the mean of that period
     }

   return ma;
  }
SMA指标就是这样计算的,无需部署缓冲区,也无需在为特定交易品种加载指标时检查MQL5错误等,因为这些操作可能会很繁琐。
这种极简方法仅检查偏移量和周期值是否正确,如果正确,函数将继续进行指标计算,并以向量形式返回计算值。我决定使用向量格式,以便对最终结果拥有更多的控制和灵活性。
由于指标类中的所有函数都是静态的,因此我们可以轻松地在MQL5程序中访问指标值,例如,在一个简单的脚本中。
文件:自定义指标测试脚本.mq5
#include <ta-lib.mqh>
//+------------------------------------------------------------------+
//| Script program start function                                    |
//+------------------------------------------------------------------+
void OnStart()
  {
     vector prices = {1,2,3,4,5,6,7,8,9,10};
     int period = 3;

     Print("SMA values: ", CTrendIndicators::SMA(prices, period));
  }
输出:
2025.01.21 09:57:35.727 Custom Indicators test script (EURUSD,H1) SMA values: [nan,nan,2,3,4,5,6,7,8,9]
像这样,我们得以根据一组数值向量计算出了SMA指标。稍后,还将讨论如何绘制这些数值以形成可视化指标。
指数移动平均线(EMA)指标
EMA的计算方式与简SMA类似,也是对特定周期内的价格序列求平均值,但不同的是,它给予近期价格更大的权重,因此与SMA相比,它对价格变化的反应更为灵敏。
由以下公式给出:
![]()
其中:
-
 时间t时的EMA值。
 - 时间t时的价格Pt。
-
 上一期的EMA值。
 -
 平滑因子(其中n为周期)。
我们可以在MQL5中按照如下方式实现:
文件:ta-lib.mqh
vector CTrendIndicators::EMA(const vector &price, uint period, uint shift = 0)
  {
   uint size = (uint)price.Size();

   if(!CheckShiftPeriod(size, period, shift))
      return price;

//---

   double alpha = 2.0 / (period + 1.0);    // Smoothing factor

   vector res(size);
   res.Fill(NaN);

// Initialize the EMA with the SMA of the first period

   vector sma = SMA(price, period, shift);
   res[period - 1 + shift] = sma[period - 1 + shift];

// Calculate EMA for the rest of the prices

   for(ulong i = period + shift; i < size; i++)
      res[i] = alpha * price[i] + (1 - alpha) * res[i - 1];

   return res;
  }
我们可以采用与计算SMA时类似的方法,来获取计算出的指标值。
文件:自定义指标测试脚本.mq5
void OnStart()
  {
     vector prices = {1,2,3,4,5,6,7,8,9,10};
     int period = 3;

     Print("EMA values: ", CTrendIndicators::EMA(prices, period));
  }
输出:
2025.01.21 10:19:54.291 Custom Indicators test script (EURUSD,H1) EMA values: [nan,nan,2,3,4,5,6,7,8,9]
我们已分别计算了SMA和EMA指标,这与内置的IMA指标中的计算方式不同,内置IMA指标提供了选择平滑方法的选项。
这种分开计算的方法需要编写额外的代码行来实现所有移动平均线指标的平滑方法。
诸如MODE_SMMA(平滑平均) 和(MODE_LWMA)线性加权平均等平滑方法的函数尚未在库中实现,因为我认为它们不像对应的(SMA和EMA平滑方法)那样常用。
布林带指标
这是一个由三条带组成的波动率指标。
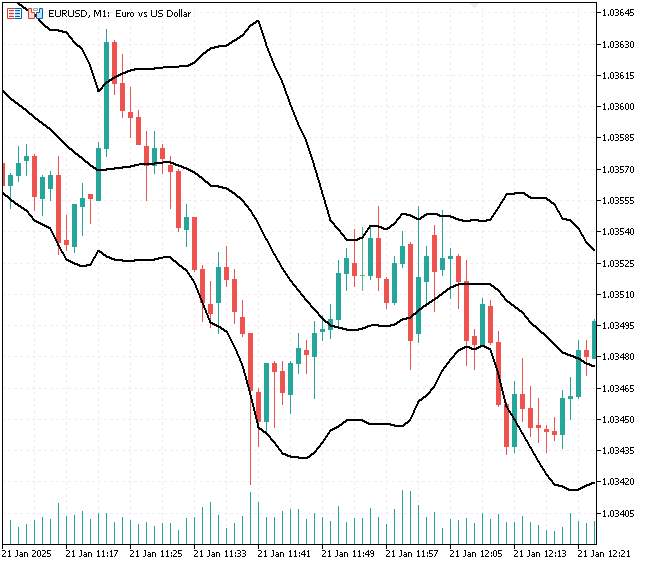
- 中轨是特定时间段内收盘价的SMA。

- 上轨是中轨加上同一时间段内收盘价标准差的一定倍数。

其中:
-
 该倍数通常为2(布林带的标准设置值),
 -
 用于计算SMA和标准差的周期。
由于该指标需要返回三个一维(1D)值(在使用内置布林带指标时,这些值被称为缓冲区),因此我们让该函数返回一个包含3个向量的结构体。
文件:ta-lib.mqh
struct BB_res_struct
  {
   vector            upper_band;
   vector            lower_band;
   vector            middle_band;
  };
BB_res_struct CTrendIndicators::BollingerBands(const vector &price, uint period, uint shift = 0, double k = 2.0)
  {
   uint size = (uint)price.Size();

   BB_res_struct res;

//--- Check for valid parameters
   if(!CheckShiftPeriod(size, period, shift))
      return res;

//--- Initialize vectors

   res.upper_band.Resize(size);
   res.lower_band.Resize(size);

   res.upper_band.Fill(NaN);
   res.lower_band.Fill(NaN);

//--- Calculate the middle band (SMA)

   res.middle_band = SMA(price, period, shift);

//--- Calculate the upper and lower bands

   for(uint i = shift + period - 1; i < size; i++)
     {
      double sum_squared_diff = 0;
      for(uint j = i - period + 1; j <= i; j++)
        {
         sum_squared_diff += MathPow(price[j] - res.middle_band[i], 2);
        }

      double std_dev = MathSqrt(sum_squared_diff / period);

      res.upper_band[i] = res.middle_band[i] + (k * std_dev);
      res.lower_band[i] = res.middle_band[i] - (k * std_dev);
     }

   return res;
  }
以下是轻松实现布林带指标并获取其值的操作方法。
文件:自定义指标测试脚本.mq5
void OnStart()
  {
     vector prices = {1,2,3,4,5,6,7,8,9,10};
     int period = 3;

     BB_res_struct bb;
     bb = CTrendIndicators::BollingerBands(prices,period,0,2);

     Print("BB upper: ",bb.upper_band);
     Print("BB middle: ",bb.middle_band);
     Print("BB lower: ",bb.lower_band);
  }
输出:
RL      0       11:39:21.000    Custom Indicators test script (EURUSD,H1)       BB upper: [nan,nan,3.632993161855452,4.632993161855453,5.632993161855453,6.632993161855453,7.632993161855453,8.632993161855453,9.632993161855453,10.63299316185545]
RO      0       11:39:21.000    Custom Indicators test script (EURUSD,H1)       BB middle: [nan,nan,2,3,4,5,6,7,8,9]
FF      0       11:39:21.000    Custom Indicators test script (EURUSD,H1)       BB lower: [nan,nan,0.3670068381445479,1.367006838144548,2.367006838144548,3.367006838144548,4.367006838144547,5.367006838144547,6.367006838144547,7.367006838144547]
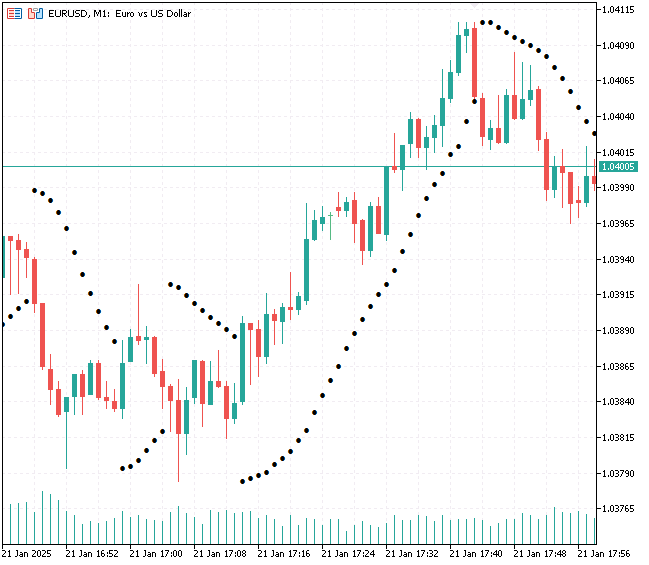
抛物线转向指标(即停损转向操作点指标)
这是一种趋势跟踪指标,用于识别市场中潜在的反转点。它会根据趋势方向在价格上方或下方放置点状标记。
由以下公式给出:
上行趋势
![]()
下行趋势
![]()
其中:
-
 = 下一周期的抛物线转向指标(SAR)值
 -
 = 加速度因子(初始值为默认值,例如0.02,每当达到新的高点/低点时增加0.02,最高增至0.2)
 -
 = 极值点(在上升趋势中为最高点,在下降趋势中为最低点)
该指标在MQL5中可按如下方式实现。
文件:ta-lib.mqh
vector CTrendIndicators::ParabolicSAR(const vector &high,
                                      const vector &low,
                                      const vector &close,
                                      double step = 0.02,
                                      double max = 0.2)
  {
   uint size = (uint)close.Size();
   vector psar(size);
   psar.Fill(NaN);

// Initialize variables

   double AF = step;    // Acceleration Factor
   double EP = high[0];      // Extreme Point
   double SAR = low[0];      // Initial SAR
   bool isUptrend = true;    // Assume uptrend at the start

// Calculate Parabolic SAR

   for(uint i = 0; i < size; i++)
     {
      // Update SAR
      if(isUptrend)
         SAR = SAR + AF * (EP - SAR);
      else
         SAR = SAR + AF * (SAR - EP);

      // Determine if trend changes
      if(isUptrend && SAR > low[i])
        {
         // Switch to downtrend
         isUptrend = false;
         SAR = EP;            // Reset SAR to the most recent EP
         EP = low[i];         // Reset EP
         AF = step;      // Reset AF
        }

      else
         if(!isUptrend && SAR < high[i])
           {
            // Switch to uptrend
            isUptrend = true;
            SAR = EP;            // Reset SAR to the most recent EP
            EP = high[i];        // Reset EP
            AF = step;      // Reset AF
           }

      // Update EP and AF
      if(isUptrend)
        {
         if(high[i] > EP)
           {
            EP = high[i];
            AF = MathMin(AF + step, max);
           }
        }
      else
        {
         if(low[i] < EP)
           {
            EP = low[i];
            AF = MathMin(AF + step, max);
           }
        }

      // Store the SAR value
      psar[i] = SAR;
     }

   return psar;
  }
与前两个仅需接收单个价格向量作为输入的趋势跟踪指标不同,抛物线转向指标需考虑三个价格值(最高价、最低价和收盘价)。
文件:自定义指标测试脚本.mq5
void OnStart()
  {
     vector close = {1,2,3,4,5,6,7,8,9,10};
     vector high = {1.5,2.5,3.5,4.5,5.5,6.5,7.5,8.5,9.5,10.5};
     vector low = {0.5,1.5,2.5,3.5,4.5,5.5,6.5,7.5,8.5,9.5};

     Print("Parabolic SAR values: ", CTrendIndicators::ParabolicSAR(high,low,close,0.02,0.2));
  }
输出:
2025.01.21 11:11:03.525 Custom Indicators test script (EURUSD,H1) Parabolic SAR values: [1.5,0.5,0.54,0.6584000000000001,0.8888960000000001,1.25778432,1.782005888,2.46816518144,3.3126220560384,4.302602527072256]
标准差指标
该指标用于衡量价格与其平均值的变动幅度或离散程度。常用作评估市场的波动性。
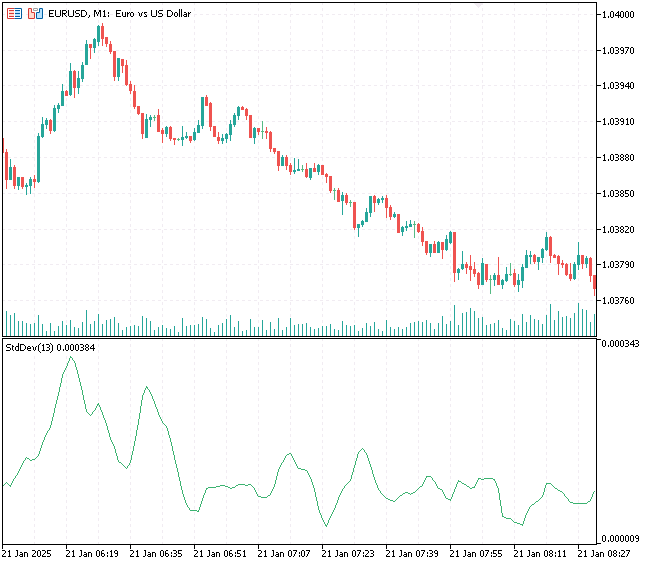
标准差值较高表明市场波动性较大,而标准差值较低则表明市场波动性较小。
由以下公式给出:
![]()
其中:
-
 = 标准差
= 标准差 - n = 周期
-
 = 价格点
= 价格点 -
 = 数据点的均值
我们可以在MQL5中按如下方式实现该指标:
文件:ta-lib.mqh
vector CTrendIndicators::StandardDeviation(const vector &price, uint period, uint shift = 0)
  {
   uint size = (uint)price.Size();

// Check if the period and shift are valid
   if(!CheckShiftPeriod(size, period, shift))
      return price;

// Initialize standard deviation vector
   vector std_dev(size);
   std_dev.Fill(NaN);

// Loop through the price data
   for(uint i = shift + period - 1; i < size; i++)
     {
      double sum = 0.0;
      double sum_sq_diff = 0.0;

      // Calculate mean
      for(uint j = i - period + 1; j <= i; j++)
         sum += price[j];
      double mean = sum / period;

      // Calculate squared differences
      for(uint j = i - period + 1; j <= i; j++)
         sum_sq_diff += MathPow(price[j] - mean, 2);

      // Calculate standard deviation
      std_dev[i] = MathSqrt(sum_sq_diff / period);
     }

   return std_dev;
  }
这是另一个简单指标,可按如下方式调用。
文件:自定义指标测试脚本.mq5
void OnStart()
  {
     vector prices = {1,2,3,4,5,6,7,8,9,10};
     int period = 3;

     Print("Stddev values: ", CTrendIndicators::StandardDeviation(prices, period));
  }
输出:
2025.01.21 11:55:11.657 Custom Indicators test script (EURUSD,H1) Stddev values: [nan,nan,0.816496580927726,0.816496580927726,0.816496580927726,0.816496580927726,0.816496580927726,0.816496580927726,0.816496580927726,0.816496580927726]
移动平均收敛发散(MACD)
该振荡器展示了证券价格两条移动平均线之间的关系。其被广泛用作技术分析工具。

由以下公式给出:
MACD主线
![]()
其中:
-
 = 周期较短的EMA(例如,12周期)
 -
 = 周期较长的EMA(例如,26周期)
信号线
![]()
这是MACD线的平滑移动平均线,通常周期值设为9。
MACD柱状图
这是MACD线与信号线之间的差值。
![]()
与我们返回多个计算得出的布林带数值的方式类似,我们定义了一个结构体,用于返回MACD柱状图、主线(MACD线)和信号线的数值。
文件:ta-lib.mqh
struct MACD_res_struct
  {
   vector            main;     // The MACD Line
   vector            signal;   // The Signal Line
   vector            histogram;    // The MACD Histogram
  };
MACD_res_struct COscillatorIndicators::MACD(const vector &price, uint fast_ema = 12, uint slow_ema = 26, uint macd_sma = 9, uint shift = 0)
  {
   uint size = (uint)price.Size();

   MACD_res_struct res;
   if(!CheckShiftPeriod(size, slow_ema, shift))
      return res;

//--- Calculate EMA(short), EMA(long), and MACD Line

   vector fast_ema_vector = CTrendIndicators::EMA(price, fast_ema, shift);
   vector slow_ema_vector = CTrendIndicators::EMA(price, slow_ema, shift);

   res.main.Resize(size);
   res.main.Fill(NaN);

   for(uint i = 0; i < size; i++)
      res.main[i] = fast_ema_vector[i] - slow_ema_vector[i];

//--- Calculate Signal Line (SMA of MACD Line)

   res.signal = CTrendIndicators::SMA(price, macd_sma, shift);

//--- Calculate MACD Histogram

   res.histogram.Resize(size);
   res.histogram.Fill(NaN);

   for(uint i = 0; i < size; i++)
      res.histogram[i] = res.main[i] - res.signal[i];

   return res;
  }
我们可以在测试脚本中轻松获取计算得出的MACD振荡指标值,具体方法如下:
文件:自定义指标测试脚本.mq5
void OnStart()
  {
     vector prices = {1,2,3,4,5,6,7,8,9,10};

     MACD_res_struct macd;

     macd = COscillatorIndicators::MACD(prices,2,3,4);

     Print("MACD main: ", macd.main);
     Print("MACD signal: ", macd.signal);
  }
输出:
RD      0       12:28:51.368    Custom Indicators test script (EURUSD,H1)       MACD main: [nan,nan,0.5,0.5,0.5,0.5,0.5,0.5,0.5,0.5]
HO      0       12:28:51.368    Custom Indicators test script (EURUSD,H1)       MACD signal: [nan,nan,nan,2.5,3.5,4.5,5.5,6.5,7.5,8.5]
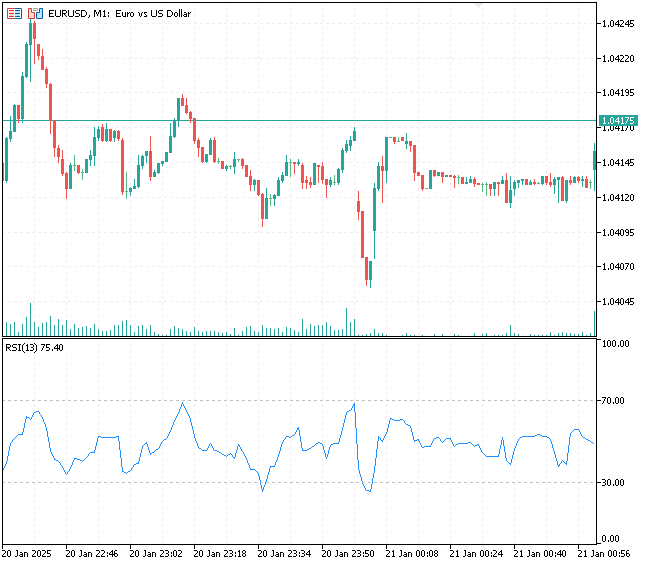
相对强弱指标(RSI)
这是一种动量振荡指标,用于衡量价格变动的速度和幅度。其数值在0到100之间振荡,交易者用它来识别市场中的超买和超卖状况。
RSI指标的计算包含以下步骤:
01:计算指定时间段内的平均收益和平均亏损
![]()
![]()
02:计算相对强弱值(RS)
![]()
03: 计算RSI
![]()
MQL5实现
vector COscillatorIndicators::RSI(const vector &price, uint period, uint shift = 0)
  {
   uint size = (uint)price.Size();

//--- Check for valid parameters
   if(!CheckShiftPeriod(size, period, shift))
      return price;

//--- Initialize vectors
   vector rsi(size), gains(size), losses(size);
   rsi.Fill(NaN);
   gains.Fill(0.0);
   losses.Fill(0.0);

//--- Calculate gains and losses
   for(uint i = shift + 1; i < size; i++)
     {
      double change = price[i] - price[i - 1];
      gains[i] = (change > 0) ? change : 0;
      losses[i] = (change < 0) ? -change : 0;
     }

//--- Initialize first average gain and loss (simple average for the first period)
   double avg_gain = 0, avg_loss = 0;
   for(uint i = shift + 1; i < shift + 1 + period; i++)
     {
      avg_gain += gains[i];
      avg_loss += losses[i];
     }
   avg_gain /= period;
   avg_loss /= period;

//--- Compute RSI for the rest of the periods
   for(uint i = shift + period; i < size; i++)
     {
      // Apply smoothing for average gain and loss
      avg_gain = ((avg_gain * (period - 1)) + gains[i]) / period;
      avg_loss = ((avg_loss * (period - 1)) + losses[i]) / period;

      // Calculate RSI
      double rs = (avg_loss == 0) ? 0 : avg_gain / avg_loss;
      rsi[i] = (avg_loss == 0) ? 100 : (100 - (100 / (1 + rs)));
     }

   return rsi;
  }
以下是获取RSI数值的方法:
void OnStart()
  {
     vector prices = {1,2,3,4,5,6,7,8,9,10};
     int period = 3;

     Print("RSI values: ", COscillatorIndicators::RSI(prices,period));
  }
输出:
2025.01.21 12:51:29.640 Custom Indicators test script (EURUSD,H1) RSI values: [nan,nan,nan,100,100,100,100,100,100,100]
随机振荡器指标
这是一种动量指标,用于将证券的收盘价与其在特定时间段内的价格区间进行比较。
该指标的计算公式包含以下部分:
%K线
![]()
其中:
-
 当期收盘价
当期收盘价 -
 回溯期内的最低价
 -
 回溯期内的最高价
%D线
这是%K线的移动平均值,通常采用3周期SMA来计算。
以下是在MQL5中实现该指标的方法:
Stochastic_struct COscillatorIndicators::StochasticOscillator(const vector &high, const vector &low, const vector &close, uint k_period = 5, uint d_period = 3, uint period = 3, uint shift = 0)
  {
   uint size = (uint)close.Size();

   Stochastic_struct res;

// Check for valid parameters
   if(!CheckShiftPeriod(size, period, shift))
      return res;

// Initialize vectors for %K and %D
   vector K(size), D(size);
   K.Fill(NaN);
   D.Fill(NaN);

// Calculate %K
   for(uint i = shift + period - 1; i < size; i++)
     {
      double H_max = -DBL_MAX, L_min = DBL_MAX;

      // Find the highest high and the lowest low over the lookback period
      for(uint j = i - period + 1; j <= i; j++)
        {
         H_max = MathMax(H_max, high[j]);
         L_min = MathMin(L_min, low[j]);
        }

      // Calculate %K
      double K_value = (H_max - L_min != 0) ? ((close[i] - L_min) / (H_max - L_min)) * 100 : 0;
      K[i] = K_value;
     }

// Smooth %K with a simple moving average (k_period)
   vector smoothedK(size);
   smoothedK.Fill(NaN);

   for(uint i = shift + k_period - 1; i < size; i++)
     {
      double sum = 0;
      for(uint j = i - k_period + 1; j <= i; j++)
        {
         sum += K[j];
        }
      smoothedK[i] = sum / k_period;
     }

// Calculate %D (3-period moving average of %K)

   D = CTrendIndicators::SMA(smoothedK, period, shift);

   res.main = K;
   res.signal = D;

   return res;
  }
我们以结构体的形式返回信号线和主线。
void OnStart()
  {
     vector close = {1,2,3,4,5,6,7,8,9,10};
     vector high = {1.5,2.5,3.5,4.5,5.5,6.5,7.5,8.5,9.5,10.5};
     vector low = {0.5,1.5,2.5,3.5,4.5,5.5,6.5,7.5,8.5,9.5};

     Stochastic_struct stoch;
     stoch = COscillatorIndicators::StochasticOscillator(high,low,close,5,3,3);

     Print("Stoch main: ", stoch.main);
     Print("Stoch signal: ", stoch.signal);
  }
平均真实波幅(ATR)指标
这是一个有助于了解市场波动性的实用指标。它用于衡量特定时间段内最高价与最低价之间的平均波动范围。

由以下公式给出:
01:计算真实范围(TR)
![]()
其中:
- H是当前周期的最高价。
-
 当前周期的最低价。
 -
 上一周期的收盘价。
02:计算ATR
ATR是特定时间段内真实波幅的移动平均值。
![]() SMA是简单移动均线。
SMA是简单移动均线。
我们可以在MQL5中按如下方式实现该指标:
vector COscillatorIndicators::ATR(const vector &high, const vector &low, const vector &close, uint period = 14, uint shift = 0)
  {
   uint size = (uint)close.Size();

// Check for valid parameters
   if(!CheckShiftPeriod(size, period, shift))
      return close;

// Initialize the True Range (TR) and ATR vectors
   vector TR(size);
   TR.Fill(NaN);

// Calculate the True Range for each period
   for(uint i = shift + 1; i < size; i++)
     {
      double H = high[i];
      double L = low[i];
      double C_prev = close[i - 1];

      // Calculate the three possible True Range values
      double TR1 = H - L;
      double TR2 = MathAbs(H - C_prev);
      double TR3 = MathAbs(L - C_prev);

      // True Range is the maximum of the three
      TR[i] = MathMax(TR1, MathMax(TR2, TR3));
     }

//--- Smooth the True Range using a simple moving average (SMA) over the specified period

   return CTrendIndicators::SMA(TR, period, shift);
  }
以下是获取该指标值的方法:
void OnStart()
  {
     vector close = {1,2,3,4,5,6,7,8,9,10};
     vector high = {1.5,2.5,3.5,4.5,5.5,6.5,7.5,8.5,9.5,10.5};
     vector low = {0.5,1.5,2.5,3.5,4.5,5.5,6.5,7.5,8.5,9.5};

     Print("ATR values: ", COscillatorIndicators::ATR(high,low,close,3));
  }
输出:
2025.01.21 13:57:59.943 Custom Indicators test script (EURUSD,H1) ATR values: [nan,nan,nan,1.5,1.5,1.5,1.5,1.5,1.5,1.5]
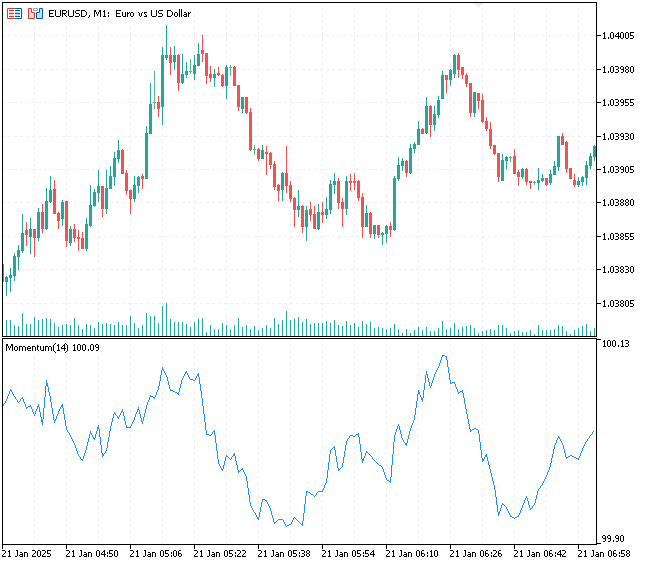
动量指标
这是一个简单的指标,用于衡量资产价格在特定时间段内的变动速度。它有助于识别趋势及潜在的趋势反转。
通过一个简单的公式给出:
![]()
其中:
- Momentum(t) = 时间t时的动量值
- Price(t) = 当前价格
- Price(t - n) = n个周期前的价格
- n = 计算动量所用的周期数
计算动量时,部分变量采用比率形式。
![]()
我们将采用这种变量来实现动量指标。
MQL5实现:
vector COscillatorIndicators::MomentumIndicator(const vector &price, uint period, uint shift = 0)
  {
   uint size = (uint)price.Size();

// Check for valid input
   if(!CheckShiftPeriod(size, period, shift))
      return price;

// Initialize the momentum vector
   vector momentum(size);
   momentum.Fill(NaN);

// Calculate Momentum
   for(uint i = shift + period; i < size; i++)
     {
      //momentum[i] = price[i] - price[i - period]; // Momentum difference formula

      // using the ratio formula:
      momentum[i] = (price[i] / price[i - period]) * 100;
     }

   return momentum;
  }
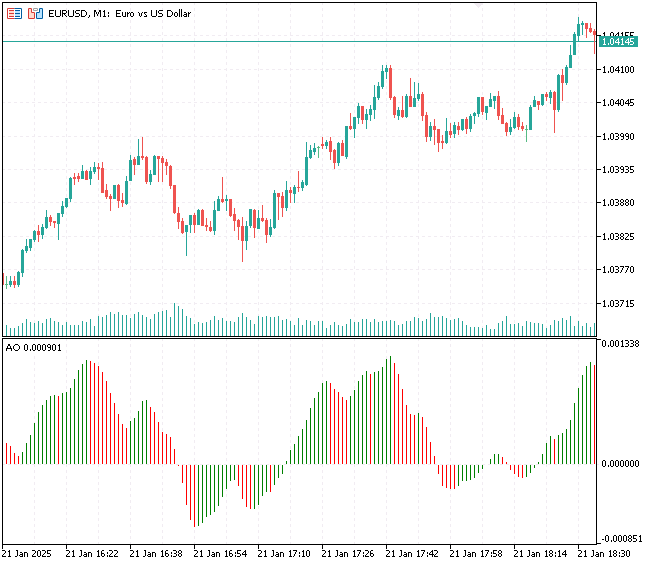
动量振荡器指标
这是一个动量指标,用于计算中位价的两个SMA之间的差值。
由以下公式给出:
![]()
其中:
-
 = 周期较短的SMA(通常为5期)
 -
 = 周期较长的SMA(通常为34期)
以下是MQL5实现代码:
vector CBillWilliamsIndicators::AwesomeOscillator(const vector &high, const vector &low, uint fast_period = 5, uint slow_period = 34, uint shift = 0)
  {
   uint size = (uint)high.Size();
   if(size != low.Size())
      return vector::Zeros(0); // Ensure high and low vectors are of the same size

   if(!CheckShiftPeriod(size, slow_period, shift))
      return vector::Zeros(0); // Validate shift and slow period

// Initialize vectors
   vector ao(size), median_price(size);
   ao.Fill(NaN);
   median_price.Fill(NaN);

// Calculate Median Price
   for(uint i = 0; i < size; i++)
      median_price[i] = (high[i] + low[i]) / 2;

// Calculate Fast and Slow SMAs of the Median Price
   vector sma_fast = CTrendIndicators::SMA(median_price, fast_period, shift);
   vector sma_slow = CTrendIndicators::SMA(median_price, slow_period, shift);

// Calculate AO
   for(uint i = 0; i < size; i++)
      ao[i] = sma_fast[i] - sma_slow[i];

   return ao;
  }
由于我们有最高价和最低价的简单向量数据,因此可以将快速周期设为3,慢速周期设为5。
void OnStart()
  {
     vector close = {1,2,3,4,5,6,7,8,9,10};
     vector high = {1.5,2.5,3.5,4.5,5.5,6.5,7.5,8.5,9.5,10.5};
     vector low = {0.5,1.5,2.5,3.5,4.5,5.5,6.5,7.5,8.5,9.5};

     Print("AO values: ", CBillWilliamsIndicators::AwesomeOscillator(high,low,3,5));
  }
输出:
2025.01.21 14:25:50.590 Custom Indicators test script (EURUSD,H1) AO values: [nan,nan,nan,nan,1,1,1,1,1,1]
加速振荡指标
加速振荡(AC)是一种技术分析工具,用于追踪价格动量变化的速度。该指标可显示市场驱动力是加速还是减速,帮助交易者预判潜在的行情反转。
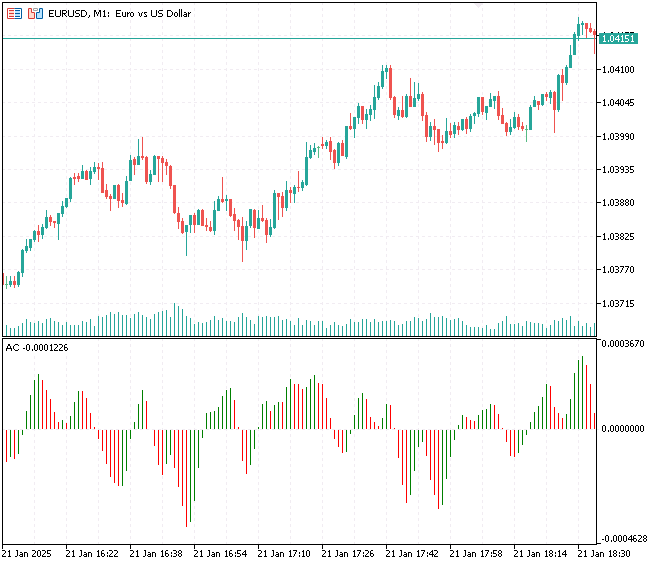
其计算方法为:用动量振荡指标减去该指标的5周期的SMA。
由以下公式给出:
我们可以在MQL5中按如下方式实现该指标:
vector CBillWilliamsIndicators::AcceleratorOscillator(const vector &high,
      const vector &low,
      uint ao_period_fast = 5, // Fast period for AO
      uint ao_period_slow = 34, // Slow period for AO
      uint ac_period = 5 // Period for AC SMA
                                                     )
  {
   uint size = (uint)high.Size();
   if(size != low.Size())
      return vector::Zeros(0); // Ensure high and low vectors are of the same size


// Validate shift and period
   if(!CheckShiftPeriod(size, ao_period_slow, 0))
      return vector::Zeros(0);

// Calculate AO (Awesome Oscillator)

   vector ao = AwesomeOscillator(high, low, ao_period_fast, ao_period_slow);

// Calculate AC (Accelerator Oscillator)

   vector ac(size);
   ac.Fill(NaN);

   vector ao_sma_ac = CTrendIndicators::SMA(ao, ac_period);

   for(uint i = 0; i < size; i++)
      ac[i] = ao[i] - ao_sma_ac[i];

   return ac;
  }
由于加速振荡指标与动量振荡指标极为相似,因此,我们可以使用相似的参数来调用其函数。
void OnStart()
  {
     vector close = {1,2,3,4,5,6,7,8,9,10};
     vector high = {1.5,2.5,3.5,4.5,5.5,6.5,7.5,8.5,9.5,10.5};
     vector low = {0.5,1.5,2.5,3.5,4.5,5.5,6.5,7.5,8.5,9.5};

//--- Bill williams indicator

     Print("AO values: ", CBillWilliamsIndicators::AwesomeOscillator(high,low,3,5));
     Print("AC values: ", CBillWilliamsIndicators::AcceleratorOscillator(high,low,3,5));
  }
输出:
MQ      0       14:40:36.296    Custom Indicators test script (EURUSD,H1)       AO values: [nan,nan,nan,nan,1,1,1,1,1,1]
EL      0       14:40:36.296    Custom Indicators test script (EURUSD,H1)       AC values: [nan,nan,nan,nan,nan,nan,nan,nan,0,0]
指标数据收集简化方案
既然我们已经了解了库中部分指标的实现方式,那么现在可以尝试从市场中收集所需信息,并基于这些信息构建自定义指标。例如,我将计算开盘价、最高价、最低价和收盘价的移动平均线。
我们首先需要获取OHLC(开盘价、最高价、最低价、收盘价)数据。
int size = 1000;

vector open, high, low, close;

open.CopyRates(Symbol(), Period(), COPY_RATES_OPEN, 1, size);
high.CopyRates(Symbol(), Period(), COPY_RATES_HIGH, 1, size);
low.CopyRates(Symbol(), Period(), COPY_RATES_LOW, 1, size);
close.CopyRates(Symbol(), Period(), COPY_RATES_CLOSE, 1, size);
首先,我们计算应用于开盘价的20周期的SMA。
vector sma_open = CTrendIndicators::SMA(open, 20);
我们可以轻松地针对不同周期和不同价格收集各种SMA指标。
vector sma_open = CTrendIndicators::SMA(open, 20);
vector sma_high = CTrendIndicators::SMA(high, 50);
vector sma_low = CTrendIndicators::SMA(low, 100);
vector sma_close = CTrendIndicators::SMA(close, 20);
让我们将这些指标数据整合到一个矩阵中,以便统一观察分析。
matrix Indicators(size, 4);

Indicators.Col(CTrendIndicators::SMA(open, 20), 0);
Indicators.Col(CTrendIndicators::SMA(high, 50), 1);
Indicators.Col(CTrendIndicators::SMA(low, 100), 2);
Indicators.Col(CTrendIndicators::SMA(close, 20), 3);

Print("Indicators matrix\n",Indicators);
输出:
NK      0       18:30:25.100    Custom Indicators test script (EURUSD,H1)        [1.0485715,1.0484514,nan,1.048488]
LL      0       18:30:25.100    Custom Indicators test script (EURUSD,H1)        [1.0484425,1.0485544,nan,1.0484265]
RP      0       18:30:25.100    Custom Indicators test script (EURUSD,H1)        [1.048381,1.0486754,nan,1.048299]
QG      0       18:30:25.100    Custom Indicators test script (EURUSD,H1)        [1.0483055,1.0488004,nan,1.048152]
KK      0       18:30:25.100    Custom Indicators test script (EURUSD,H1)        [1.0481585,1.0489198,nan,1.048296]
HL      0       18:30:25.100    Custom Indicators test script (EURUSD,H1)        [1.048303,1.049033,nan,1.0485255]
DS      0       18:30:25.100    Custom Indicators test script (EURUSD,H1)        [1.048533,1.0491756,nan,1.0487015]
OK      0       18:30:25.100    Custom Indicators test script (EURUSD,H1)        [1.048658,1.0493158,1.0475226,1.0488295]
KD      0       18:30:25.100    Custom Indicators test script (EURUSD,H1)        [1.0487895,1.0494628,1.047473,1.0488985]
JR      0       18:30:25.100    Custom Indicators test script (EURUSD,H1)        [1.0488575,1.0494916,1.0474256,1.0489465]
FR      0       18:30:25.100    Custom Indicators test script (EURUSD,H1)        [1.0489055,1.049475,1.0473723,1.0490045]
LL      0       18:30:25.100    Custom Indicators test script (EURUSD,H1)        [1.048964,1.0494814,1.0473137,1.049052]
HK      0       18:30:25.100    Custom Indicators test script (EURUSD,H1)        [1.0490075,1.0494728,1.0472494,1.0491065]
CF      0       18:30:25.100    Custom Indicators test script (EURUSD,H1)        [1.049062,1.0494618,1.0471845,1.049044]
RE      0       18:30:25.100    Custom Indicators test script (EURUSD,H1)        [1.0489995,1.0494452,1.047114,1.048892]
FQ      0       18:30:25.100    Custom Indicators test script (EURUSD,H1)        [1.048848,1.0494558,1.047044,1.0487065]
CL      0       18:30:25.100    Custom Indicators test script (EURUSD,H1)        [1.0486625,1.0495002,1.0469762,1.0486305]
DK      0       18:30:25.100    Custom Indicators test script (EURUSD,H1)        [1.048586,1.0496014,1.0469234,1.048582]
EE      0       18:30:25.100    Custom Indicators test script (EURUSD,H1)        [1.0485375,1.0496714,1.0468866,1.048646]
RE      0       18:30:25.100    Custom Indicators test script (EURUSD,H1)        [1.0486015,1.0497982,1.046857200000001,1.04877]
IP      0       18:30:25.100    Custom Indicators test script (EURUSD,H1)        [1.0487245,1.0498646,1.0468378,1.0490025]
DO      0       18:30:25.100    Custom Indicators test script (EURUSD,H1)        [1.0489565,1.0499466,1.046833500000001,1.0492415]
GN      0       18:30:25.100    Custom Indicators test script (EURUSD,H1)        [1.0491975,1.050113,1.046846700000001,1.0497525]
CK      0       18:30:25.100    Custom Indicators test script (EURUSD,H1)        [1.0497085,1.0502838,1.046881000000001,1.0502025]
IJ      0       18:30:25.100    Custom Indicators test script (EURUSD,H1)        [1.050159,1.0503826,1.046898100000001,1.0506915]
PF      0       18:30:25.100    Custom Indicators test script (EURUSD,H1)        [1.0506475,1.0504916,1.046935200000001,1.051158…]
假设我想基于现有变量创建一个动量指标,来衡量这些变量的动量情况。
Indicators.Col(COscillatorIndicators::MomentumIndicator(open, 20), 4);
Indicators.Col(COscillatorIndicators::MomentumIndicator(high, 50), 5);
Indicators.Col(COscillatorIndicators::MomentumIndicator(low, 100), 6);
Indicators.Col(COscillatorIndicators::MomentumIndicator(close, 20), 7);
输出:
IN      0       18:39:34.172    Custom Indicators test script (EURUSD,H1)        [1.0441885,nan,nan,1.0438975,99.43679181343492,nan,nan,99.44502817843157]
LN      0       18:39:34.172    Custom Indicators test script (EURUSD,H1)        [1.0438975,1.0495116,nan,1.043593,99.44407828753189,nan,nan,99.41864350150351]
QS      0       18:39:34.172    Custom Indicators test script (EURUSD,H1)        [1.0435925,1.0492638,nan,1.0433225,99.4176888931316,98.82473464044848,nan,99.4833645288208]
HG      0       18:39:34.172    Custom Indicators test script (EURUSD,H1)        [1.0436275,1.049148199999999,nan,1.043363,100.0668474731655,99.45161810609009,nan,100.0773424743863]
EH      0       18:39:34.172    Custom Indicators test script (EURUSD,H1)        [1.0436685,1.0490618,nan,1.043385,100.0782973197491,99.59030385797199,nan,100.0420047732697]
KO      0       18:39:34.172    Custom Indicators test script (EURUSD,H1)        [1.0436925,1.0489454,nan,1.0434175,100.0458251389074,99.4479854313681,nan,100.0620536907626]
JQ      0       18:39:34.172    Custom Indicators test script (EURUSD,H1)        [1.0437225,1.048834,nan,1.043484,100.0572803299347,99.47183265534476,nan,100.1270939444036]
JE      0       18:39:34.172    Custom Indicators test script (EURUSD,H1)        [1.043788,1.048718,nan,1.0435725,100.1251839535195,99.45010144680205,nan,100.1690625149243]
LE      0       18:39:34.172    Custom Indicators test script (EURUSD,H1)        [1.043877,1.048595199999999,nan,1.0435315,100.1700192943244,99.41799844546816,nan,99.92180198737388]
MI      0       18:39:34.172    Custom Indicators test script (EURUSD,H1)        [1.0438365,1.048457,nan,1.0437085,99.92275488503829,99.34503611305946,nan,100.3389538390831]
HN      0       18:39:34.172    Custom Indicators test script (EURUSD,H1)        [1.044013,1.0483164,nan,1.044095,100.3379931060896,99.33386396801032,nan,100.7431263218612]
KS      0       18:39:34.172    Custom Indicators test script (EURUSD,H1)        [1.0443985,1.048186,nan,1.044364,100.7411964891704,99.38227742565063,nan,100.5158345877638]
EE      0       18:39:34.172    Custom Indicators test script (EURUSD,H1)        [1.0446665,1.0480502,nan,1.044532,100.5139219145509,99.35649569733499,nan,100.3225558712848…]
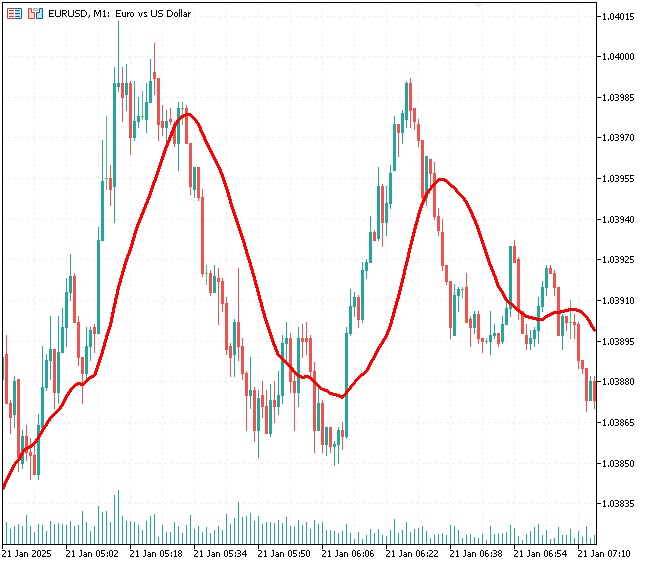
绘制自定义函数生成的指标图表
让我们尝试将通过该库计算得到的指标结果以可视化的形式呈现。
尽管该方法主要面向数据收集而非可视化展示,但我们仍可以在自定义的MetaTrader 5指标中实现这些计算结果的可视化。
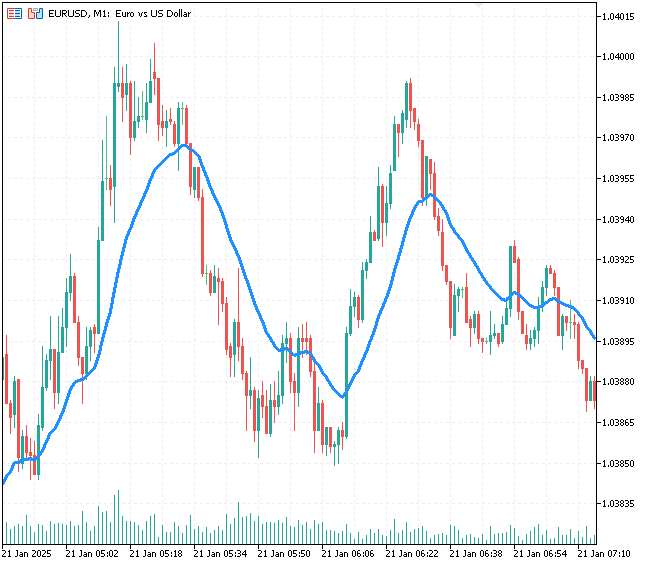
20周期SMA指标的可视化效果。
#property indicator_chart_window
#property indicator_buffers 1
#property indicator_plots 1

#property indicator_color1 clrDodgerBlue
#property indicator_type1 DRAW_LINE
#property indicator_style1 STYLE_SOLID

#include <ta-lib.mqh>

input int period_ = 20; //SMA period

double buffer[];
//+------------------------------------------------------------------+
//| Custom indicator initialization function                         |
//+------------------------------------------------------------------+
int OnInit()
  {
//--- indicator buffers mapping

   SetIndexBuffer(0, buffer, INDICATOR_DATA);
   PlotIndexSetDouble(0, PLOT_EMPTY_VALUE, 0);

   PlotIndexSetString(0,PLOT_LABEL,"SMA("+string(period_)+")");
   PlotIndexSetInteger(0,PLOT_DRAW_BEGIN,period_+1);

//---
   return(INIT_SUCCEEDED);
  }
//+------------------------------------------------------------------+
//| Custom indicator iteration function                              |
//+------------------------------------------------------------------+
int OnCalculate(const int rates_total,
                const int prev_calculated,
                const datetime &time[],
                const double &open[],
                const double &high[],
                const double &low[],
                const double &close[],
                const long &tick_volume[],
                const long &volume[],
                const int &spread[])
  {
//---

   if (prev_calculated==0) //Initial indicator calculation, For Plotting the entire past
     {
       vector buffer_vector = CTrendIndicators::SMA(close, period_);

       VectorToArray(buffer_vector, buffer); //We assign the calculations into an array format
     }
    else //For plotting the current value
     {
       for (int i=prev_calculated-1; i<rates_total; i++) //Loop from the prev_calculated bars -1 to the total bars present
        {
           double temp_close[]; //For storing temporary close values
           int size = period_*2; //We are going to copy an equivalent of period x 2 to leave a room for NaN values

           if (ArrayCopy(temp_close, close, 0, i - size, size) < 0)
            {
               printf("Failed to copy closing price values to a temporary array, err = %d",GetLastError());
               continue;
            }

           vector indicator_values = CTrendIndicators::SMA(temp_close, period_);
           ulong last_index = indicator_values.Size() - 1; //The last value in the vector is the recent calculated indicator value

           buffer[i] = indicator_values[last_index]; //Assing the last indicator value to the last value in the buffer
        }
     }

//--- return value of prev_calculated for next call
   return(rates_total);
  }
//+------------------------------------------------------------------+
//|      A crude way to convert a vector into Array                  |
//+------------------------------------------------------------------+
template <typename T>
void VectorToArray(const vector<T> &v, T &arr[])
 {
   ArrayResize(arr, (uint)v.Size());

   for (uint i=0; i<(uint)v.Size(); i++)
       arr[i] = v[i];
 }
输出:

总结
相较于其他特定任务,这种自定义收集指标值的方法在数据收集方面更为便捷实用,尤其适合从事数据分析的专业人士,以及那些寻求创新方式收集指标数据以供分析的爱好者。
我常常需要一种快速的方法来获取多个指标值,而无需每次都初始化指标并执行那些繁琐的操作——这些操作往往还会引发MetaTrader 5报错。随着MQL5因新增支持复杂人工智能(AI)和机器学习(ML)模型功能而带来的数据需求激增,我们需要探索更多高效的方法来提取和可视化指标数据,以满足分析和机器学习模型训练的需求。
告一段落。
附件表
| 文件名 | 说明/用法 |
|---|---|
| Include\ta-lib.mqh | 本文所讨论的包含全部指标代码的MQL5库。 |
| Indicators\Trend Indicators Redefined.mq5 | 一个为演示目的而实现的包含SMA指标的示例。 |
| Scripts\Custom Indicators test script.mq5 | 一个专为测试和调试指标代码而编写的简易脚本。 |
来源与参考文献
- RSI指标详解及公式解析
- MA:目的、用途、公式及示例
- 如何使用布林带判断趋势
- 抛物线转向指标:定义、公式及交易策略
- 标准差公式、用途及其与方差的对比
- 什么是MACD?
- 随机振荡指标:定义、如何运作及如何计算
- ATR公式:含义、如何使用
本文由MetaQuotes Ltd译自英文
原文地址: https://www.mql5.com/en/articles/16931
注意: MetaQuotes Ltd.将保留所有关于这些材料的权利。全部或部分复制或者转载这些材料将被禁止。
本文由网站的一位用户撰写,反映了他们的个人观点。MetaQuotes Ltd 不对所提供信息的准确性负责,也不对因使用所述解决方案、策略或建议而产生的任何后果负责。

