Multi Chart Crosshairs

5

This indicator is designed to make reviews of many charts on different timescales quicker, and easier to do.

  • Track Time and Price across multiple charts
  • Change Symbol on one chart and all other charts of the same symbol will be changed too.
  • Easy to use, quick to master

The indicator allows you to identify the price and time where the mouse pointer is on the current chart, across all other charts open on the same Symbol. This allows you to quickly see information on multiple charts whereas normally you have to spend some time identifying the same location.

You can also choose to track just Time across all open charts. This allows you to easily navigate when divergence hunting.

Should you change the Symbol in one chart, all the other charts of the same symbol will switch to the new Symbol, keeping their timeframe settings.

How to Use

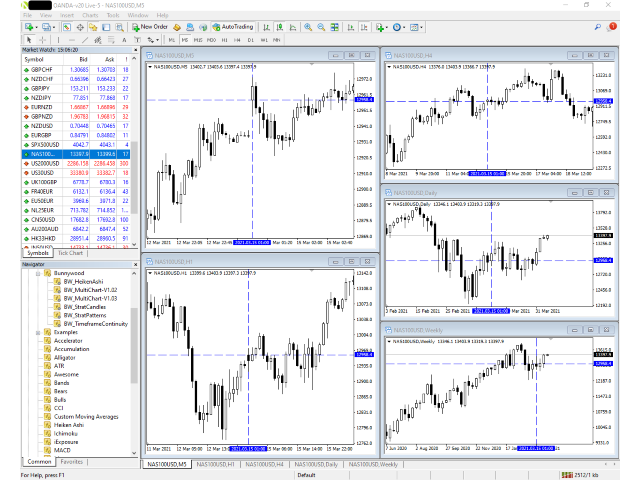
When reviewing a chart, I like to look at several timeframes to identify trends and trading levels. I created this tool to help with that, and also for visual back testing, where I'm looking across several charts over an extended period.

The tool adds a crosshair to the screen which follows the mouse pointer. It is activated when either the CTRL or SHIFT key is down, so it's not always there, but is when you want it.

Once activated, you can point on any chart where you want to track, and on any other chart with the same Symbol, the crosshair will show the same time and price on that chart too. Charts in other windows will automatically scroll the display so that the time/price combination is central to the display.

You can add drawing elements to the chart with out affecting the crosshairs which remain visible until you press the ESC key. Once pressed, the ESC key causes the crosshairs to be hidden again until you need them again.

Demonstration

Please review the video that shows the indicator in use.


Hope you find it as useful as I do.

Thank you for your interest!


İncelemeler 2
Sandy Wahyudi
580
Sandy Wahyudi 2023.07.29 12:33 
 

Very good indicator. Easy and very usefull for chart analytic. Thank you

Önerilen ürünler
RiverScope Lite automatically determines the nearest most important price levels and support and resistance zones in history, it also identifies a large number of price action patterns (the lite version is limited to 10, while the full version has 30+). The support and resistance levels are determined based on an algorithm that calculates and filters the historical values of the price, its movement character, volumes, etc. It displays the current situation, therefore the nearest levels change in
Step into the world of Forex trading with confidence, clarity, and precision using   Gold Indicator   a next-generation tool engineered to take your trading performance to the next level. Whether you’re a seasoned professional or just beginning your journey in the currency markets, Gold Indicator equips you with powerful insights and help you trade smarter, not harder. Built on the proven synergy of three advanced indicators, Gold Indicator focuses exclusively on medium and long-term trends eli
Quantum Currency Strength Indicator
QUANTUM TRADING SOFTWARE LIMITED
Your success as a forex trader depends on being able to identify when a currency or currency pair is oversold or overbought. If it is strong or weak. It is this concept which lies at the heart of forex trading. Without the Quantum Currency Strength indicator, it is almost impossible. There are simply too many currencies and too many pairs to do this quickly and easily yourself. You need help! The Quantum Currency Strength indicator has been designed with one simple objective in mind. To give you
Advanced Trend Regime
Shellard Securities (Pty) Ltd
The indicator has been designed to function on any time-frame and any pair.   This regime filter will help the trader better evaluate whether the current market is trending, and in which direction. It quickly reacts to changes in market dynamics using a series of advanced calculations. The user is able to select whether the calculation remains standard, or if a further filter constraint is added to the calculation.   A Yellow moving average of the signal has been included for the trader to smoot
Pirate
Anatoliy Lukanin
3.9 (20)
Deposit :   from 100 deposit units Trading pairs: I recommend currency pairs: EURAUD, CHFJPY, EURCHF, EURGBP, AUDCHF, CADCHF, USDCHF. Trading period :  Any Account: You should use ECN-ECN.Pro accounts with five-digit quotes with a moderate size (spread). Parameters: USING - Choice, trading risk or fixed lot RISK/LOT - Lot Risk Value RESTORING_THE_BALANCE - Restoring balance* HOW_THE_RESET_WINDOW - Reset the Global Variable TAKE_PROFIT - Set profit STOP_LOSS - Set loss COUNT_BUY - The number of s
Indicator Description GOLD TITAN KING SIGNAL INDICATOR High-Precision Gold Scalping Buy/Sell Signals – Manual Trading Assistant Overview The Gold Titan King Signal Indicator is a manual trading assistant tool designed for high-frequency scalping on Gold (XAUUSD) and other major pairs. It generates clear BUY/SELL signals with precise entry levels, along with adjustable Stop Loss and Take Profit levels displayed directly on the chart. ️ This tool is NOT an EA. It does not execute trades
PipFinite Trend PRO
Karlo Wilson Vendiola
4.88 (2250)
Breakthrough Solution For Trend Trading And Filtering With All Important Features Built Inside One Tool! Trend PRO's smart algorithm detects the trend, filters out market noise and gives entry signals with exit levels. The new features with enhanced rules for statistical calculation improved the overall performance of this indicator. Important Information Revealed Maximize the potential of Trend Pro, please visit www.mql5.com/en/blogs/post/713938 The Powerful Expert Advisor Version Automatin
Chart Patterns Detect 15 patterns (Ascending Triangle, Descending Triangle, Rising Wedge, Falling Wedge, Bullish Flag, Bearish Flag, Bullish Rectangle, Bearish Rectangle Symmetrical triangle, Head and Shoulders, Inverted Head and Shoulders, Triple top, Triple Bottom, Double Top, Double Bottom) Use historical data to calculate the probability of each pattern to succeed (possibility to filter notification according to the chance of success) gives graphic indication about the invalidation level and
This is  a dashboard indicator that displays the auto-calculated risk lot, with the given risk percentage & risk points (Stop Loss) and others. The main function of this indicator is to help you calculate your exact scalping risk lots and swing risk lots. Also it displays the active trades of each pair you've executed with the following: type of trade, lot size, symbol, & equity(+/-). Also displays the bar counter set in every 5-minute bar timer. (whichever time frame you're active, the bar time
P Y R A M I D   E X P E R T    This Forex utility is a complex exit strategy and order management tool that executes four trading methods; scalping, pyramid style, hedging, and scaling method to close trades with a profit.           V E R Y  I M P O R T A N T     This is not a stand alone expert advisor. Use it with your own volatility-based strategy. Once you found the currency pair to trade, you can just attach this tool to the chart of the chosen pair and it will do the
Quantum Currency Array Indicator
QUANTUM TRADING SOFTWARE LIMITED
This indicator has been developed to identify and display these trends quickly and easily, allowing you to see instantly, those currency pairs which are trending, and those which are not – and in all timeframes, with just one click. The 28 currency pairs are displayed as a fan as they sweep from strong to weak and back again, and this is why we call it the ‘currency array’. All 28 pairs are arrayed before you, giving an instant visual description of those pairs that are trending strongly, those
Reversal Monster Mini
Abdulfattah Yahya Mohammed Alhazmi
The Most advanced and comprehensive EA to trade Trend Reversals/Pullbacks It is a very profitable EA, to trade trends breakout, and manage trades, takeprofit, stoploss, move to breakeven, and trailing stop. The   “Reversal Monster EA”   trades Reversal/Pullbacks when the current price of the pair pullback to a predefined horizontal level or trendline on the currency chart. The opening of the position can be immediate after pullback to the drawn trendline or after closing the candle below/above
FREE
The Perspective Trend indicator tracks the market trend with very high reliability. All intersection points will be ideal points at which the direction of the trend changes. Sharp price fluctuations, as well as noise around averaged prices, are ignored. Signal points, places where color changes, can be used as points of potential market reversal. The indiuctor algorithm implements a kind of technical analysis based on the idea that the market is cyclical in nature. This development can be used b
This multi time frame and multi symbol indicator alerts about Heiken Ashi Smoothed color changes. As a bonus it can also scan for Hull Moving Average trend (color) changes. Combined with your own rules and techniques, this indicator will allow you to create (or enhance) your own powerful trading system. Features Can monitor all symbols visible in your Market Watch window at the same time. Apply the indicator to just one chart and instantly monitor the entire market. Can monitor every time frame,
VPPD - Volume Profile POC Delta *Professional Volume Analysis Tool for MetaTrader 4* ---   INDICATOR FEATURES   Unique Capabilities: **Advanced Volume Profile** - Horizontal volume histograms across selected periods - Precise Point of Control (POC) identification — the level of maximum volume **Delta Analysis (Exclusive Feature!)** - Volume delta calculation — buy/sell ratio - Tick movement simulation inside bars - POC color coding:   - Green — Bullish delta (buyers dominate)   -
Heiken Ashi candle chart is an improved version of The Japanese candle chart, which can effectively filter the market "noise" of the Japanese candle chart. It is favored by many traders for its simplicity and intuition. For trend traders, the HA candle chart is a magic tool. Unlike the traditional Japanese candle chart, Heikenashi does not reflect the opening price, high price, low price and closing price of the market. Instead, Heikenashi calculates the value of a single K line in the dominant
Owl smart levels
Sergey Ermolov
4.26 (38)
MT5 versiyonu  |  FAQ Owl Smart Levels Indicator ,   Bill Williams'ın gelişmiş fraktalları , piyasanın doğru dalga yapısını oluşturan Valable ZigZag ve kesin giriş seviyelerini gösteren   Fibonacci seviyeleri   gibi popüler piyasa analiz araçlarını içeren tek gösterge içinde eksiksiz bir ticaret sistemidir. pazara ve kar elde edilecek yerlere. Stratejinin ayrıntılı açıklaması Gösterge ile çalışma talimatı Baykuş Yardımcısı ticaretinde Danışman Yardımcısı Kullanıcıların özel sohbeti -> Satın ald
Noize Absorption Index MT4
Ekaterina Saltykova
5 (1)
Noize Absorption Index - is the manual trading system that measures the difference of pressure between bears forces and bulls forces. Green line - is a noize free index that showing curent situation. Zero value of index shows totally choppy/flat market.Values above zero level shows how powerfull bullish wave is and values below zero measures bearish forces.Up arrow appears on bearish market when it's ready to reverse, dn arrow appears on weak bullish market, as a result of reverse expectation. S
Robot scalper for M5 timeframe. Trades on the GBPUSD currency pair. This robot has been specially developed by a company of professional traders for trading in the pound sterling. The robot approximately opens 5 to 15 trades every day. It is best to trade with brokers that have a low spread on GBPUSD up to 10 pips. The recommended minimum deposit to start is $500 or more. Advantages: does not use martingale. not a net. every trade has a stop loss. professional bot specifically for the GBPUSD p
Gösterge, dünya borsalarının çalışma saatlerini gösterir. Hangi pazarların şu anda en aktif olduğunu görmenize yardımcı olur Benim  #1 Pro  Utility : 66+ özellik, bu araç dahil  |   Bana ulaşın  sorularınız varsa Şu anda en volatil enstrümanları seçmenize yardımcı olur; Özellikle gün içi traderlar için faydalıdır; 1) 1H ve altı zaman dilimlerinde kullanıldığında: çizgiler, grafikteki çubukların gerçek konumuna karşılık gelecek ve grafik hareket ettirildiğinde işlem seanslarının çizgileri grafik
Price Magnet — Price Density and Attraction Levels Indicator Price Magnet is a professional analytical tool designed to identify key support and resistance levels based on statistical Price Density. The indicator analyzes a specified historical period and detects price levels where the market spent the most time. These zones act as “magnets,” attracting price action or forming a structural base for potential reversals. Unlike traditional Volume Profile tools, Price Magnet focuses on price-time d
TMA AI Bands
Monique Ellen Miranda Dos Santos
TMA AI Bands göstergesi, dinamik üst ve alt bantlar ile grafiğe doğrudan çizilen net alım/satım okları içeren Üçgensel Hareketli Ortalama (TMA) temellidir. Adaptif optimizasyon için entegre AI özelliği sunar ve yeniden boyama yapmaz, fiyat bantlara dokunduğunda hassas tersine dönüş sinyalleri sağlar. * Pariteler: Tüm döviz pariteleriyle çalışır * Önerilen zaman dilimleri: D1 / W1 / MN * Yapılandırılabilir harici değişkenler:   * TimeFrame – hesaplama periyodu   * HalfLength – ortalamanın y
Indicator for binary options arrow is easy to use and does not require configuration works on all currency pairs, cryptocurrencies buy signal blue up arrow sell signal red down arrow tips do not trade during news and 15-30 minutes before their release, as the market is too volatile and there is a lot of noise it is worth entering trades one or two candles from the current period (recommended for 1 candle) timeframe up to m 15 recommended money management fixed lot or fixed percentage of the depo
Bu, bir mumun kapanış fiyatını tahmin eden bir göstergedir. Gösterge öncelikle D1 çizelgelerinde kullanılmak üzere tasarlanmıştır. Bu gösterge hem geleneksel forex ticareti hem de ikili opsiyon ticareti için uygundur. Gösterge, bağımsız bir ticaret sistemi olarak kullanılabilir veya mevcut ticaret sisteminize ek olarak hareket edebilir. Bu gösterge, mevcut mumu analiz ederek mumun gövdesi içindeki belirli güç faktörlerini ve önceki mumun parametrelerini hesaplar. Böylece gösterge, piyasa hareket
Unlimited Binary Options Copier Remote is a powerful tool to copy binary options trades remotely between multiple accounts at different locations over internet. This is an ideal solution for signal provider, who want to share his binary options trades with the others globally on his own rules. One provider can copy trades to unlimited receivers and one receiver can get trade from unlimited providers as well. The provider can set the subscription expiry for each receiver, so that receiver will no
ASSO (Accelerated Structural Strength Oscillator) is the ultimate structural strength meter. Based on a fusion of Hull Moving Averages (HMA) and ATR normalization, this indicator shows which currencies are accelerating, exhausting, or reversing with mathematical precision. ASSO is a true Multi-Timeframe engine. It weighs 3 simultaneous timeframes to calculate the "true" structural direction of the market, filtering out noise from lower timeframes. The real power shows when you combine the Globa
Magic Balance
Daniil Evstratenko
The indicator shows which trading pairs, strategies, robots and signals that you use are profitable and which are not. The statistic of trades and balance graph are displayed in the account currency and pips - to switch simply click on the graph. button "$"(top left) - minimize/expand and move the indicator panel button ">"(bottom right) - stretching and resetting to the original size Statistic of trades 1 line - account balance, current profit and lot of open trades; 2 line - the number of all
Ticks Size
Viktor Kolmakov
This indicator displays in a separate window the difference between the number of points which increased the price, and the number of points that decreased the price during the time interval specified in the settings. The time interval for calculation is expressed as the number of bars of the chart the indicator is attached to. This approach allows you to evaluate the movement direction (growth or fall) of the instrument's price, the strength of the movement and the size of the movement in point
Forex Gump
Andrey Kozak
2.4 (5)
Forex Gump is a fully finished semi-automatic trading system. In the form of arrows, signals are displayed on the screen for opening and closing deals. All you need is to follow the instructions of the indicator. When the indicator shows a blue arrow, you need to open a buy order. When the indicator shows a red arrow, you need to open a sell order. Close orders when the indicator draws a yellow cross. In order to get the most effective result, we recommend using the timeframes H1, H4, D1. There
The BLACK ZONE PREMIUM INDICATOR is a powerful all-in-one trading assistant built to bring clarity, precision, and consistency to forex trading. It combines multi-timeframe market structure, trade forecasting, risk management, and live monitoring into one professional-grade tool. From planning trades to managing them with discipline, this indicator equips traders with everything they need to make informed and confident decisions. If you’ve been looking for a professional solution that simplifies
Bu ürünün alıcıları ayrıca şunları da satın alıyor
Gann Made Easy
Oleg Rodin
4.83 (156)
Gann Made Easy , bay teorisini kullanarak ticaretin en iyi ilkelerine dayanan, profesyonel ve kullanımı kolay bir Forex ticaret sistemidir. WD Gann. Gösterge, Zararı Durdur ve Kâr Al Seviyeleri dahil olmak üzere doğru SATIN AL ve SAT sinyalleri sağlar. PUSH bildirimlerini kullanarak hareket halindeyken bile işlem yapabilirsiniz. LÜTFEN ÜCRETSİZ OLARAK TİCARET İPUÇLARI, BONUSLAR VE GANN MADE EA ASİSTANI ALMAK İÇİN SATIN ALIMDAN SONRA BENİMLE İLETİŞİME GEÇİN! Muhtemelen Gann ticaret yöntemlerini b
Scalper Inside PRO
Alexey Minkov
4.74 (69)
An exclusive indicator that utilizes an innovative algorithm to swiftly and accurately determine the market trend. The indicator automatically calculates opening, closing, and profit levels, providing detailed trading statistics. With these features, you can choose the most appropriate trading instrument for the current market conditions. Additionally, you can easily integrate your own arrow indicators into Scalper Inside Pro to quickly evaluate their statistics and profitability. Scalper Inside
Game Changer Indicator
Vasiliy Strukov
4.6 (20)
Game Changer è un indicatore di tendenza rivoluzionario, progettato per essere utilizzato su qualsiasi strumento finanziario, per trasformare il tuo MetaTrader in un potente analizzatore di trend. Funziona su qualsiasi intervallo temporale e aiuta a identificare i trend, segnala potenziali inversioni, funge da meccanismo di trailing stop e fornisce avvisi in tempo reale per risposte tempestive del mercato. Che tu sia un professionista esperto o un principiante in cerca di un vantaggio, questo st
M1 Sniper
Oleg Rodin
5 (19)
M1 SNIPER kullanımı kolay bir işlem göstergesi sistemidir. M1 zaman dilimi için tasarlanmış bir ok göstergesidir. Gösterge, M1 zaman diliminde scalping için bağımsız bir sistem olarak kullanılabilir ve mevcut işlem sisteminizin bir parçası olarak kullanılabilir. Bu işlem sistemi özellikle M1'de işlem yapmak için tasarlanmış olsa da, diğer zaman dilimleriyle de kullanılabilir. Başlangıçta bu yöntemi XAUUSD ve BTCUSD ticareti için tasarladım. Ancak bu yöntemi diğer piyasalarda işlem yaparken de ya
Volatility Trend System - girişler için sinyaller veren bir ticaret sistemi. Oynaklık sistemi, trend yönünde doğrusal ve noktasal sinyaller ve ayrıca yeniden çizme ve gecikme olmaksızın trendden çıkmak için sinyaller verir. Trend göstergesi, orta vadeli trendin yönünü izler, yönünü ve değişimini gösterir. Sinyal göstergesi volatilitedeki değişikliklere dayalıdır ve piyasa girişlerini gösterir. Gösterge, çeşitli uyarı türleri ile donatılmıştır. Çeşitli alım satım araçlarına ve zaman dilimlerine
RFI levels PRO
Roman Podpora
5 (1)
Bu gösterge, fiyat dönüş noktalarını ve fiyat geri dönüş bölgelerini doğru bir şekilde gösterir.       Başlıca oyuncular   . Yeni trendlerin nerede oluştuğunu görüyorsunuz ve her işlem üzerinde kontrolü elinizde tutarak, azami hassasiyetle kararlar alıyorsunuz. TREND LINES PRO   göstergesiyle birlikte kullanıldığında maksimum potansiyelini ortaya koyar.  VERSION MT5 Göstergenin gösterdiği şey: Yeni bir trendin başlangıcında aktivasyonla birlikte tersine dönüş yapıları ve tersine dönüş seviyeler
Dynamic Forex28 Navigator
Bernhard Schweigert
4.43 (7)
Dynamic Forex28 Navigator - Yeni Nesil Forex Ticaret Aracı. ŞU ANDA %49 İNDİRİM. Dynamic Forex28 Navigator, uzun zamandır popüler olan göstergelerimizin evrimidir ve üçünün gücünü tek bir göstergede birleştirir: Gelişmiş Döviz Gücü28 Göstergesi (695 inceleme) + Gelişmiş Döviz İMPULS ve UYARI (520 inceleme) + CS28 Kombo Sinyalleri (Bonus). Gösterge hakkında ayrıntılar https://www.mql5.com/en/blogs/post/758844 Yeni Nesil Güç Göstergesi Ne Sunuyor?  Orijinallerde sevdiğiniz her şey, şimdi yeni
Precautions for subscribing to indicator This indicator only supports the computer version of MT4 Does not support MT5, mobile phones, tablets The indicator only shows the day's entry arrow The previous history arrow will not be displayed (Live broadcast is for demonstration) The indicator is a trading aid Is not a EA automatic trading No copy trading function The indicator only indicates the entry position No exit (target profit)  The entry stop loss point is set at 30-50 PIPS Or the front hi
GOLD Impulse with Alert
Bernhard Schweigert
4.64 (11)
Bu gösterge, 2 ürünümüz Advanced Currency IMPULSE with ALERT  +   Currency Strength Exotics  'in süper bir kombinasyonudur. Tüm zaman dilimleri için çalışır ve 8 ana para birimi artı bir Sembol için grafiksel olarak güç veya zayıflık dürtüsünü gösterir! Bu Gösterge, Altın, Egzotik Çiftler, Emtialar, Endeksler veya Vadeli İşlemler gibi herhangi bir sembol için para birimi gücü ivmesini göstermek için uzmanlaşmıştır. Türünün ilk örneğidir, Altın, Gümüş, Petrol, DAX, US30, MXN, TRY, CNH vb. içi
Currency Strength Wizard , başarılı ticaret için size hepsi bir arada çözüm sağlayan çok güçlü bir göstergedir. Gösterge, birden çok zaman dilimindeki tüm para birimlerinin verilerini kullanarak şu veya bu forex çiftinin gücünü hesaplar. Bu veriler, şu veya bu para biriminin gücünü görmek için kullanabileceğiniz, kullanımı kolay para birimi endeksi ve para birimi güç hatları biçiminde temsil edilir. İhtiyacınız olan tek şey, işlem yapmak istediğiniz tabloya göstergeyi eklemektir ve gösterge size
Trend Lines PRO
Roman Podpora
5 (1)
TREND ÇİZGİLERİ PRO     Piyasanın gerçek yön değişimini anlamaya yardımcı olur. Gösterge, gerçek trend dönüşlerini ve büyük oyuncuların piyasaya yeniden girdiği noktaları gösterir. Anlıyorsun     BOS hatları  Daha yüksek zaman dilimlerindeki trend değişiklikleri ve önemli seviyeler, karmaşık ayarlar veya gereksiz gürültü olmadan gösterilir. Sinyaller yeniden çizilmez ve çubuk kapandıktan sonra grafikte kalır. VERSION MT 5     -    RFI LEVELS PRO  göstergesiyle birlikte kullanıldığında maksimum p
Trend Screener
STE S.S.COMPANY
4.79 (95)
Trend Göstergesi, Trend Alım Satım ve Filtreleme için Çığır Açan Benzersiz Çözüm, Tüm Önemli Trend Özellikleriyle Tek Bir Araç İçinde Yerleştirildi! Forex, emtialar, kripto para birimleri, endeksler ve hisse senetleri gibi tüm sembollerde/araçlarda kullanılabilen %100 yeniden boyamayan çoklu zaman çerçevesi ve Çoklu para birimi göstergesidir. SINIRLI SÜRELİ TEKLİF: Destek ve Direnç Tarama Göstergesi sadece 50$ ve ömür boyu mevcuttur. (Orijinal fiyat 250$) (teklif uzatıldı) Trend Screener, grafik
Currency Strength Exotics
Bernhard Schweigert
4.88 (33)
ŞU ANDA %20 INDIRIMLI! Herhangi bir Acemi veya Uzman Tüccar için En İyi Çözüm! Bu Gösterge, Egzotik Çiftler Emtialar, Endeksler veya Vadeli İşlemler gibi herhangi bir sembol için para birimi gücünü göstermek için uzmanlaşmıştır. Türünün ilk örneğidir, Altın, Gümüş, Petrol, DAX, US30, MXN, TRY, CNH vb. gerçek para birimi gücünü göstermek için 9. satıra herhangi bir sembol eklenebilir. Bu benzersiz, yüksek kaliteli ve uygun fiyatlı bir ticaret aracıdır çünkü bir dizi tescilli özelliği ve yeni b
Bu indikatörü satın alırsanız, Profesyonel Trade Manager’ımı  + EA   ÜCRETSİZ olarak alacaksınız. Öncelikle, bu Ticaret Sistemi'nin Non-Repainting, Non-Redrawing ve Non-Lagging Göstergesi olduğunu vurgulamak önemlidir, bu da hem manuel hem de robot ticareti için ideal hale getirir. Online kurs, kılavuz ve ön ayarları indir. "Smart Trend Trading System MT5", yeni ve deneyimli tüccarlar için özelleştirilmiş kapsamlı bir ticaret çözümüdür. 10'dan fazla premium göstergeyi birleştiriyor ve 7'den faz
FX Power MT4 NG
Daniel Stein
4.95 (21)
FX Power: Daha Akıllı Ticaret Kararları için Para Birimlerinin Gücünü Analiz Edin Genel Bakış FX Power , her piyasa koşulunda başlıca para birimlerinin ve altının gerçek gücünü anlamak için vazgeçilmez bir araçtır. Güçlü para birimlerini alıp zayıf olanları satarak, FX Power ticaret kararlarınızı basitleştirir ve yüksek olasılıklı fırsatları ortaya çıkarır. İster trendlere sadık kalın ister Delta'nın aşırı değerlerini kullanarak tersine dönüşleri öngörün, bu araç ticaret tarzınıza mükemmel bir
Advanced Supply Demand
Bernhard Schweigert
4.91 (299)
Özel Ticaret –%40 İndirim Yeni Başlayanlar veya Uzman Yatırımcılar İçin En İyi Çözüm! Bu gösterge, bir dizi özel özellik ve yeni bir formül içerdiği için benzersiz, yüksek kaliteli ve uygun fiyatlı bir işlem aracıdır. Bu güncelleme ile çift zaman dilimi bölgeleri gösterebileceksiniz. Sadece daha yüksek bir zaman dilimini değil, hem grafik zaman dilimini hem de daha yüksek zaman dilimini gösterebileceksiniz: İÇ İÇE GEÇMİŞ BÖLGELER GÖSTERİYOR. Tüm Arz Talep yatırımcıları buna bayılacak. :) Önem
Looking for a powerful yet lightweight swing detector that accurately identifies market structure turning points? Want clear, reliable buy and sell signals that work across any timeframe and any instrument? Buy Sell Arrow MT Swing is built exactly for that — precision swing detection made simple and effective. This indicator identifies Higher Highs (HH) , Higher Lows (HL) , Lower Highs (LH) , and Lower Lows (LL) with remarkable clarity. It is designed to help traders easily visualize market stru
Şu anda %40 İNDİRİMLİ! Herhangi bir Acemi veya Uzman Tüccar için En İyi Çözüm! Bu gösterge paneli yazılımı 28 döviz çifti üzerinde çalışıyor. Ana göstergelerimizden 2'sine (Gelişmiş Para Birimi Gücü 28 ve Gelişmiş Para Birimi Dürtüsü) dayanmaktadır. Tüm Forex piyasasına harika bir genel bakış sağlar. Gelişmiş Para Birimi Gücü değerlerini, para birimi hareket hızını ve tüm (9) zaman dilimlerinde 28 Forex çifti için sinyalleri gösterir. Trendleri ve / veya scalping fırsatlarını belirlemek için
Atomic Analyst
Issam Kassas
5 (3)
Öncelikle belirtmek gerekir ki bu Ticaret Göstergesi Yeniden Çizim Yapmaz, Gecikmez ve Gecikme Göstermez, bu da hem manuel hem de robot ticareti için ideal hale getirir. Kullanıcı kılavuzu: ayarlar, girişler ve strateji. Atom Analisti, Piyasada Daha İyi Bir Avantaj Bulmak İçin Fiyatın Gücünü ve Momentumunu Kullanan PA Fiyat Hareketi Göstergesidir. Gürültüleri ve Yanlış Sinyalleri Kaldırmaya ve Ticaret Potansiyelini Artırmaya Yardımcı Olan Gelişmiş Filtrelerle Donatılmıştır. Birden fazla katman
El indicador "MR BEAST ALERTAS DE LIQUIDEZ" es una herramienta avanzada diseñada para proporcionar señales y alertas sobre la liquidez del mercado basándose en una serie de indicadores técnicos y análisis de tendencias. Ideal para traders que buscan oportunidades de trading en función de la dinámica de precios y los niveles de volatilidad, este indicador ofrece una visualización clara y detallada en la ventana del gráfico de MetaTrader. Características Principales: Canal ATR Adaptativo: Calcula
Gold Scalper Super
Aleksandr Makarov
5 (2)
Gold Scalper Super is an easy-to-use trading system. The indicator can be used as a standalone scalping system on the M1 time frame, as well as part of your existing trading system. Bonus: when purchasing an indicator, Trend Arrow Super is provided free of charge, write to us after purchase. The indicator 100% does not repaint!!! If a signal appears, it does not disappear! Unlike indicators with redrawing, which lead to the loss of a deposit, because they can show a signal and then remove it.
PRO Renko Sistemi, RENKO grafikleri ticareti için özel olarak tasarlanmış son derece hassas bir ticaret sistemidir. Bu, çeşitli ticaret araçlarına uygulanabilen evrensel bir sistemdir. Sistemi etkin piyasa sana doğru ters sinyallerine erişim hakkı denilen ses nötralize eder. Göstergenin kullanımı çok kolaydır ve sinyal üretiminden sorumlu tek bir parametreye sahiptir. Aracı, seçtiğiniz herhangi bir ticaret aracına ve renko çubuğunun boyutuna kolayca uyarlayabilirsiniz. Yazılımımla karlı bir
IQ FX Gann Levels a precision trading indicator based on W.D. Gann’s square root methods . It plots real-time, non-repainting support and resistance levels to help traders confidently spot intraday and scalping opportunities with high accuracy. William Delbert Gann (W.D. Gann) was an exceptional market analyst, whose trading technique was based on a complex blend of mathematics, geometry, astrology, and ancient mathematics which proved to be extremely accurate. Setup & Guide:  Download  MT5 Ver
PZ Harmonacci Patterns
PZ TRADING SLU
3.17 (6)
Trade smarter, not harder: Empower your trading with Harmonacci Patterns This is arguably the most complete harmonic price formation auto-recognition indicator you can find for the MetaTrader Platform. It detects 19 different patterns, takes fibonacci projections as seriously as you do, displays the Potential Reversal Zone (PRZ) and finds suitable stop-loss and take-profit levels. [ Installation Guide | Update Guide | Troubleshooting | FAQ | All Products ] It detects 19 different harmonic pric
Introduction Harmonic Patterns are best used to predict potential turning point. Traditionally, Harmonic Pattern was identified manually connecting peaks and troughs points in the chart. Manual harmonic pattern detection is painfully tedious and not suitable for everyone. You are often exposed under subjective pattern identification with manual pattern detection. To avoid these limitations, Harmonic Pattern Plus was designed to automate your harmonic pattern detection process. The functionality
Pips Stalker
Abdulkarim Karazon
5 (2)
Pips Stalker, uzun kısa ok tipi bir göstergedir; gösterge, tüm seviyelerden yatırımcıların piyasada daha iyi kararlar almasına yardımcı olur, gösterge asla yeniden boyanmaz ve ana sinyal mantığı olarak RSI'yı kullanır; bir ok verildikten sonra asla yeniden boyanmaz veya geri boya çizmez ve oklar gecikmez. PIPS STALKER ARROW'UN ÖZELLİKLERİ : İSTATISTIK PANELİ Genel kazanma oranı %'sini ve üst üste maksimum kazanç ve kaybedilen ticaret gibi faydalı istatistikleri ve diğer faydalı bilgileri göst
CRT Multi-Timeframe Market Structure & Liquidity Sweep Indicator Non-Repainting | Multi-Asset | MT5 Version Available MT5 Version:   https://www.mql5.com/en/market/product/162075 Full User Guide — explains what each feature does and why:   https://www.mql5.com/en/blogs/post/767525 Quick Start User Guide  — explains how to configure and in what order:  https://www.mql5.com/en/blogs/post/767540 Indicator Overview CRT Ghost Candle HTF Fractal is a complete institutional-grade market structure too
Meravith
Ivan Stefanov
5 (3)
Market maker aracı. Meravith şunları yapar: Tüm zaman dilimlerini analiz eder ve geçerli trendi gösterir. Alış ve satış hacimlerinin eşit olduğu likidite bölgelerini (hacim dengesi) vurgular. Farklı zaman dilimlerinden tüm likidite seviyelerini doğrudan grafiğinizde gösterir. Referansınız için metin tabanlı piyasa analizi üretir ve sunar. Mevcut trende göre hedefler, destek seviyeleri ve stop-loss noktalarını hesaplar. İşlemleriniz için risk/ödül oranını hesaplar. Hesap bakiyenize göre pozisyon
Apollo Secret Trend , herhangi bir çift ve zaman dilimindeki trendleri bulmak için kullanılabilecek profesyonel bir trend göstergesidir. Gösterge, işlem yapmayı tercih ettiğiniz çift veya zaman dilimi ne olursa olsun, piyasa trendlerini tespit etmek için kullanabileceğiniz birincil işlem göstergeniz olabilir. Göstergede özel bir parametre kullanarak sinyalleri kişisel ticaret tarzınıza uyarlayabilirsiniz. Gösterge, PUSH bildirimleri dahil her türlü uyarıyı sağlar. Göstergenin sinyalleri YENİDEN
System Trend Pro
Aleksandr Makarov
5 (2)
System Trend Pro - This is the best trend trading indicator!!! The indicator no repaint!!!  The indicator has   MTF   mode, which adds confidence to trading on the trend (   no repaint   ). How to trade? Everything is very simple, we wait for the first signal (big arrow), then wait for the second signal (small arrow) and enter the market in the direction of the arrow. (See screens 1 and 2.) Exit on the opposite signal or take 20-30 pips, close half of it, and keep the rest until the opposite
Yazarın diğer ürünleri
Bu gösterge, farklı zaman ölçeklerinde birçok grafiğin gözden geçirilmesini daha hızlı ve daha kolay hale getirmek için tasarlanmıştır. Birden fazla grafikte Zaman ve Fiyatı İzleyin Bir grafikteki Sembolü Değiştirin ve aynı sembolün diğer tüm çizelgeleri de değişecektir. Kullanımı kolay, ustalaşması hızlı Gösterge, aynı Sembolde açık olan diğer tüm grafiklerde fare işaretçisinin geçerli grafikte bulunduğu fiyatı ve zamanı belirlemenize olanak tanır. Bu, birden fazla grafikteki bilgileri hızlı bi
Rob Smith'in TheStrat'ını öğrenirken bu basit göstergeyi oluşturdum ve çok faydalı buldum, sizinle paylaşayım dedim. Yararlı bulursanız, lütfen MQL5'te yayınladığım diğer göstergelere bakın. Gösterge, grafik üzerinde daha yüksek bir zaman aralığından seçtiğiniz fiyat seviyesini gösteren tek bir çizgi çizer. Ayarları kullanarak, görüntülediği zaman çerçevesi üzerinde tam kontrole sahip olursunuz, ancak   varsayılan olarak, ölçeği bir adım yukarı taşıyarak daha yüksek zaman dilimini kendisi hesapl
FREE
Bu Komut Dosyası, trend çizgileri, Fibonachi Düzeltmeleri vb. gibi herhangi bir türdeki çizim nesnelerini bir veya daha fazla başka grafiğe kopyalamanıza olanak tanır. Varsayılan olarak komut dosyası, geçerli grafikteki, yani komut dosyasının uygulandığı grafikteki tüm nesneleri, o anda yüklü olan aynı Symbol'ün diğer herhangi bir grafiğine kopyalar. Ayarlar HedefZaman Dilimi PERIOD_CURRENT dışında herhangi bir değere ayarlandığında, nesneleri komut dosyasının uygulandığı grafikle aynı Sembol
FREE
A simple script that can delete all the drawing objects on a chart, or just the objects of a specific type. Settings: DeleteObjectsOfType By default the value will be blank which means ALL drawing objects on the chart will be deleted. If you only wish to delete specific types of drawing object, change this setting to the type of object to delete. For example, Fibonacci Retracement, Text, Label or Trend Line. Please see the demonstration video for more information.
FREE
This script allows you to toggle the "Show Trade Levels" option, but for the current chart only. Normally, you can only change the setting using the Options -> Chart menu for ALL charts, but this script allows you to do it for a SINGLE chart. I'm using it when I take screenshots, because most of the time I'm not trying to show the trades, just some functionality of one of my other tools. Iif you need that functionality, then this script is very helpful! If the script helps you, please let me k
FREE
This indicator will draw patterns based on Rob Smith's The Strat as they emerge in real time on your chart. As price evolves, TheStrat offers 18 distinct price action patterns that can help you get good entries in the market. Each pattern involves two or three candles, and this indicator will draw a bounding box around the candles and name the pattern. The indicator also shows when a potential setup is forming, known by stratters as an Actionable signal. Candles Each candle is defined by its
TheStrat Levels
Robert Gerald Wood
This indicator draws the prior Highs and Lows for multiple timeframes, and can display potential Take Profit and Stop Loss levels. In Rob Smith's # The Strat   terms,   these are potential entry points, or alternatively potential targets for open positions. I like to use them in both ways. On a lower timeframe, say 5 minutes to get a good entry on a daily or weekly level, and then as a potential target. Very small stops required giving an excellent risk/reward ratio. Please watch the DEMO video
TheStrat Candles
Robert Gerald Wood
5 (1)
Bu gösterge, her mumun üstüne veya altına bir etiket çizecektir.       Rob Smith'in       Strat       grafiğinizde zamanla geliştikçe. Fiyat geliştikçe, bir mum üç durum arasında geçiş yapabilir. Mum ilk açıldığında, önceki yüksek ve alçak mumların içine tamamen oturursa, o zaman Tip 1 olarak başlar. tip 2 ve fiyat hareketi değişken ve yönsüz ise, önceki mumun karşı tarafını kırabilir ve tip 3 olabilir. mumlar Her mum, önceki mumla olan ilişkisi ile tanımlanır. Tip 1 - İç mum   - Mum tamamen
TheStrat FTFC
Robert Gerald Wood
FTFC, Rob Smith'in   The Strat   tarafından tanımlandığı şekliyle Tam Zaman Çerçevesi Sürekliliği anlamına gelir. Bu gösterge grafikte iki çizgi çizer; Üç Aylık, Aylık, Haftalık, Günlük veya Saatlik açılış seviyelerinin en yükseği ve bu değerlerin en küçüğünün ikincisi. Bu size, ticaretin tek yönde çok güçlü olma olasılığının daha yüksek olduğu bir kanal verir. Satırlar arasında fiyat hareketi daha dalgalı olacak ve daha geniş stoplar kullanabilirsiniz. Yüksekler ve alçaklar arasındaki orta nokt
Piyasalar yuvarlak rakamları gerçekten sever ve genellikle düşen bir piyasada destek veya fiyat yükselirken direnç olarak hareket ederler. Bu gösterge, Yuvarlak değerlerde fiyat seviyeleri çizmek için tasarlanmıştır. Bunu otomatik olarak yapar, ancak bunu geçersiz kılma ve görmek istediğiniz seviyeleri belirleme seçeneğiniz de vardır. Yuvarlak bir seviye 10'luk adımlar kadar basit olabilir, yani 10, 20, 30 vb. Gösterge, her biri farklı formatta olan Major ve Minor olmak üzere iki sınıf çizgi çiz
TheStrat Monitor
Robert Gerald Wood
3.67 (3)
If you've not already learnt about The Strat trading strategy , go google it now. I promise it won't be a waste of your time, and you will likely learn some new tricks whether you use it or not. OK, so now you know what TheStrat is, you will be able to understand what this indicator can do for you. Key Features In short, the Indicator will: Show Timeframe Continuity for all supported timeframes Supports two timeset views, Day trader and Swing trader Show when Full Timeframe Continuity is in pla
The Strat   kullanarak işlem yaparken, birden çok zaman dilimine göz kulak olmak önemlidir. Bu gösterge, her zaman dilimi için mevcut mumun Günlük, Haftalık, Aylık ve Üç Aylık durumunu gösterecektir. Daire simgesi, o zaman dilimindeki mumun şu anda TheStrat terminolojisinde bir Inside veya Type 1 olduğunu gösterir. Bir Inside Day mumu, fiyat hareketini pekiştiriyor ve biz, aralığın kırılmasını arıyoruz. Yukarıyı veya aşağıyı gösteren bir Üçgen simgesi, trend olan bir mum veya TheStrat terminoloj
Active Pivot Levels
Robert Gerald Wood
5 (1)
Pivot seviyeleri, her pazarda tanınan, iyi kurulmuş bir teknik seviyedir. Bu gösterge, herhangi bir sembol için mevcut Üç Aylık, Aylık, Haftalık, Günlük ve dört saatlik pivotları grafik üzerinde çizecektir. Ayrıca her dönem için Destek ve Direnç seviyelerini gösterebilir ve 1 ile 4 arasındaki seviyelerden hangisinin görüntüleneceğini seçebilirsiniz.     Şunlardan Pivot türünü seçin: Standart Camarilla DeMark Ormancı Fibonacci Lütfen dikkat, DeMark pivotlarının orijinal spesifikasyona göre tek bi
ATR Extremes
Robert Gerald Wood
Ortalama Gerçek Aralık (ATR), belirli bir süre boyunca fiyattaki hareket miktarını ölçen yaygın olarak kullanılan bir göstergedir. Ancak verdiği değerin herhangi bir sınır içinde tanımlanmaması, zararı durdur veya kar al hesaplamaları dışında herhangi bir amaçla kullanılmasını neredeyse imkansız hale getirir. Bu gösterge, standart ATR göstergenizdir, ancak uç noktaları görebilmeniz için yüzdelik sınırlar ekledik. Yüzdelikler ile Bölünmüş Medyanlar dediğimiz bir şey arasında seçim yapabilirsin
Range Exhaustion
Robert Gerald Wood
Aralık Tükenmesi, fiyat cari dönem için beklenen aralığı karşıladığında veya aştığında gerçekleşir. Bu seviyelerde fiyat, dönemin başına göre momentumunu kaybetmeye başlar, bu nedenle yeni pozisyonlar almadığınızdan emin olmak için iyi bir nokta. Bu gösterge, Günlük, Haftalık ve Aylık dönemler için seviyeleri göstererek, grafiğinizde bunun olma olasılığının yüksek olduğu yerleri size gösterecektir. Fiyatların bu tükenme seviyelerini aştığını gördüğünüzde, bu size hareketin arkasındaki momentumun
This indicator will draw a label above or below each candle based on   Rob Smith's   The Strat   as they develop over time on your chart. As price evolves, a candle can switch between three states. When the candle first opens, if it sits completely within the previous candles high and low, then it will start as a Type 1. As time moves on, if it breaks either the high or low of the previous candle, it will be come a type 2, and should the price action be volatile and directionless, it may then
TheStrat Levels MT5
Robert Gerald Wood
5 (1)
This indicator draws the prior Highs and Lows for multiple timeframes, and can display potential Take Profit and Stop Loss levels. In Rob Smith's # The Strat  terms, these are potential entry points, or alternatively potential targets for open positions. I like to use them in both ways. On a lower timeframe, say 5 minutes to get a good entry on a daily or weekly level, and then as a potential target. Very small stops required giving an excellent risk/reward ratio. Key Features  - Levels from Hou
FTFC, Rob Smith'in   The Strat   tarafından tanımlandığı şekliyle Tam Zaman Çerçevesi Sürekliliği anlamına gelir. Bu gösterge grafikte iki çizgi çizer; Üç Aylık, Aylık, Haftalık, Günlük veya Saatlik açılış seviyelerinin en yükseği ve bu değerlerin en küçüğünün ikincisi. Bu size, ticaretin tek yönde çok güçlü olma olasılığının daha yüksek olduğu bir kanal verir. Satırlar arasında fiyat hareketi daha dalgalı olacak ve daha geniş stoplar kullanabilirsiniz. Yükselişler ve düşüşler arasındaki orta no
This indicator will draw patterns based on   Rob Smith's   The Strat   as they emerge in real time on your chart. As price evolves,   TheStrat   offers 18 distinct price action patterns that can help you get good entries in the market. Each pattern involves two or three candles, and this indicator will draw a bounding box around the candles and name the pattern. The indicator also shows when a potential setup is forming, known by stratters as an Actionable signal. Candles Each candle is defin
TheStrat Monitor MT5
Robert Gerald Wood
5 (1)
Henüz   Strat ticaret stratejisini   öğrenmediyseniz, şimdi google'a gidin. Vaktini boşa harcamayacağına söz veriyorum ve kullansan da kullanmasan da muhtemelen bazı yeni numaralar öğreneceksin. Tamam, artık TheStrat'ın ne olduğunu biliyorsunuz, bu göstergenin sizin için neler yapabileceğini anlayabileceksiniz. Ana Özellikler Kısacası, Gösterge şunları yapacaktır: Desteklenen tüm zaman dilimleri için Zaman Çerçevesi Sürekliliğini Göster İki zaman seti görünümünü destekler, Günlük tüccar ve Swin
TheStrat TFC Monitor MT5
Robert Gerald Wood
5 (1)
The Strat   kullanarak işlem yaparken, birden çok zaman dilimine göz kulak olmak önemlidir. Bu gösterge, her zaman dilimi için mevcut mumun Günlük, Haftalık, Aylık ve Üç Aylık durumunu gösterecektir. Daire simgesi, o zaman dilimindeki mumun şu anda TheStrat terminolojisinde bir Inside veya Type 1 olduğunu gösterir. Bir Inside Day mumu, fiyat hareketini pekiştiriyor ve biz, aralığın kırılmasını arıyoruz. Yukarıyı veya aşağıyı gösteren bir Üçgen simgesi, trend olan bir mum veya TheStrat terminoloj
Pivot seviyeleri, her pazarda tanınan, iyi kurulmuş bir teknik seviyedir. Bu gösterge, herhangi bir sembol için mevcut Üç Aylık, Aylık, Haftalık, Günlük ve dört saatlik pivotları grafik üzerinde çizecektir. Ayrıca her dönem için Destek ve Direnç seviyelerini gösterebilir ve 1 ile 4 arasındaki seviyelerden hangisinin görüntüleneceğini seçebilirsiniz.     Şunlardan Pivot türünü seçin: Standart Camarilla DeMark Ormancı Fibonacci Lütfen dikkat, DeMark pivotlarının orijinal spesifikasyona göre tek bi
Piyasalar yuvarlak rakamları gerçekten sever ve genellikle düşen bir piyasada destek veya fiyat yükselirken direnç olarak hareket ederler. Bu gösterge, Yuvarlak değerlerde fiyat seviyeleri çizmek için tasarlanmıştır. Bunu otomatik olarak yapar, ancak bunu geçersiz kılma ve görmek istediğiniz seviyeleri belirleme seçeneğiniz de vardır. Yuvarlak bir seviye 10'luk adımlar kadar basit olabilir, yani 10, 20, 30 vb. Gösterge, her biri farklı formatta olan Major ve Minor olmak üzere iki sınıf çizgi çiz
ATR Extremes MT5
Robert Gerald Wood
Ortalama Gerçek Aralık (ATR), belirli bir süre boyunca fiyattaki hareket miktarını ölçen yaygın olarak kullanılan bir göstergedir. Ancak verdiği değerin herhangi bir sınır içinde tanımlanmaması, zararı durdur veya kârı al hesaplamaları dışında herhangi bir amaçla kullanılmasını neredeyse imkansız hale getirmektedir. Bu gösterge sizin standart ATR göstergenizdir, ancak uç noktaları görebilmeniz için yüzdelik dilimler ekledik. Yüzdelikler ile Bölünmüş Medyanlar dediğimiz bir şey arasında seçim yap
Aralık Tükenmesi, fiyat cari dönem için beklenen aralığı karşıladığında veya aştığında gerçekleşir. Bu seviyelerde fiyat, dönemin başına göre momentumunu kaybetmeye başlar, bu nedenle yeni pozisyonlar almadığınızdan emin olmak için iyi bir nokta. Bu gösterge, Günlük, Haftalık ve Aylık dönemler için seviyeleri göstererek, grafiğinizde bunun olma olasılığının yüksek olduğu yerleri size gösterecektir. Fiyatların bu tükenme seviyelerini aştığını gördüğünüzde, bu size hareketin arkasındaki momentumun
Filtrele:
Sandy Wahyudi
580
Sandy Wahyudi 2023.07.29 12:33 
 

Very good indicator. Easy and very usefull for chart analytic. Thank you

CasiousD
868
CasiousD 2021.10.30 19:35 
 

Kullanıcı incelemeye herhangi bir yorum bırakmadı

Robert Gerald Wood
4954
Geliştiriciden yanıt Robert Gerald Wood 2021.10.30 19:37
Thank you so much for your kind review, you've made my day :)
İncelemeye yanıt