MinMax Levels
- Göstergeler
-
Ivan Butko
 Selamlar arkadaşlar!
Mql4 ve mql5 ile yazıyorum. Pazarımda çok çeşitli ürünler bulacaksınız, her gün yeni bir şey geliştiriyorum, bir şeyler araştırıyorum. Yakın gelecekte yeni göstergeler ve danışmanlar ortaya çıkacak. - Sürüm: 1.0
- Etkinleştirmeler: 20
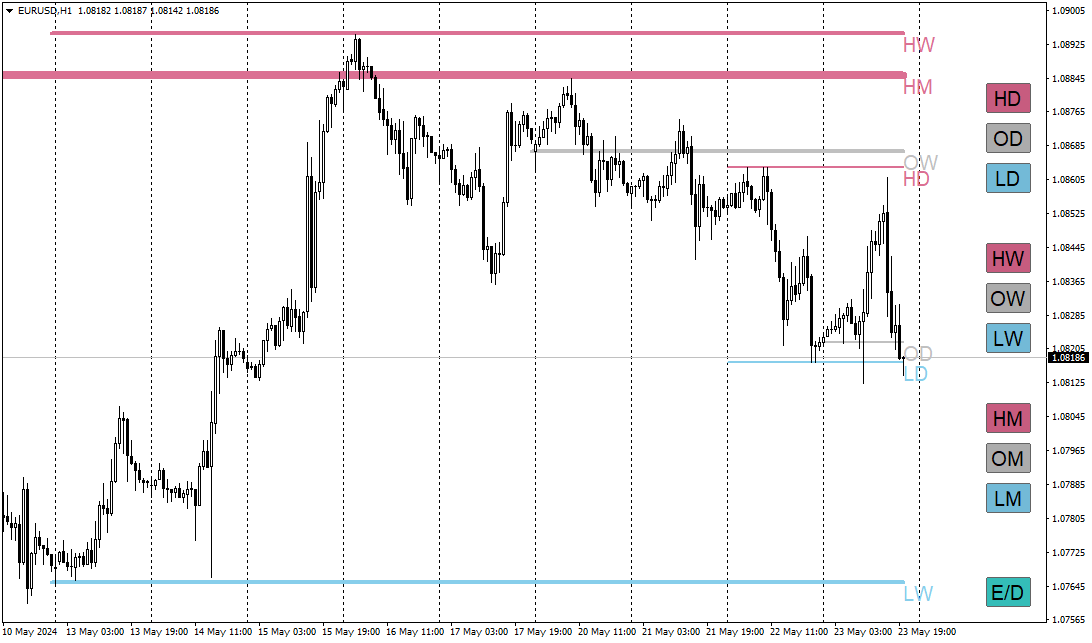
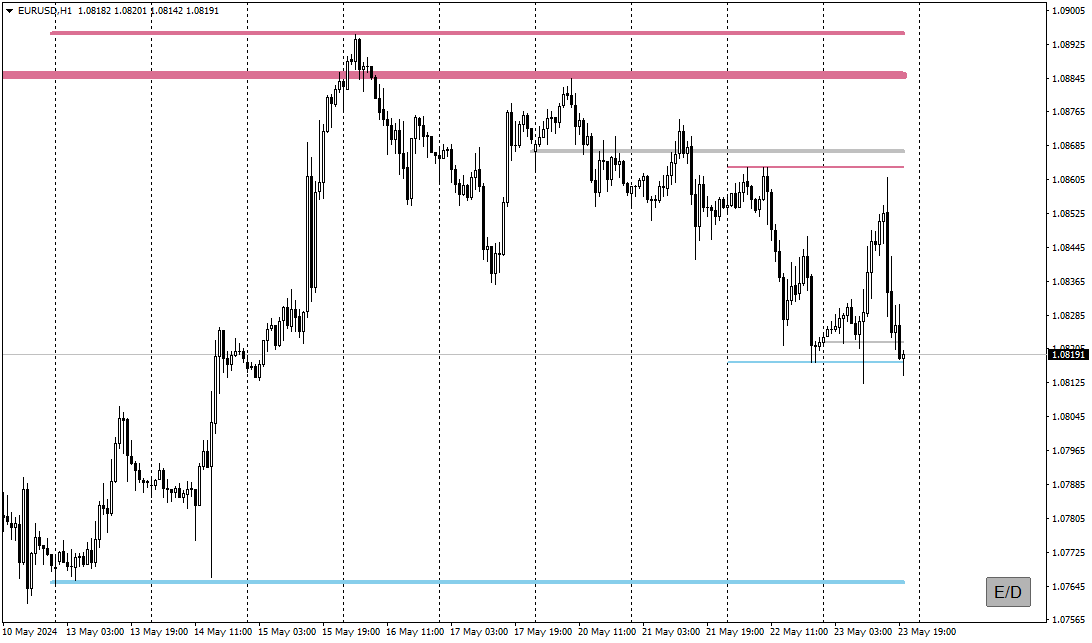
MinMax Levels – önemli işlem dönemleri (gün, hafta ve ay) için maksimum, minimum ve açılış fiyat seviyelerinin göstergesidir.
Her Forex piyasası katılımcısı kendi ticaret sistemindeki seviyeleri kullanır. İşlem yapmak için ana sinyal veya analitik bir araç görevi gören ek bir sinyal olabilirler.
Bu göstergede günler, haftalar ve aylar büyük piyasa katılımcılarının kilit işlem dönemleri olduğundan önemli dönemler olarak seçilmiştir. Bildiğiniz gibi fiyatlar seviyeden seviyeye hareket eder ve önemli seviyelere göre fiyat pozisyonunun bilinmesi, alım satım kararlarının alınmasında avantaj sağlar.
Kolaylık sağlamak için, her iki seviyeyi de etkinleştirip devre dışı bırakan ve fiyat tablosunun çalışma penceresinde yer açmak için düğmeleri daraltan düğmeler eklendi.
Her Forex piyasası katılımcısı kendi ticaret sistemindeki seviyeleri kullanır. İşlem yapmak için ana sinyal veya analitik bir araç görevi gören ek bir sinyal olabilirler.
Bu göstergede günler, haftalar ve aylar büyük piyasa katılımcılarının kilit işlem dönemleri olduğundan önemli dönemler olarak seçilmiştir. Bildiğiniz gibi fiyatlar seviyeden seviyeye hareket eder ve önemli seviyelere göre fiyat pozisyonunun bilgisi, alım satım kararlarında avantaj sağlar.
Kolaylık sağlamak için, her iki seviyeyi de etkinleştirip devre dışı bırakacak ve fiyat tablosunun çalışma penceresinde yer açmak için düğmeleri daraltacak düğmeler eklendi.
Bu göstergenin avantajları:
- Kolaylık
- Görünürlük
- Bilgi içeriği
- En son seviyeler
- Özelleştirilebilir seviyeler
Özelleştirilebilir seviyeler doğrudan grafik üzerinde devre dışı bırakılabilir ve grafiğin çalışma alanını boşaltmak için düğmelerin kendileri küçültülebilir.
Artık MinMax Seviyeleri göstergesini temel alan veya temel alan tüm ticaret stratejileri ek bir sinyale sahip olacak.
Ayrıca günlerin, haftaların ve ayların en yüksek, en düşük ve açılış fiyatları destek ve direnç seviyeleri olarak hareket edebilir. Ve bazı ticaret stratejilerinde likidite seviyelerini gösterin.
Kısaltmaların açıklaması:
HD - Günün maksimumu
OD - Günün Açılışı
LD - Günün minimumu
HW - Haftanın maksimumu
OW - Haftanın keşfi
LW - Haftanın minimumu
HM - Ayın maksimumu
OM - Ayın Keşfi
LM - Ayın minimumu
MinMax Seviyeleri göstergesini ticaret sisteminize ek olarak kullanın
MT5 için sürüm
Piyasadaki diğer ürünlerimi de deneyin https://www.mql5.com/ru/users/capitalplus/seller
Ticarette size büyük kazançlar diliyorum!