MinMax Levels
- Indicatori
-
Ivan Butko
 Saluti, amici!
Scrivo in mql4 e mql5. Nel mio mercato troverai una varietà di prodotti, ogni giorno sviluppo qualcosa di nuovo, ricerco qualcosa. Nuovi indicatori e consulenti appariranno nel prossimo futuro. - Versione: 1.0
- Attivazioni: 20
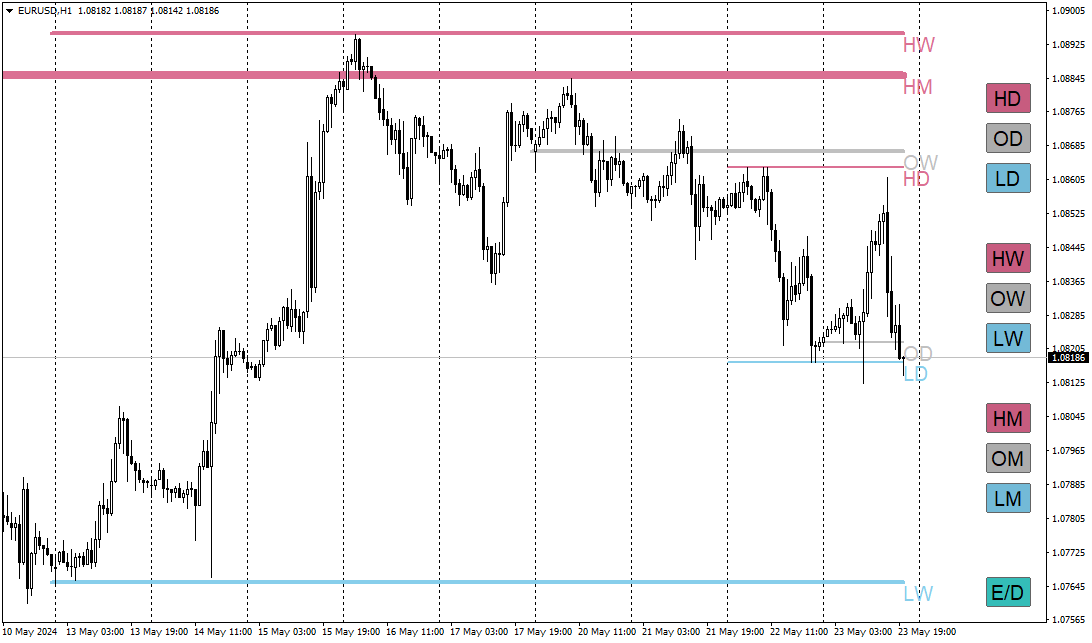
MinMax Levels – è un indicatore dei livelli di prezzo massimo, minimo e di apertura per periodi di negoziazione importanti: giorno, settimana e mese.
Ogni partecipante al mercato Forex utilizza i livelli nel proprio sistema di trading. Possono essere il segnale principale per effettuare transazioni o un segnale aggiuntivo, fungendo da strumento analitico.
In questo indicatore, giorni, settimane e mesi sono stati selezionati come periodi importanti, poiché sono i periodi chiave di scambio dei grandi partecipanti al mercato. Come sapete, i prezzi si spostano da un livello all'altro e la conoscenza della posizione dei prezzi rispetto a livelli importanti offre un vantaggio nel prendere decisioni di trading.
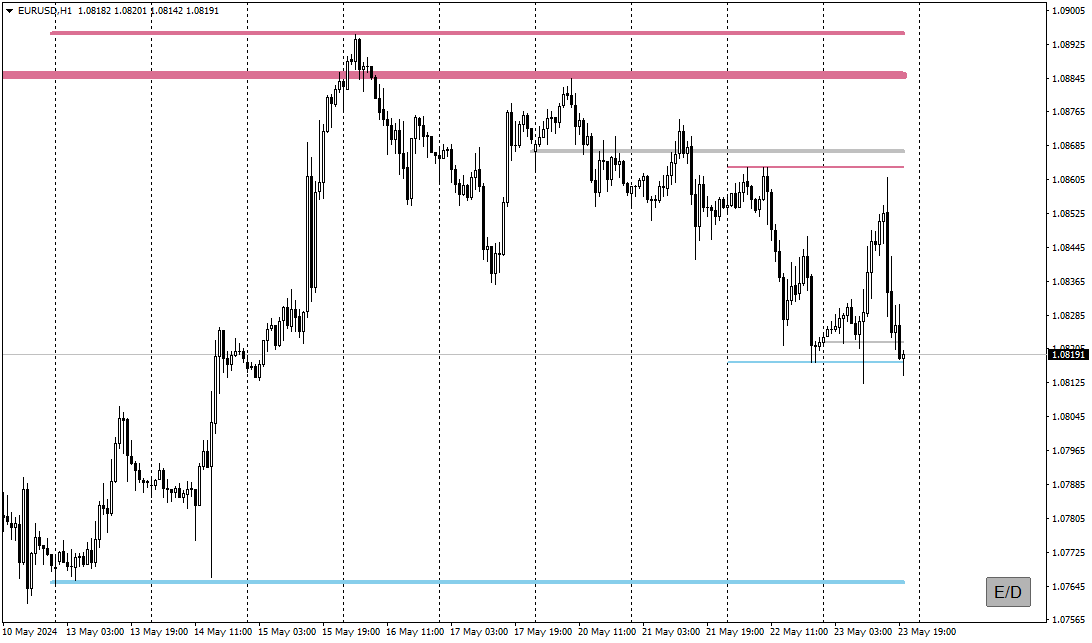
E per comodità, sono stati aggiunti pulsanti per abilitare e disabilitare entrambi i livelli stessi e per comprimere i pulsanti per liberare spazio nella finestra di lavoro del grafico dei prezzi.
Ogni partecipante al mercato Forex utilizza i livelli nel proprio sistema di trading. Possono essere il segnale principale per effettuare transazioni o un segnale aggiuntivo, fungendo da strumento analitico.
In questo indicatore, giorni, settimane e mesi sono stati selezionati come periodi importanti, poiché sono i periodi chiave di scambio dei grandi partecipanti al mercato. Come sapete, i prezzi si spostano da un livello all'altro e la conoscenza della posizione dei prezzi rispetto a livelli importanti offre un vantaggio nel prendere decisioni di trading.
E per comodità, sono stati aggiunti pulsanti per abilitare e disabilitare entrambi i livelli stessi e per comprimere i pulsanti per liberare spazio nella finestra di lavoro del grafico dei prezzi.
Vantaggi di questo indicatore:
- Convenienza
- Visibilità
- Contenuto informativo
- Ultimi livelli
- Livelli personalizzabili
I livelli personalizzabili possono essere disabilitati direttamente sul grafico e i pulsanti stessi possono essere ridotti a icona per liberare lo spazio di lavoro del grafico.
Ora tutte le strategie di trading basate o basate sull'indicatore dei livelli MinMax avranno un segnale aggiuntivo.
Inoltre, i massimi, i minimi e i prezzi di apertura di giorni, settimane e mesi possono fungere da livelli di supporto e resistenza. E in alcune strategie di trading, mostra i livelli di liquidità.
Spiegazione delle abbreviazioni:
HD - Massimo del giorno
OD - Apertura della giornata
LD - Minimo del giorno
HW - Massimo della settimana
OW - Scoperta della settimana
LW - Minimo della settimana
HM - Massimo del mese
OM - Scoperta del mese
LM - Minimo del mese
Utilizza l'indicatore dei livelli MinMax come aggiunta al tuo sistema di trading
Versione per MT5
Prova anche gli altri miei prodotti sul mercato https://www.mql5.com/ru/users/capitalplus/seller
Ti auguro grandi profitti nel trading!