Color Candles Identify the Major Trend
- Göstergeler
-
Ziheng Zhuang
 About me:a C/C++ programmer and forex trader, develop MT4/5 apps from October 2007.
Email: admin@fxmeter.com
My products: https://www.mql5.com/en/users/fxmeter/seller - Sürüm: 4.33
- Güncellendi: 17 Mayıs 2025
- Etkinleştirmeler: 10
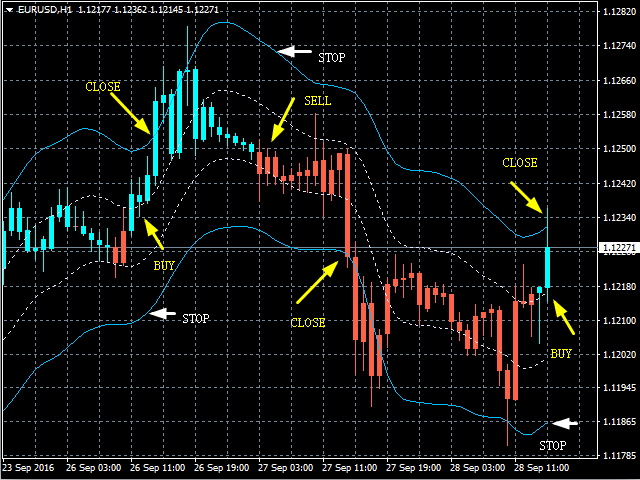
Gösterge iki bölümden oluşur.
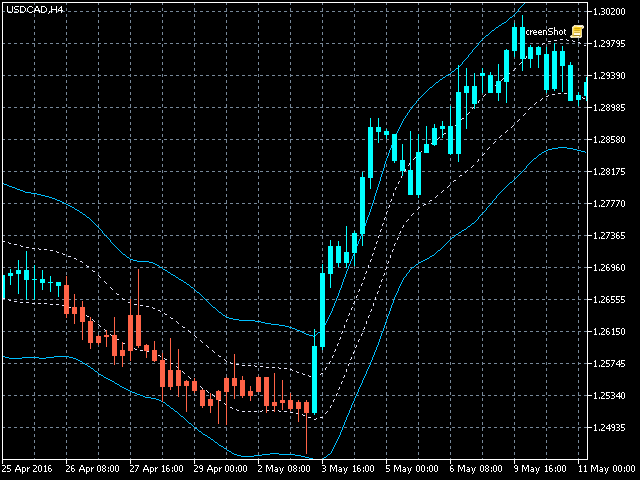
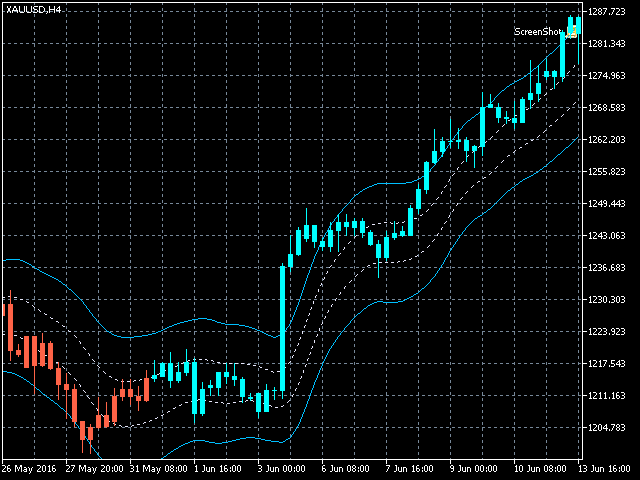
Bölüm I: Renkli Mumlar Ana Trendi Gösteriyor
Renkli mumlar, piyasa durumunu renkli mum çubuklarıyla tanımlamaktır.
Ekran görüntülerinde görüldüğü gibi renk Aqua ise piyasa uzun emir vermeniz veya kısa emirlerden çıkmanız gereken bir durumda demektir. Renk Domates ise kısa sipariş verme veya uzun siparişlerden çıkma zamanı gelmiştir.
Renk değişiyorsa tamamlanmasını beklemek daha iyidir (mevcut çubuk kapanana kadar).
Bölüm II: Bantların çizilmesi
İç bantlar güvenli alan olarak tanımlanırken, dış bantlar yakın emirlere yöneliktir.
Aşağıdaki gibi ticaret stratejisi:
- Renk Aqua ise ve fiyat iç bantlardaysa, uzun bir emir verin, fiyat dış bantları geçtiğinde siparişi kapatma zamanı gelmiştir.
- Renk Domates ise ve fiyat iç bantlardaysa kısa sipariş verin, fiyat dış bantları geçtiğinde siparişi kapatma zamanı gelmiştir.
Not : Sadece iç bantlarda fiyat oluştuğunda piyasaya giriş yapılır. Bu çok önemlidir.
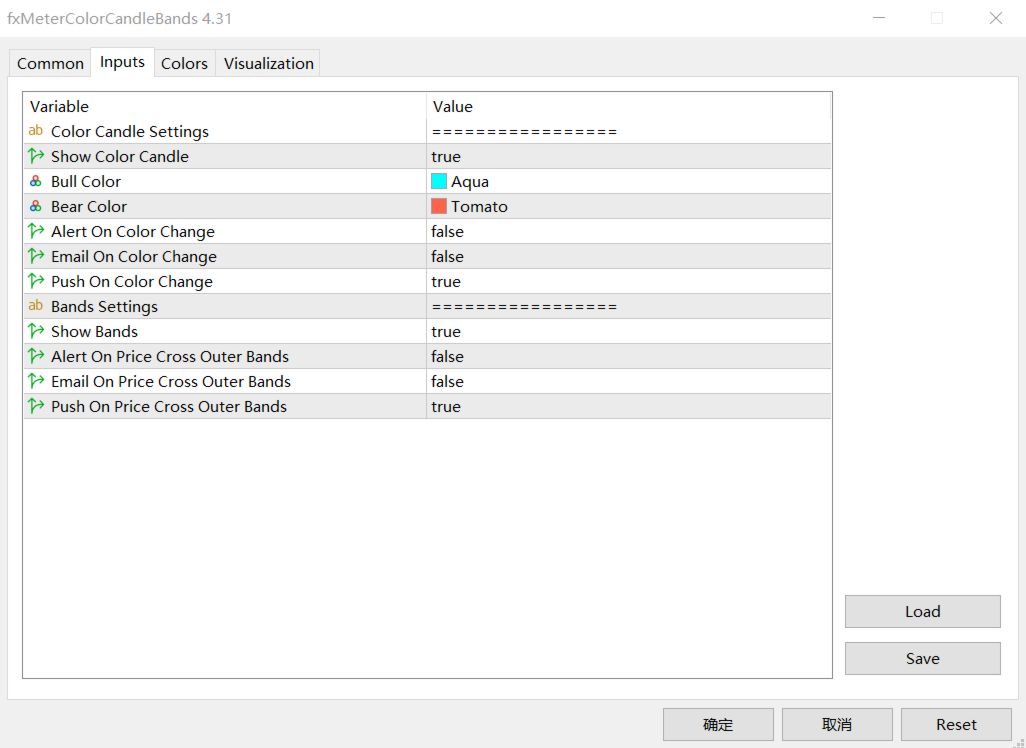
Giriş parametreleri
- ShowColorCandle - doğru, göstergenin renkli mum çizdiği anlamına gelir.
- AlertColorChange - true, renk değişimi bittiğinde uyarı verileceği anlamına gelir.
- EmailColorChange - true, renk değişimi tamamlandığında e-posta gönderileceği anlamına gelir.
- ShowBand - doğru, göstergenin bantları çizdiği anlamına gelir
- AlertCrossOuterBands - gerçek anlamda fiyat dış bantları geçtiğinde alarm verilecek
- AlertCrossOuttrBands - true, fiyat dış bantları geçtiğinde e-posta geleceği anlamına gelir.
MT4 Versiyonu: https://www.mql5.com/en/market/product/10455

Kullanıcı değerlendirmeye herhangi bir yorum bırakmadı