Multi oscillator divergence MT5

4.73

Gösterge, fiyat ile bir osilatör/gösterge arasında ne zaman bir farklılık oluştuğunu tanımlar. Hem düzenli hem de gizli sapmaları tanımlar. Yalnızca en güçlü kurulumları filtrelemeyi mümkün kılan bir RSI filtre seçeneğine sahiptir. Gösterge ayrıca bir Yutan formasyonu, Donchian kanalının kırılmasını veya fiyatın hareketli bir ortalamayı geçmesini beklemek için seçenekler sunar (bkz. ekran görüntüsü # 3)   ticaret fırsatının sinyalini vermeden önce farklılığı doğrulamak için. Kendi kurallarınız ve tekniklerinizle birlikte bu gösterge, kendi güçlü sisteminizi oluşturmanıza (veya geliştirmenize) izin verecektir.

Özellikleri

  • Sonunda   ürünün blogu   Göstergeden ticaret sinyallerini almak için iCustom() işlevini kullanan bir Örnek Uzman Danışmanın (EA) kaynak kodunu indirebileceksiniz. EA tamamen işlevsel olsa da, asıl amaç kodu kullanmak ve kendi geliştirdiğiniz EA'nıza yapıştırmaktır. Sınırlı zamanım göz önüne alındığında   Yine de herhangi bir programlama desteği sağlayamayacağım. Özür dilerim
  • Aşağıdaki osilatörler/göstergeler için sapmaları algılayabilir: MACD, OsMA, Stokastik, RSI, CCI, RVI, Awesome, ADX, Composite index, ATR, OBV, MFI, Momentum, Accumulation/Distribution ve Accelerator. Yalnızca bir osilatör/gösterge seçilebilir.
  • Normal/klasik (potansiyel tersine dönüş) sapmalar için düz çizgiler ve gizli (trend devamı) sapmalar için kesik çizgiler çizer. Çizgiler, grafikte ve gösterge penceresinde çizilir.
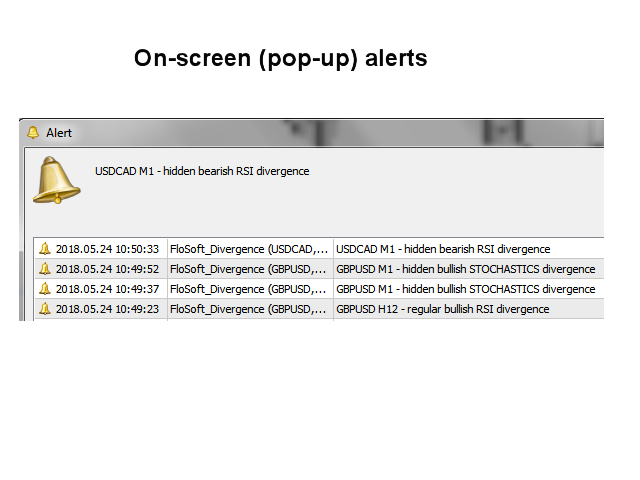
  • Bir sapma veya bir kopuş/çapraz tespit edildiğinde bir uyarı gönderir. Tüm Metatrader yerel uyarı türleri desteklenir.

Giriş parametreleri

Lütfen giriş parametrelerinin açıklamasını ve açıklamasını burada bulabilirsiniz .

İncelemeler 15
Nicolas Dobrovsky
839
Nicolas Dobrovsky 2025.09.27 09:49 
 

A very good indicator. Lots of settings for displaying signals, MA, Donchian, etc. This alone filters out many false signals. A few years ago, I used MT4, but I returned to this indicator in MT5. Of course, no indicator always displays 100% correct signals, so it is always necessary to check whether the divergence is correctly plotted, because sometimes the divergence is marked strangely. In any case, despite this, it is the best divergence indicator I have known since 2020.

A. Forex
300
A. Forex 2025.07.11 19:47 
 

Best divergence finder indicator for MT5 here and for really reasonable price. Impressed with:

- Amount of indicators you can choose for the purpose.

- How supportive, proactive and hardworking Mr Jan Flodin is.

- Detailed tuning of every divergence parameter.

Thank you, Sir.

Johan Julien Aubry
919
Johan Julien Aubry 2023.02.12 11:38 
 

Powerfull indicator, very cheap and with a lot of possibilities to customise settings. Can be used for entry points or to confirm other entries. Well documented and EA compatible. Jan is really helpful and very reactive. I totally recommend this product!

Önerilen ürünler
MercariaPattern1-2-3 відстежує рух ціни, знаходить трьоххвильові структури 1-2-3 та підсвічує момент, коли сценарій підтверджується пробоєм ключового рівня. MercariaPattern1-2-3 tracks price movement, detects three-leg 1-2-3 structures and highlights the moment when the scenario is confirmed by a key level breakout. Індикатор збирає локальні свінги в компактну фігуру 0–1–2–3 , чекає підтвердженого пробою та будує стрілку входу з готовими рівнями SL/TP. The indicator combines local swings into a
The ChanLun or Chan theory is one of the most popular trading theories in China. But it seems like that it has little influence in western countries. Actually, the Chan Theory is based on a sophisticated mathematical model. The basic idea ChanLun is to simplify the bar chart by its model. With the help of ChanLun, a trader can analyze and predict the trend of future goods, stocks. In ChanLun, there are several basic elements called fractals, strokes, line segments and pivots . A trader should pa
Owl Smart Levels MT5
Sergey Ermolov
4.03 (32)
MT4 versiyonu  |  FAQ Owl Smart Levels Indicator , Bill Williams'ın gelişmiş fraktalları , piyasanın doğru dalga yapısını oluşturan Valable ZigZag ve kesin giriş seviyelerini gösteren Fibonacci seviyeleri gibi popüler piyasa analiz araçlarını içeren tek gösterge içinde eksiksiz bir ticaret sistemidir. pazara ve kar elde edilecek yerlere. Stratejinin ayrıntılı açıklaması Gösterge ile çalışma talimatı Baykuş Yardımcısı ticaretinde Danışman Yardımcısı Kullanıcıların özel sohbeti -> Satın aldıktan
Automated Trendlines MT5
Georgios Kalomoiropoulos
Trend çizgileri, forex ticaretinde en önemli teknik analiz aracıdır. Ne yazık ki, çoğu tüccar onları doğru şekilde çizmez. Otomatik Trend Çizgileri göstergesi, piyasaların trend hareketini görselleştirmenize yardımcı olan ciddi tüccarlar için profesyonel bir araçtır. İki tür Trend Çizgisi, Boğa Trend Çizgisi ve Ayı Trend Çizgisi vardır. Yükseliş trendinde, Forex trend çizgisi, fiyat hareketinin en düşük salınım noktalarından geçer. En az iki "en düşük düşük"ü birleştirmek, bir trend çizgisi o
Naturu
Ivan Stefanov
5 (1)
“Naturu”, doğanın simetrisini algoritması olarak kullanan bir manuel indikatördür. Basit bir strateji ve gizli bilgelikle piyasayı fethedin! İndikatörü yüklediğinizde iki çizgi görürsünüz: Üst (Top) ve Alt (Bottom). Bir çizgiye tıklayarak aktifleştirin. Taşımak için, yerleştirmek istediğiniz mumun üzerine tıklayın. Bir tepe noktası ve bir dip noktası belirlersiniz, indikatör otomatik olarak hesaplar: Boğalar ve ayıların çıkarlarının en yakınlaştığı, destek veya direnç rolü oynaması en muhtemel b
This indicator can be considered as a trading system. It offers a different view to see the currency pair: full timeless indicator, can be used for manual trading or for automatized trading with some expert advisor. When the price reaches a threshold a new block is created according to the set mode. The indicator beside the Renko bars, shows also 3 moving averages. Features renko mode median renko custom median renko 3 moving averages wicks datetime indicator for each block custom notification
Auto Optimized RSI , doğru alım ve satım sinyalleri vermek için tasarlanmış, kullanımı kolay ve akıllı bir ok göstergesidir. Geçmiş verilere dayalı işlem simülasyonları kullanarak, her enstrüman ve zaman dilimi için en etkili RSI seviyelerini otomatik olarak belirler. Bu gösterge, bağımsız bir işlem sistemi olarak veya mevcut stratejinize entegre edilerek kullanılabilir ve özellikle kısa vadeli işlem yapanlar için faydalıdır. Geleneksel RSI’nin sabit seviyeleri (örneğin 70/30) yerine,   Auto Opt
ATrend
Zaha Feiz
4.82 (17)
ATREND: Nasıl Çalışır ve Nasıl Kullanılır ### Nasıl Çalışır "**ATREND**" göstergesi, MT5 platformu için tasarlanmış olup, traderlara sağlam alım ve satım sinyalleri sağlamak amacıyla teknik analiz metodolojilerinin bir kombinasyonunu kullanır. Bu gösterge, öncelikle volatilite ölçümü için Ortalama Gerçek Aralık (ATR) kullanır ve potansiyel piyasa hareketlerini belirlemek için trend tespit algoritmalarıyla birleştirir. Satın aldıktan sonra bir mesaj bırakın ve özel bir bonus hediyesi kazanın. ##
PR EA - Engulfing Pattern Trading System Automated Engulfing Pattern Detection with MA Confirmation The PR EA is a Meta Trader 5 expert advisor that identifies and trades bullish/bearish engulfing candlestick patterns when confirmed by a moving average filter. Designed for swing trading on 30-minute charts with compatibility for M15 and H1 time frames. Key Features: Pattern Recognition - Detects valid bullish/bearish engulfing candle formations Trend Confirmation - 238-period SMA filter
Looking for reliable levels on a price chart? Already tired of searching for similar indicators? Are the levels not working out as they should? Then this is the indicator for you. Volume Prices Universal is a reliable indicator of horizontal volumes. What does it show? First of all, the main idea of ​​the indicator is to display at which price mark the price has been for the longest time. Thus, the display of price volumes on the price chart is formed. With the help of which you can very simpl
AÇIKLAMA ICSM (Impulse-Correction SCOB Mapper), fiyat hareketini analiz eden ve geçerli impulsları, düzeltmeleri ve SCOB'ları (Single Candle Order Block) tanımlayan göstergedir. Esnek, bilgilendirici, kullanımı kolay olması ve tüccarın en likit ilgi alanlarına yönelik farkındalığını önemli ölçüde artırması nedeniyle her türlü teknik analizle kullanılabilen güçlü bir araçtır. AYARLAR Genel | Görsel Renk teması — ICSM'nin renk temasını tanımlar. SCOB | Görsel SCOB'u göster — SCOB'u etkinleş
This indicator scans the 1-3 Trendline pattern . The indicator is a 100 % non repaint low risk breakout system . The patterns are formed around swing high and swing lows which make them a low risk pattern with high reward. PATTERN BACKGROUND The 1-3 Trendline Breakout pattern is formed by four(4) points which are composed of three (3) primary points and the pattern neck. A trendline is always formed by the point 1 and the neck of the pattern . When price breaks out of the trendline formed , it
This indicator will help traders quickly identify inside bars, which are often used in price action trading strategies as potential consolidation or continuation patterns. An inside bar formation is a counter trend candle on both sides as it didn't break the previous candle high or low. Key feature: Identify inside bars in real-time. Colours inside bars while keeping normal bars. Configurable history bars. Optional pop-up alerts and phone notifications with symbol name and time of detection. W
Terra Infinity is a flat indicator. This improved version of the CalcFlat indicator has three additional lines that significantly increase its effectiveness. Unlike its predecessor with two static levels, Terra Infinity adds three dynamic lines above the main histogram, which are interpreted as follows: base signal line, minimum signal line, maximum signal line. These lines are formed using the additional parameter Avg, which is the average value of the histogram. Averaging produces a line cl
The RSI Divergence + FVG Signal indicator combines Relative Strength Index (RSI) Divergence with Fair Value Gap (FVG) detection to generate high-probability buy and sell signals based on both momentum shifts and institutional imbalance zones. Core Features: RSI Divergence Detection : Identifies both regular and hidden bullish/bearish divergences between price and RSI. Divergences indicate potential trend reversals or continuation. FVG Zone Recognition : Detects Fair Value Gaps (imbalances caused
Key level analysis : The indicator tracks the nearest annual high and low to the current price over a chosen number of years. Proximity alerts : It triggers an alert when the price reaches a specified number of pips from the nearest high or low. Customizable notification intervals : You can set how often alerts repeat, for example, every 30 minutes. Historical perspective : Enables long-term tracking of market levels and effective planning of trading strategies. Multi-currency support : This ind
PipFinite Trend PRO MT5
Karlo Wilson Vendiola
4.84 (556)
Breakthrough Solution For Trend Trading And Filtering With All Important Features Built Inside One Tool! Trend PRO's smart algorithm detects the trend, filters out market noise and gives entry signals with exit levels. The new features with enhanced rules for statistical calculation improved the overall performance of this indicator. Important Information Revealed Maximize the potential of Trend Pro, please visit www.mql5.com/en/blogs/post/713938 The Powerful Expert Advisor Version Automatin
The indicator detects divergence signals - the divergences between the price peaks and the MACD oscillator values. The signals are displayed as arrows in the additional window and are maintained by the messages in a pop-up window, e-mails and push-notifications. The conditions which formed the signal are displayed by lines on the chart and in the indicator window. The indicator parameters MacdFast - fast MACD line period MacdSlow - slow MACD line period MacdSignal - MACD signal line period Macd
Dot reversal
Vitalii Zakharuk
The Dot reversal indicator was created on the basis of the original indicators of the search for extremes, the indicator is well suited for detecting a reversal or a large sharp jerk to one side, thanks to it you will know when this will happen, it will notify you with the appearance of a blue point for buying red for selling It uses in its basis the process of identifying the rate of change in price growth and allows you to find points of entry and exit from the market. a fundamental technic
This Indicator help you to identify trends and patterns. It shows the short-term, medium-term and long-term trend at the same time on the screen. It supports every timeframe except monthly. This indicator NOT implement the ZigZag indicator, but it uses its own, fast react algorithm. Supported markets: -         Forex -         Metal -         Energies Spot -         in Energies Futures only o    US Crude Oils -         in Indices Spot only o    US Tech 100 Index o    UK 100 Index o    US Wall
TÜRKÇE – Monthly Levels Pro v1.0 En İyi Aylık Piyasa Seviyeleri Göstergesi Önemli piyasa bölgelerini anında takip edin. Monthly Levels Pro , uzun vadeli trendleri analiz etmenize ve aylık mumun High, Low, Open ve Close seviyelerini otomatik göstererek kritik destek ve direnç noktalarını hızlıca görmenizi sağlar. Avantajlar: Anında analiz Akıllı trading Net görselleştirme Esnek kullanım Basit ve etkili Uyumluluk: MT5, tüm zaman dilimleri
##   ONLY GOLD ##   Тiльки Золото ## **Mercaria Professional Trading Zones - Complete Guide** ## **Mercaria Professional Trading Zones - Повний посібник** ### **How Mercaria Zones Work / Як працюють зони Mercaria** **English:** Mercaria Zones is an advanced trading indicator that identifies high-probability support and resistance areas using ZigZag extremes combined with mathematical zone calculations. The indicator works on multiple timeframes simultaneously, providing a comprehensive view
All about time and price by ICT. This indicator provides a comprehensive view of ICT killzones, Silver Bullet times, and ICT Macros, enhancing your trading experience.  In those time windows price either seeks liquidity or imbalances and you often find the most energetic price moves and turning points. Features: Automatic Adaptation: The ICT killzones intelligently adapt to the specific chart you are using. For Forex charts, it follows the ICT Forex times: In EST timezone: Session: Asia: 20h00-0
The Trend Complete indicator is a signal indicator and has interesting properties. It should be taken into account that this indicator reflects extremes and should be used as an additional one, and another instrument should be used for the entry point. Searches for and displays pivot points on the price chart. Trend indicators are one of the main tools for analyzing trends in the Forex market. The indicator is able to transmit all types of signals to the user: messages, E-mail and Push! The go
This trading indicator is non-repainting, non-redrawing, and non-lagging, making it an ideal choice for both manual and automated trading. It is a Price Action–based system that leverages price strength and momentum to give traders a real edge in the market. With advanced filtering techniques to eliminate noise and false signals, it enhances trading accuracy and potential. By combining multiple layers of sophisticated algorithms, the indicator scans the chart in real-time and translates comple
This is Gekko's Cutomized Relative Strength Index (RSI), a customized version of the famous RSI indicator. Use the regular RSI and take advantage two entry signals calculations and different ways of being alerted whenever there is potential entry or exit point. Inputs Period: Period for the RSI calculation; How will the indicator calculate entry (swing) signals: 1- Produces Exit Signals for Swings based on RSI entering and leaving Upper and Lower Levels Zones; 2- Produces Entry/Exit Signals for
Market Trend Indicator Analog Telif Hakkı 2025, Jose María Molina Sánchez molinatrader67@gmail.com | Sürüm 1.00 Giriş Market Trend Indicator Analog , piyasanın trend gücünü ve yönünü gerçek zamanlı olarak ölçmek üzere tasarlanmış gelişmiş bir göstergedir. Geleneksel osilatörlerin aksine, bu gösterge piyasa koşullarına dinamik olarak tepki veren uyumlu bir filtreleme sistemi kullanır ve -100 ile +100 arasında kesin bir analog temsil sunar. Tasarımı, ticaretçilerin bir trendin başlangıc
Advanced Market Analysis Tool. Full Documentation: Download Free Professional Education Course: After purchasing, contact me to receive access to the complete CDV Professional Training Video Course. — It will help you master CDV , Aggressive Buyer & Seller dynamics , and Volume Microstructure concepts through a clear, step-by-step learning process. Overview The Professional CDV with Aggressive Score is a comprehensive volume analysis tool that combines visual Cumulative Delta Volume (CDV)
Engulfing with EMAs Indicator Unlock the power of advanced candlestick pattern detection with the Engulfing with EMAs Indicator , a cutting-edge tool designed for MetaTrader 5. This futuristic indicator combines the precision of engulfing pattern analysis with the trend-following strength of Exponential Moving Averages (EMA 21 and EMA 50), empowering traders to identify high-probability setups across all currency pairs and timeframes. Key Features: Comprehensive Engulfing Detection : Detects b
STRICTLY FOR BOOM INDEX ONLY!!!!! Here I bring the Maximum Trend Arrows OT1.0 MT5 indicator. This indicator is made up of a combination of different trend indicators for entries and exits, for entries an orange arrow will paint on the chart below the current market and a red flag for closing of trades and it produces buy arrows only. When the orange arrow appears, it will appear along with it's sound to notify you. The 1H timeframe is recommended, don't use it anywhere else than on the 1H timefr
Bu ürünün alıcıları ayrıca şunları da satın alıyor
Bu indikatörü satın alırsanız, Profesyonel Trade Manager’ımı  + EA ÜCRETSİZ olarak alacaksınız. Öncelikle, bu Ticaret Sistemi'nin Non-Repainting, Non-Redrawing ve Non-Lagging Göstergesi olduğunu vurgulamak önemlidir, bu da hem manuel hem de robot ticareti için ideal hale getirir. Online kurs, kılavuz ve ön ayarları indir. "Smart Trend Trading System MT5", yeni ve deneyimli tüccarlar için özelleştirilmiş kapsamlı bir ticaret çözümüdür. 10'dan fazla premium göstergeyi birleştiriyor ve 7'den fazla
Divergence Bomber
Ihor Otkydach
4.99 (77)
Bu göstergeyi satın alan herkese aşağıdaki ekstra içerikler ücretsiz olarak sunulmaktadır: Her işlemi otomatik olarak yöneten, Stop Loss ve Take Profit seviyelerini ayarlayan ve işlemleri strateji kurallarına göre kapatan özel yardımcı araç: "Bomber Utility" Göstergenin farklı varlıklar üzerinde kullanılmasına yönelik ayar dosyaları (set dosyaları) Bomber Utility için 3 farklı modda kullanım sunan ayar dosyaları: "Minimum Risk", "Dengeli Risk" ve "Bekle-Gör Stratejisi" Bu ticaret stratejisini hı
Gold Sniper Scalper Pro - MetaTrader 5'te Altın (XAU/USD) Ticaret Sistemi Ciddi yatırımcı için: Altın ticaretine, birden fazla piyasa analiz faktörünü birleştiren, yapılandırılmış, veriye dayalı bir metodoloji ile yaklaşın. Bu araç, Altın ticaret analizinizi desteklemek için üretilmiştir. Sınırlı Fiyat Fırsatı Bu, fiyat artmadan Gold Sniper Scalper Pro'ya sahip olma şansıdır.  Ürün fiyatı, sonraki her 10 satın alma işleminden sonra $50 artacaktır. Son Fiyat: $498 Analitik Avantajınızı Tanımlaya
*** Entry In The Zone ve SMC Multi Timeframe, Smart Money Concepts (SMC) çerçevesine dayalı olarak geliştirilmiş gerçek zamanlı bir piyasa analiz aracıdır. Entry In The Zone ve SMC Multi Timeframe, yatırımcıların piyasa yapısını daha sistematik ve net bir şekilde analiz etmelerine yardımcı olmak, işlem verimliliğini artırmak ve stratejiniz için uzun vadeli sürdürülebilirlik yaratmak amacıyla geliştirilmiştir. Bu araç, Smart Money Concepts (SMC) çerçevesine dayanmaktadır. Birden fazla zaman dilim
Atomic Analyst MT5
Issam Kassas
4.31 (26)
Öncelikle belirtmek gerekir ki bu Ticaret Göstergesi Yeniden Çizim Yapmaz, Gecikmez ve Gecikme Göstermez, bu da hem manuel hem de robot ticareti için ideal hale getirir. Kullanıcı kılavuzu: ayarlar, girişler ve strateji. Atom Analisti, Piyasada Daha İyi Bir Avantaj Bulmak İçin Fiyatın Gücünü ve Momentumunu Kullanan PA Fiyat Hareketi Göstergesidir. Gürültüleri ve Yanlış Sinyalleri Kaldırmaya ve Ticaret Potansiyelini Artırmaya Yardımcı Olan Gelişmiş Filtrelerle Donatılmıştır. Birden fazla katmanl
FX Power MT5 NG
Daniel Stein
5 (28)
FX Power: Daha Akıllı Ticaret Kararları için Para Birimlerinin Gücünü Analiz Edin Genel Bakış FX Power , her piyasa koşulunda başlıca para birimlerinin ve altının gerçek gücünü anlamak için vazgeçilmez bir araçtır. Güçlü para birimlerini alıp zayıf olanları satarak, FX Power ticaret kararlarınızı basitleştirir ve yüksek olasılıklı fırsatları ortaya çıkarır. İster trendlere sadık kalın ister Delta'nın aşırı değerlerini kullanarak tersine dönüşleri öngörün, bu araç ticaret tarzınıza mükemmel bir
SynaptixQuant Dominance Matrix
Devie Arevalo Montemayor
5 (1)
SynaptixQuant Dominance Matrix: Institutional-Grade Market State Extraction Engineered for traders who require a data-driven view of market behaviour beyond surface-level indicators. The Synaptix Quant (SQ) Dominance Matrix is not a conventional currency strength display. Behind its intentionally streamlined interface runs a sophisticated analytical architecture designed to quantify market conditions with precision. Every output is generated through layered signal processing built to identify d
Grabber System MT5
Ihor Otkydach
4.79 (19)
Size mükemmel bir teknik gösterge olan Grabber’ı tanıtıyorum. Bu araç, kullanıma hazır bir “her şey dahil” işlem stratejisi olarak çalışır. Tek bir yazılım kodu içinde güçlü piyasa teknik analiz araçları, işlem sinyalleri (oklar), uyarı işlevleri ve push bildirimleri entegre edilmiştir. Bu göstergeyi satın alan herkes aşağıdaki hediyeleri ücretsiz olarak alır: Açık emirleri otomatik yönetmek için Grabber Yardımcı Aracı Kurulum, yapılandırma ve nasıl işlem yapılacağını adım adım anlatan video kıl
Quantum TrendPulse
Bogdan Ion Puscasu
5 (19)
SuperTrend   ,   RSI   ve   Stochastic'in   gücünü tek bir kapsamlı göstergede birleştirerek işlem potansiyelinizi en üst düzeye çıkaran nihai işlem aracı olan   Quantum TrendPulse'u   tanıtıyoruz. Hassasiyet ve verimlilik arayan yatırımcılar için tasarlanan bu gösterge, piyasa trendlerini, momentum değişimlerini ve en uygun giriş ve çıkış noktalarını güvenle belirlemenize yardımcı olur. Temel Özellikler: SuperTrend Entegrasyonu:   Güncel piyasa trendlerini kolayca takip edin ve karlılık dalgası
Öncelikle, bu Ticaret Aracının Non-Repainting, Non-Redrawing ve Non-Lagging Gösterge olduğunu vurgulamakta fayda var, bu da onu profesyonel ticaret için ideal hale getiriyor. Çevrimiçi kurs, kullanıcı kılavuzu ve demo. Akıllı Fiyat Hareketi Kavramları Göstergesi, hem yeni hem de deneyimli tüccarlar için çok güçlü bir araçtır. İleri ticaret fikirlerini, Inner Circle Trader Analizi ve Smart Money Concepts Ticaret Stratejileri gibi 20'den fazla kullanışlı göstergeyi bir araya getirerek bir araya
Trend indicator AI mt5
Ramil Minniakhmetov
5 (12)
Trend Ai göstergesi, trend tanımlamasını işlem yapılabilir giriş noktaları ve geri dönüş uyarılarıyla birleştirerek bir yatırımcının piyasa analizini geliştirecek harika bir araçtır. Bu gösterge, kullanıcıların forex piyasasının karmaşıklıklarında güvenle ve hassasiyetle yol almalarını sağlar. Birincil sinyallerin ötesinde, Trend Ai göstergesi geri çekilmeler veya düzeltmeler sırasında ortaya çıkan ikincil giriş noktalarını belirleyerek, yatırımcıların belirlenen trend içindeki fiyat düzeltmele
FX Volume MT5
Daniel Stein
4.79 (24)
FX Volume: Bir Broker’ın Perspektifinden Gerçek Piyasa Duyarlılığını Deneyimleyin Kısa Özet Trading yaklaşımınızı bir adım öteye taşımak ister misiniz? FX Volume , perakende traderlar ile brokerların nasıl konumlandığını gerçek zamanlı olarak sunar—COT gibi gecikmeli raporlardan çok daha önce. İster istikrarlı kazançları hedefliyor olun, ister piyasada daha güçlü bir avantaj arayın, FX Volume önemli dengesizlikleri belirlemenize, kırılmaları (breakout) doğrulamanıza ve risk yönetiminizi iyileş
TPSproTREND PrO MT5
Roman Podpora
4.72 (18)
TREND PRO'yu hemen satın alın ve bir başka gelişmiş trend göstergesini ücretsiz edinin Almak için özel mesaj yoluyla yazın. VERSION MT4        —        ИНСТРУКЦИЯ RUS           —        INSTRUCTIONS  ENG Ana işlevler: VERME OLMADAN doğru giriş sinyalleri! Bir sinyal belirirse, alakalı kalır! Bu, bir sinyal sağlayıp daha sonra onu değiştirebilen ve mevduatta fon kaybına yol açabilen yeniden çekme göstergelerinden önemli bir farktır. Artık pazara daha büyük bir olasılık ve doğrulukla girebilirsi
Top indicator for MT5   providing accurate signals to enter a trade without repainting! It can be applied to any financial assets:   forex, cryptocurrencies, metals, stocks, indices .  Watch  the video  (6:22) with an example of processing only one signal that paid off the indicator! MT4 version is here It will provide pretty accurate trading signals and tell you when it's best to open a trade and close it. Most traders improve their trading results during the first trading week with the help of
Ne kadar harika geriye dönük testler, canlı hesap performans kanıtları ve her yerde fantastik istatistikler sunan bir alım satım göstergesi aldınız, ancak onu kullandıktan sonra hesabınızı **patlatmakla mı sonuçlandınız?** Bir sinyale tek başına güvenmemelisiniz, öncelikle neden ortaya çıktığını bilmeniz gerekir ve RelicusRoad Pro bunu en iyi şekilde yapar! Kullanım Kılavuzu + Stratejiler + Eğitim Videoları + VIP Erişimli Özel Grup + Mobil Sürüm Mevcut Piyasaya Bakmanın Yeni Bir Yolu RelicusR
TrendLine PRO MT5
Evgenii Aksenov
4.67 (33)
Trend Line PRO   göstergesi bağımsız bir işlem stratejisidir. Trend değişimini, işleme giriş noktasını gösterir ve ayrıca üç seviyede Kar Al ve Zarar Durdur korumasını otomatik olarak hesaplar. Trend Line PRO , tüm Meta Trader sembolleri için mükemmeldir: para birimleri, metaller, kripto para birimleri, hisse senetleri ve endeksler. Gösterge, gerçek hesaplarda işlem yaparken kullanılır ve bu da stratejinin güvenilirliğini doğrular. Trend Line PRO   ve gerçek Sinyal kullanan robotlar burada bu
Market Structure Patterns
Samuel Manoel De Souza
4.47 (19)
Uygun sürümler:   MT4   ve   MT5 . Market Structure Patterns kanalına katılın – çalışma materyallerini indirin ve ek bilgiler edinin. İlgili gönderiler: Market Structure Patterns – Giriş Market Structure Patterns , smart money concepts (akıllı para kavramları) temelinde geliştirilen ve SMC/ICT öğelerini grafik üzerinde gösteren bir göstergedir. Bu öğeler, işlem kararlarınızı bir üst seviyeye taşımanıza yardımcı olur. Grafikte bir unsur oluştuğunda, fiyat bir seviyeyi geçtiğinde veya bir kutu/b
Quantum Trend Sniper
Bogdan Ion Puscasu
4.74 (53)
Tanıtım       Kuantum Trend Keskin Nişancı Göstergesi   , trend tersine dönmeleri belirleme ve ticaret yapma şeklinizi değiştiren çığır açan MQL5 Göstergesi! 13 yılı aşkın ticaret tecrübesine sahip deneyimli tüccarlardan oluşan bir ekip tarafından geliştirilmiştir.       Kuantum Trend Keskin Nişancı Göstergesi       trend dönüşlerini son derece yüksek doğrulukla belirlemenin yenilikçi yolu ile ticaret yolculuğunuzu yeni zirvelere taşımak için tasarlanmıştır. ***Kuantum Trend Keskin Nişancı Göst
Trend Forecaster
Alexey Minkov
5 (7)
The Trend Forecaster indicator utilizes a unique proprietary algorithm to determine entry points for a breakout trading strategy. The indicator identifies price clusters, analyzes price movement near levels, and provides a signal when the price breaks through a level. The Trend Forecaster indicator is suitable for all financial assets, including currencies (Forex), metals, stocks, indices, and cryptocurrencies. You can also adjust the indicator to work on any time frames, although it is recommen
ARIScalping
Temirlan Kdyrkhan
ARIScalp is a powerful trading companion designed to generate high-probability entry signals with dynamic TP/SL/DP levels based on volatility. Built-in performance tracking shows win/loss stats, PP1/PP2 hits, and success rates all updated live. Key Features: Buy/Sell signals with adaptive volatility bands Real-time TP/SL/DP levels based on ATR Built-in MA Filter with optional ATR/StdDev volatility Performance stats panel (Success, Profit/Loss, PP1/PP2) Alerts via popup, sound, push, or email Cus
Yeni Başlayanlar veya Uzman Tüccarlar için En İyi Çözüm! Bu Gösterge benzersiz, yüksek kaliteli ve uygun fiyatlı bir ticaret aracıdır çünkü bir dizi tescilli özellik ve yeni bir formül ekledik. Sadece BİR grafik ile 28 Forex çifti için Döviz Gücünü okuyabilirsiniz! Yeni bir trendin veya scalping fırsatının tam tetik noktasını belirleyebildiğiniz için ticaretinizin nasıl gelişeceğini hayal edin? Kullanım kılavuzu:   buraya tıklayın Bu ilk olan, orijinal! Değersiz bir özenti klonunu almayın.
Was: $249  Now: $99   Market Profile defines a number of day types that can help the trader to determine market behaviour. A key feature is the Value Area, representing the range of price action where 70% of trading took place. Understanding the Value Area can give traders valuable insight into market direction and establish the higher odds trade. It is an excellent addition to any system you may be using. Inspired by Jim Dalton’s book “Mind Over Markets”, this indicator is designed to suit the
Blahtech Supply Demand MT5
Blahtech Limited
4.54 (13)
Was: $299  Now: $99  Supply Demand uses previous price action to identify potential imbalances between buyers and sellers. The key is to identify the better odds zones, not just the untouched ones. Blahtech Supply Demand indicator delivers functionality previously unavailable on any trading platform. This 4-in-1 indicator not only highlights the higher probability zones using a multi-criteria strength engine, but also combines it with multi-timeframe trend analysis, previously confirmed swings a
Shock Pullback
Suleiman Alhawamdah
5 (1)
Basitçe söylemek gerekirse, mevcut mum çubuğunun yanında “pip” olarak bilinen beyaz sayıların hareketi görünmeye başladığında işlem yapmaya başlayabilirsiniz. Beyaz “pip”ler, bir alım veya satım işleminin şu anda aktif olduğunu ve beyaz renkleriyle belirtildiği gibi doğru yönde ilerlediğini gösterir. Beyaz pip hareketi durduğunda ve sabit yeşil renge dönüştüğünde, bu mevcut ivmenin sona erdiğini gösterir. Sayıların yeşil rengi, alım veya satım işlemiyle elde edilen toplam kârı “pip” cinsinden t
Super Signals Channel Indicator Its channel is a non-repaint indicator that reacts more with recent price movements. For this reason, the Super Signals Channel Indicator is a better match for short-term or day trading strategy. The Super Signals Channel only plots swing trading opportunities. So most of its trade signals appear during consolidation or sidelined periods of the market. Super Signals Channel Indicator for MT5 Explanation The green band below the price shows the dynamic support lev
Volume Profile Pro Signals  Kesin hacim analizi ve otomatik sinyal üretiminin birleşimi. Ne yapar Volume Profile Pro Signals, işlem hacminin gerçekten nerede gerçekleştiğine dair canlı, veri odaklı bir görünüm oluşturur — fiyatın kabul edildiği veya reddedildiği piyasa bölgelerini ortaya koyar. POC, VAH, VAL’i vurgular ve HVN/LVN alanlarını hassas şekilde tespit eder. Bunlara dayanarak gerçek zamanlı VAH/VAL breakout sinyalleri üretir ve ATR volatilitesinden akıllı SL/TP seviyelerini çizer. Pr
MACD Gün İçi Trend PRO, 1960'larda Gerald Appel tarafından oluşturulan orijinal MACD'nin uyarlanmasıyla geliştirilen bir Göstergedir. Yıllarca süren ticaret sayesinde, MACD'nin parametrelerini Fibonacci oranlarıyla değiştirerek, trend hareketlerinin sürekliliğinin daha iyi bir sunumunu sağladığımız ve bir fiyat trendinin başlangıcını ve sonunu daha verimli bir şekilde tespit etmeyi mümkün kıldığımız gözlemlendi. Fiyat trendlerini tespit etmedeki etkinliği sayesinde, üst ve dip farklarını çok
Matrix Arrow Indicator MT5
Juvenille Emperor Limited
5 (17)
Matrix Arrow Indicator MT5 ,   forex ,   emtialar ,   kripto   para birimleri ,   endeksler ,   hisse senetleri   gibi tüm sembollerde/araçlarda kullanılabilen   %100 yeniden boyamayan   çoklu zaman çerçevesi göstergesini izleyen benzersiz bir 10'u 1 arada trenddir.  Matrix Arrow Indicator MT5 , mevcut eğilimi erken aşamalarında belirleyecek ve aşağıdakiler gibi 10'a kadar standart göstergeden bilgi ve veri toplayacaktır: Ortalama Yönlü Hareket Endeksi (ADX) Emtia Kanal Endeksi (CCI) Klasik Hei
TPSpro RFI Levels MT5
Roman Podpora
4.5 (18)
TALİMATLAR RUS  /  TALİMATLAR   ENG  /  Sürüm MT4 Ana fonksiyonları: Satıcı ve alıcıların aktif bölgelerini görüntüler! Gösterge, satın alma ve satışlar için tüm doğru ilk dürtü seviyelerini/bölgelerini görüntüler. Giriş noktaları arayışının başladığı bu seviyeler/bölgeler etkinleştirildiğinde, seviyeler renk değiştirir ve belirli renklerle doldurulur. Ayrıca, durumun daha sezgisel bir şekilde algılanması için oklar görünür. LOGIC AI - Bir şablonu etkinleştirirken giriş noktalarını aramak için
AriX
Temirlan Kdyrkhan
1 (4)
AriX Indicator for MT5 A powerful trend-following and signal-evaluation tool AriX is a custom MT5 indicator that combines Moving Averages and ATR-based risk/reward logic to generate clear buy/sell signals. It visualizes dynamic SL/TP levels, evaluates past trade outcomes, and displays win/loss statistics in a clean on-chart panel. Key features include: Buy/Sell signals based on MA crossovers ATR-based SL/TP1/TP2/TP3 levels with visual lines and labels Signal outcome tracking with real-time stat
Yazarın diğer ürünleri
The indicator identifies when a divergence occurs between price and an indicator or oscillator. It identifies both regular and hidden divergences. Combined with your own rules and techniques, this indicator will allow you to create (or enhance) your own powerful system. For higher probability setups I can recommend you to use my Supply Demand indicator and trade only if the divergence occurs inside a zone. Supply zone for bearish div and demand zone for bullish div. The optimal scenario is if it
FREE
Bu arz ve talep bölgesi göstergesi, grafikteki bölgeleri çizer ve fiyat bir bölgeye ulaştığında veya bir bölgeyi kırdığında uyarılar gönderir. Bölgeler yerine normal çift tepeler/dipler hakkında uyarı almak için de kullanmak mümkündür. Yalnızca en güçlü kurulumları filtrelemek için RSI, hacim ve sapma filtrelerini kullanmak mümkündür. Kendi kurallarınız ve tekniklerinizle birlikte bu gösterge, kendi güçlü sisteminizi oluşturmanıza (veya geliştirmenize) izin verecektir. Bu gösterge, Arz Talebine
I recommend you to read the   product's blog  (manual) from start to end so that it is clear from the beginning what the indicactor offers. This multi time frame and multi symbol divergence dashboard indicator sends an alert when one or two different divergences have been identified. It can be used with all time frames from M1 to MN. Maximum 9 time frames can be shown in the dashboard at the same time. It is possible to enable moving average, RSI or Bollinger bands trend filter to filter out on
Bu gösterge, grafikte arz ve talep bölgeleri çizer. Kendi kurallarınız ve tekniklerinizle birleştiğinde, bu gösterge kendi güçlü sisteminizi yaratmanıza (veya geliştirmenize) olanak tanır. Lütfen çok daha fazlasını sunan   ücretli sürümü   de inceleyin. Tavsiyem, ilk bölge testinin en az 25 bardan sonra gerçekleştiği işlem fırsatlarını aramanızdır. Özellikler Bölgeler 3 renge sahiptir (girişle ayarlanabilir). Test edilmemiş bölge için koyu renk, test edilmiş bölge için orta renk   ve bozuk bölge
FREE
I recommend you to read the   product's blog  (manual) from start to end so that   it is clear from the beginning what the indicator offers. This multi oscillator, multi time frame and multi symbol indicator identifies when a divergence occurs between price and an oscillator/indicator. It identifies both regular/classical (trend reversal) and hidden (trend continuation) divergences. It has moving average, RSI/Bollinger, ADX, pin bar and engulfing filter options which makes it possible to filter
This indicator can send alerts when a Heiken Ashi Smoothed color change occurs. Combined with your own rules and techniques, this indicator will allow you to create (or enhance) your own powerful system. Features Can send all types of alerts. Option to delay the alert one or more bars in order to confirm the color (trend) change. Input parameters Candle shift for alert: Default is 1. Setting it to 0 will alert you on color change on the current candle. This should be regarded as a pending (uncon
FREE
Bu gösterge, grafikte arz ve talep bölgeleri çizer. Kendi kurallarınız ve tekniklerinizle birleştiğinde, bu gösterge kendi güçlü sisteminizi yaratmanıza (veya geliştirmenize) olanak tanır. Lütfen çok daha fazlasını sunan   ücretli sürümü   de inceleyin. Tavsiyem, ilk bölge testinin en az 25 bardan sonra gerçekleştiği işlem fırsatlarını aramanızdır. Özellikler Bölgeler 3 renge sahiptir (girişle ayarlanabilir). Test edilmemiş bölge için koyu renk, test edilmiş bölge için orta renk   ve bozuk bölge
FREE
The indicator identifies when a divergence occurs between price and an indicator or oscillator. It identifies bullish and bearish hidden or regular (classical) divergences. Combined with your own rules and techniques, this indicator will allow you to create (or enhance) your own powerful system. For higher probability setups I can recommend you to use my  Supply Demand indicator  and trade only if the divergence occurs inside a zone. Supply zone for bearish div and demand zone for bullish div. T
FREE
Bu çoklu zaman çerçevesi ve çoklu sembol göstergesi, Pin çubukları, Sabah/akşam yıldızları, Yutma, Cımbız, Üç Çizgi Darbesi, İç çubuklar ve Flamalar ve Üçgenler için tarama yapar.   Gösterge, tekli grafik modunda da kullanılabilir. Lütfen bu seçenek hakkında daha fazla bilgiyi ürünün       blog   .       Kendi kurallarınız ve tekniklerinizle birlikte bu gösterge, kendi güçlü sisteminizi oluşturmanıza (veya geliştirmenize) izin verecektir. Özellikleri Piyasa İzleme pencerenizde görünen tüm sembol
Lütfen mümkünse satın almayı düşünün       Geliştirmeye devam edeceğim   MT5 sürümü   (bu MT4 sürümü için gelecekte güncelleme olmayacak). Ayrıca okumanızı tavsiye ederim       Baştan sona   ürün blogu   (kılavuz) böylece EA'nın ne sunduğu baştan belli olur. Bu Uzman danışmanın (EA) ana stratejisi, 3 hareketli ortalama (MA) ardışık hizada ve birbirinden belirli bir mesafede olduğunda alım satım yapmaktır (örneğin, bazı kurumsal tüccarlar tarafından kullanılan çok iyi bilinmeyen bir strateji içi
This multi indicator/oscillator (hereafter indicator), multi time frame and multi symbol indicator identifies when a divergence occurs between price and one, two or three indicators. It identifies both regular/classical (trend reversal) and hidden (trend continuation) divergences. It has RSI and MA trend filter options which makes it possible to filter out only the strongest setups. Combined with your own rules and techniques, this indicator will allow you to create (or enhance) your own powerfu
This indicator can send alerts when a Heiken Ashi Smoothed color change occurs. Combined with your own rules and techniques, this indicator will allow you to create (or enhance) your own powerful system. Features Can send all types of alerts. Option to delay the alert one bar in order to confirm the color (trend) change. Input parameters Wait for candle close: 'true' or 'false'. Setting it to 'true' will delay the alert to the opening of the bar following the bar where the color change occurred.
FREE
Bu çoklu zaman çerçevesi ve çoklu sembol göstergesi, ikili üst/alt, baş ve omuz, flama/üçgen ve bayrak desenlerini tanımlar. Uyarıları yalnızca bir boyun çizgisi/üçgen/bayrak direği kopması meydana geldiğinde ayarlamak da mümkündür (boyun çizgisi kırılması = üst/alt ve baş ve omuzlar için onaylanmış sinyal).       Gösterge, tekli grafik modunda da kullanılabilir. Lütfen bu seçenek hakkında daha fazla bilgiyi ürünün       blog   Kendi kurallarınız ve tekniklerinizle birlikte bu gösterge, kendi gü
EA'nın ne sunduğunun en başından anlaşılabilmesi için   ürünün blogunu   (kılavuzunu) baştan sona okumanızı tavsiye ederim. Bu Uzman Danışman, fiyat ile osilatör/gösterge arasında ne zaman bir farklılık oluştuğunu belirler. Hem düzenli/klasik (trendin tersine dönmesi) hem de gizli (trend devamı) sapmaları tanımlar. Yalnızca en güçlü kurulumların filtrelenmesini mümkün kılan arz/talep bölgesi, RSI, bollinger, stokastik, hareketli ortalama (normal MA ve Hull MA), ADX ve hacim filtresi seçenekleri
okumanı tavsiye ederim       ürünün blogu   (kılavuz) baştan sona böylece       EA'nın ne sunduğu en başından belli. Bu Uzman danışmanın (EA) ana stratejisi, 3 hareketli ortalama (MA) ardışık hizada ve birbirinden belirli bir mesafede olduğunda alım satım yapmaktır (örneğin, bazı kurumsal tüccarlar tarafından kullanılan çok iyi bilinmeyen bir strateji için kullanılabilir) , D1 zaman çerçevesindeki MA 10, 20 ve 30'u içerir). EA en iyi H1 ve daha büyük zaman dilimlerinde çalışır. Üçlü MA strateji
I recommend you to read the   product's blog  (manual) from start to end so that it is clear from the beginning what the indicactor offers. This multi time frame and multi symbol indicator can identify the following 5 crosses: when a fast moving average crosses a slow moving average line. when price has reached a single moving average (closed above/below or just bounced). when a triple moving average formation has appeared (all 3 MA:s in consecutive alignment). when the MACD main line crosses t
I recommend you to read the   product's blog  (manual) from start to end so that it is clear from the beginning what the indicactor offers. This indicator for Metatrader 4 identifies when a divergence occurs between price and an oscillator/indicator. It identifies both bullish and bearish divergences. It has a RSI filter option which makes it possible to filter out only the strongest setups. The indicator also offers options to wait for an Engulfing formation, Donchian channel breakout or for p
I  recommend you to read the   product's blog  (manual) from start to end so that it is clear from the beginning what the indicator offers. This multi time frame and multi symbol indicator identifies double top/bottom, head & shoulders, pennant/triangle and flag patterns. It is also possible to setup alerts only when a neckline/triangle/flagpole breakout has occured (neckline breakout = confirmed signal for top/bottoms and head & shoulders).  The indicator can also be used in single chart mode.
This indicator recognizes a special type of Inside Bar formation which is formed by a big Master candle followed by 4 smaller candles (please see the strategy explanation below). Features Plots buy/sell stop lines on the chart as well as well as take profit and stop loss levels. The TP/SL levels are based on the Average True Range (ATR) indicator. Object colors are changeable. Sends you a real-time alert when a Master candle formation is identified - sound / popup / email / push notification. On
Okumanızı tavsiye ederim       Ürünün blogunu   (kılavuzunu) en baştan sona okuyun, böylece göstergenin ne sunduğu en baştan itibaren açıkça anlaşılsın. Bu çoklu zaman dilimi ve çoklu sembol göstergesi pin çubuklarını tarar. Kendi kurallarınız ve tekniklerinizle birleştiğinde, bu gösterge kendi güçlü sisteminizi yaratmanıza (veya geliştirmenize) olanak tanır. Özellikler Market Watch pencerenizde görünen tüm sembolleri aynı anda izleyebilirsiniz. Göstergeyi sadece bir grafiğe uygulayın ve tüm pi
I  recommend you to read the   product's blog  (manual) from start to end so that it is clear from the beginning what the indicator offers. This multi time frame and multi symbol indicator scans for engulfing and tweezer formations. The indicator can also be used in single chart mode. Combined with your own rules and techniques, this indicator will allow you to create (or enhance) your own powerful system. Features Can monitor all symbols visible in your Market Watch window at the same time. Ap
This multi time frame and multi symbol indicator identifies high-probability breakout patterns. It does this by identifying strong, symmetrical pennants and triangles. This pattern DOES NOT appear very often on higher time frames. But when it does, it is a very high-probability setup. The indicator also includes an Inside bars scanner. It can for example be used to detect a special type of Inside bars formation which is formed by a Master candle (MC) followed by 4 inside candles (please see the
Features This is an indicator that recognizes a special type of Inside Bar formation which is formed by a Master candle followed by 4 smaller candles (please see the strategy explanation below). Plots buy/sell stop lines on the chart as well as well as take profit and stop loss levels. The TP/SL levels are based on the Average True Range (ATR) indicator. Object colors are changeable. Sends you a real-time alert when a Master candle formation is identified - sound / pop-up / email / push notifica
This multi time frame and multi symbol indicator scans for Pin bars, Morning/Evening stars, Engulfings, Tweezers, Three line strikes, Inside bars and Pennants and Triangles. The indicator can also be used in single chart mode. Please read more about this option in the product's blog . Combined with your own rules and techniques, this indicator will allow you to create (or enhance) your own powerful system. Features Can monitor all symbols visible in your Market Watch window at the same time. App
I  recommend you to read the   product's blog  (manual) from start to end so that it is clear from the beginning what the indicator offers. This multi symbol and multi time frame indicator scans for the following candlestick patterns (please see screenshot for explanation of the patterns): Three white soldiers (reversal>continuation pattern) Three black crows (reversal>continuation pattern) Bullish and bearish Three line strike (reversal pattern) The patterns do not appear very often on higher
I recommend you to read the   product's blog  (manual) from start to end so that it is clear from the beginning what the indicactor offers. This multi time frame and multi symbol indicator identifies double or triple top/bottom formations or a following neckline breakout (confirmed top/bottom). It offers filters for RSI overbought/oversold, candle patterns (pin bar, engulfing, tweezer, morning/evening star, three line strike) and divergences (MACD, OsMA, Awesome (AO), RSI, CCI, Stochastic) whic
This multi indicator/oscillator (hereafter indicator), multi time frame and multi symbol indicator identifies when a divergence occurs between price and one, two or three indicators. It identifies both regular/classical (trend reversal) and hidden (trend continuation) divergences. It has RSI and MA trend filter options which makes it possible to filter out only the strongest setups. Combined with your own rules and techniques, this indicator will allow you to create (or enhance) your own powerfu
This multi time frame and multi symbol indicator identifies when the stochastics signal line (D) crosses the stochastics main line (K) as well as options  to scan for main line and signal line level crossovers.  As a bonus it can also scan for Bollinger bands and RSI overbought/oversold crosses. Combined with your own rules and techniques, this indicator will allow you to create (or enhance) your own powerful system. Features Can monitor all symbols visible in your Market Watch window at the sam
This cost averaging Expert advisor (EA) places additional trades in the same direction as the original (manually opened) order when the price goes against you. It can be used as a grid system or as pure martingale system (exponential increasing of lot size) or smoothed martingale (for instance linear increasing of the lot size). Due to the risk involved, this EA is more suitable for intermediate to advanced traders who are well aware of how to handle risk management and trading an already profit
I recommend you to read the   product's blog  (manual) from start to end so that it is clear from the beginning what the indicactor offers. This multi time frame and multi symbol trend indicator sends an alert when a strong trend or trend reversal has been identified. It can do so by selecting to build up the dashboard using Moving average (single or double ( both MA:s aligned and price above/below both ) ), RSI, Bollinger bands, ADX, Composite index, Parabolic SAR, Awesome (AO), MACD (signal l
Filtrele:
Nicolas Dobrovsky
839
Nicolas Dobrovsky 2025.09.27 09:49 
 

A very good indicator. Lots of settings for displaying signals, MA, Donchian, etc. This alone filters out many false signals. A few years ago, I used MT4, but I returned to this indicator in MT5. Of course, no indicator always displays 100% correct signals, so it is always necessary to check whether the divergence is correctly plotted, because sometimes the divergence is marked strangely. In any case, despite this, it is the best divergence indicator I have known since 2020.

A. Forex
300
A. Forex 2025.07.11 19:47 
 

Best divergence finder indicator for MT5 here and for really reasonable price. Impressed with:

- Amount of indicators you can choose for the purpose.

- How supportive, proactive and hardworking Mr Jan Flodin is.

- Detailed tuning of every divergence parameter.

Thank you, Sir.

Jan Flodin
138178
Geliştiriciden yanıt Jan Flodin 2025.07.12 10:36
Many thanks for the review :-)
I have now added the option to search for smaller divergences (minimum 4 candles, including the 2 extremum candles). I have also fixed the ADX DI Minus mode divergence algorithm.
tchianefe
122
tchianefe 2025.01.24 08:44 
 

Jan, this is a very good indicator. l would like to make some enquiry from you privately.

Jan Flodin
138178
Geliştiriciden yanıt Jan Flodin 2025.01.24 09:13
Hello and many thanks for your review :-) I have accepted you friend request and you are free to write me a PM.
liken0908
179
liken0908 2024.07.21 10:33 
 

Kullanıcı incelemeye herhangi bir yorum bırakmadı

Jan Flodin
138178
Geliştiriciden yanıt Jan Flodin 2024.07.22 19:50
Hello and thanks for letting me know. I am on vacation at the moment but will have a look at this when I return home on Wednesday.
Best regards,
Jan
Johan Julien Aubry
919
Johan Julien Aubry 2023.02.12 11:38 
 

Powerfull indicator, very cheap and with a lot of possibilities to customise settings. Can be used for entry points or to confirm other entries. Well documented and EA compatible. Jan is really helpful and very reactive. I totally recommend this product!

Daviddollar
86
Daviddollar 2022.06.30 17:04 
 

Not worth it, it alerts after the divergence is triggered. When using backtest only shows the confirmed ones and erases de rest.

Edensgarden
20
Edensgarden 2022.01.17 14:27 
 

It's a very good divergence indicator; it does what is promised by Jan. I have incorporated this tool into my trading habits. Also great support from Jan.

kamz1419
149
kamz1419 2021.07.16 18:14 
 

Great product, works as exactly as required and the alerts are timely and you change and choose from a range of settings. The support Jan offers os excellent and he replies very fast with the required solutions. Thanks

hpolanco
64
hpolanco 2021.02.26 00:31 
 

Please add multicolor histogram EXAMPLE: http://www.profitf.com/wp-content/uploads/2015/03/MACD-color.jpg

marco
142
marco 2020.10.04 11:05 
 

Very interesting Indicator and Jan is a super Friendly & Dedicated Developer

jacki robo
88
jacki robo 2020.09.07 09:18 
 

this indicator was great .I want to give 1000 star!

Robby Wijaya
245
Robby Wijaya 2020.04.14 20:30 
 

This indicator are very very great and smart, its catch almost 90% of divergence form but when you know how to use it properly for scalping strategy then this indicator I can say Perfect 100% !! Thanks Jan you are ROCK , GBU

Hasan Yildirim
913
Hasan Yildirim 2019.12.30 14:28 
 

Kullanıcı incelemeye herhangi bir yorum bırakmadı

Erik Vikanes Hansen
226
Erik Vikanes Hansen 2019.08.22 12:02 
 

This indicator seems to be very promising, where it gives reliable entry signals and one can choose from a variety of different oscillators. I have been using it for a short time and so far I am very happy. Jan the developer, is also very friendly and easy to get in touch with. He helps out with his experience with regards to both choosing the best oscillator and preferred settings for different instruments. So far I would recommend this indicator. It is very easy to play around with all the different oscillators and settings for backtesting.

Thomas
84
Thomas 2019.06.11 14:37 
 

Kullanıcı incelemeye herhangi bir yorum bırakmadı

İncelemeye yanıt