Cumulative Delta MT4
- Göstergeler
- Sürüm: 3.6
- Güncellendi: 10 Kasım 2024

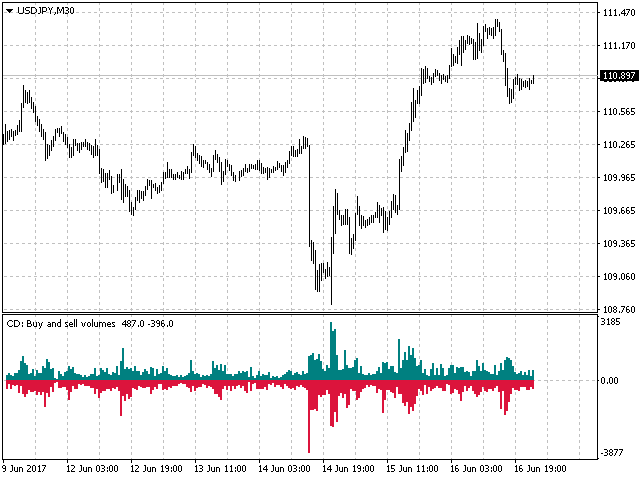
The indicator analyzes the volume scale and splits it into two components - seller volumes and buyer volumes, and also calculates the delta and cumulative delta.
The indicator does not flicker or redraw, its calculation and plotting are performed fairly quickly, while using the data from the smaller (relative to the current) periods.
The indicator operation modes can be switched using the Mode input variable:
- Buy - display only the buyer volumes.
- Sell - display only the seller volumes.
- BuySell - display only the buyer and seller volumes in two separate scales.
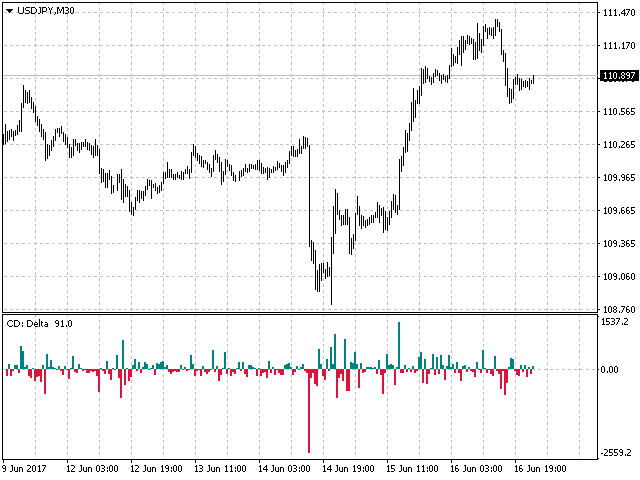
- Delta - the mode of difference (delta) between the buyer volumes and seller volumes.
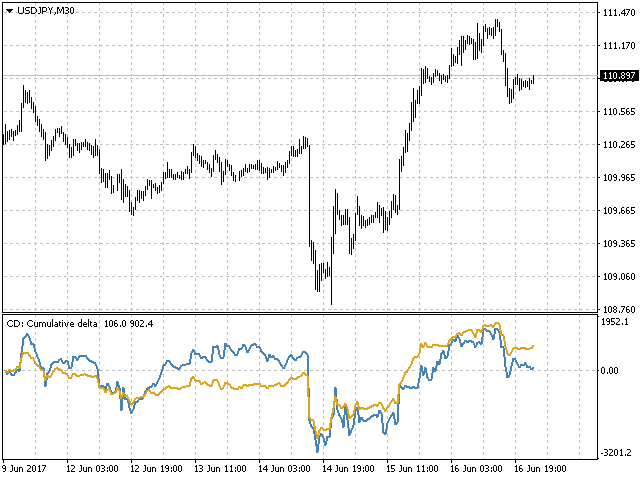
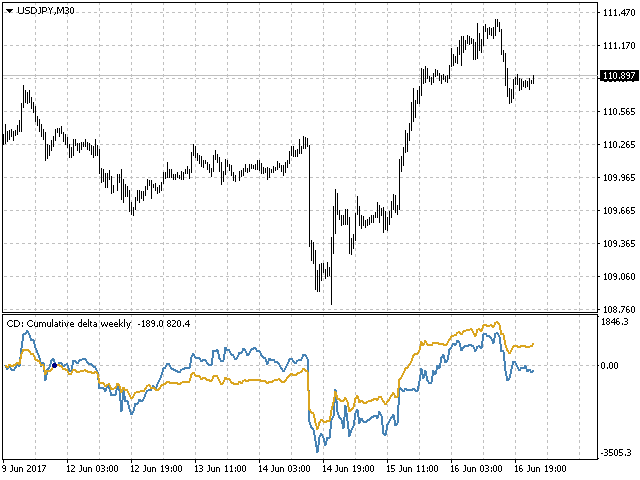
- CumDelta - cumulative delta mode.
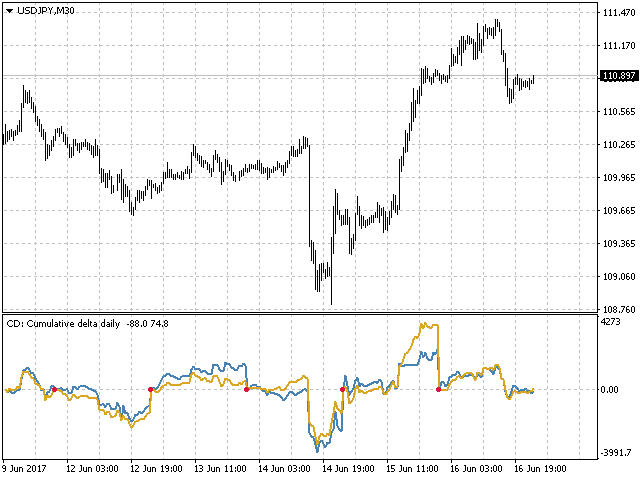
- CumDeltaDaily - cumulative delta mode with zeroing the balance at the beginning of each day.
- CumDeltaWeekly - cumulative delta mode with zeroing the balance at the beginning of each week.
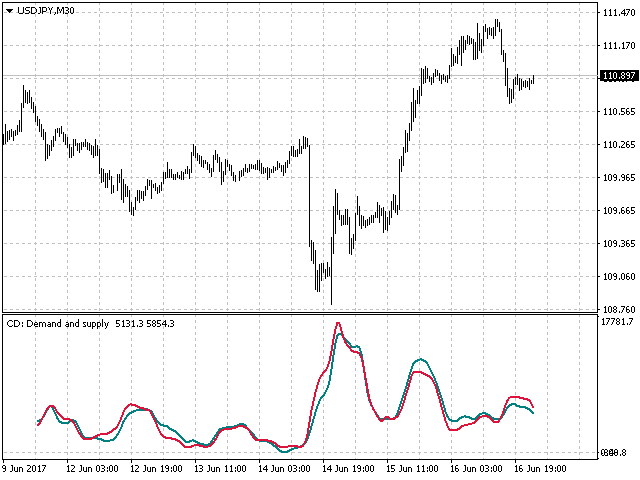
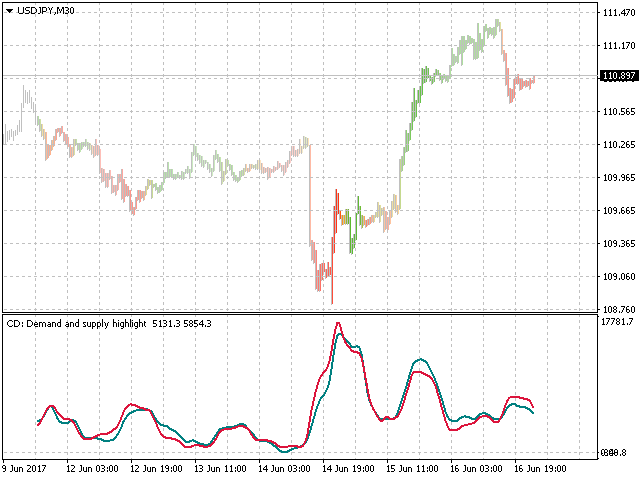
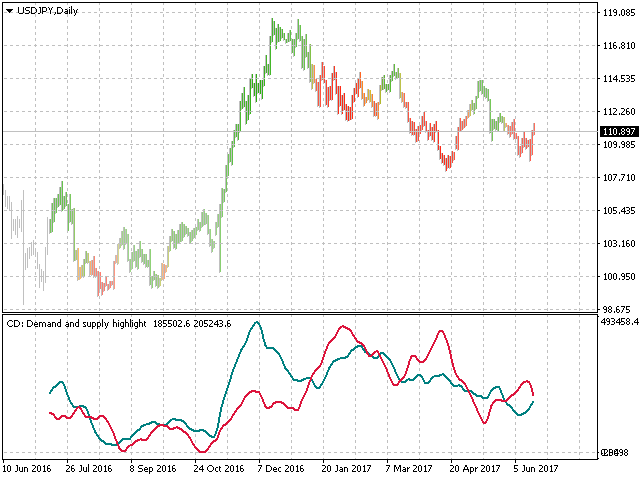
- DemandAndSupply - display the supply and demand diagram.
Full recalculation of data is performed once per minute, when a new candle opens on the M1 timeframe, or in case of a user activity, namely, when scrolling the chart deeper into the history, when changing the time scale of the chart or when changing the current timeframe.
By default, the initial reference point is the very first candle from the left border of the chart window. The reference point can be changed using the BarsLimit input variable.
In case the data on any of the periods required in calculations is missing, the indicator generates a corresponding message.


As you might know, Volume is the "missing link" to understand price action. Having this prepared in the way CD does it is invaluable to make decisions fast - and it helps. The indicator seems to be rock solid; I have 12-16 instances running per profile, in various configurations and with different pairs, changing is quick, adds only about 5 seconds for the entire profile on good ol' MT4. After migrating from an STP to ECN (different account, new install, copied data) the higher TF didn't show up. I've looked around in the forum, didn't find anything and send a message to Evgeny. While I was hoping to get an answer within 1-2 days, he replied within < 4 hours. THX, btw. Also, his reply was clever enough to help me SOLVE the issue right away. The description is basic but complete, and parameter names are self-explanatory and fun to work with. My issue would probably make a good FAQ item: The higher TF simply needed more M1 and M5 history (by scrolling on those TF a couple of months) - and I think I have even seen a note of this somewhere when I bought CD half a year ago. Anyway, highly recommend this - it's one of the good indicators, gets updated and you have full support. Bye | Buy now :))