• Обзор
  • Отзывы (6)
  • Обсуждение (11)
  • Что нового

Aggression On Bars

4.67

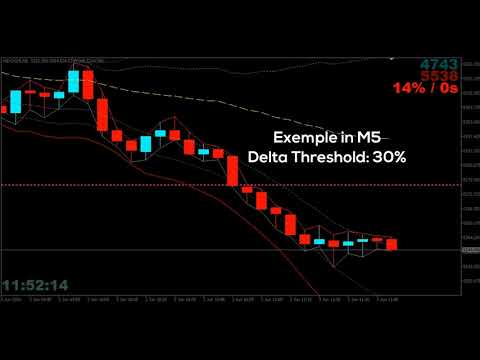
Imagine a Buy and Sell Pressure monitor on your chart that shows in REAL-TIME this data, bar by bar?

Well, imagine no more. We present you an exclusive creation of Minions Labs: Aggression On Bars indicator. On every new bar on you chart this indicator will start counting in real-time the BUY/SELL pressure and present this data statistics directly inside your chart. As soon as a new bar is created in your chart, the counter restarts. Simple and effective. Just watch the video to see it running live.

The only recommendation is that the Symbol being analyzed - and this is because of the nature of the market not the indicator itself - it should be Liquid, otherwise you will obviously be having wrong readings and whipsaws every time.

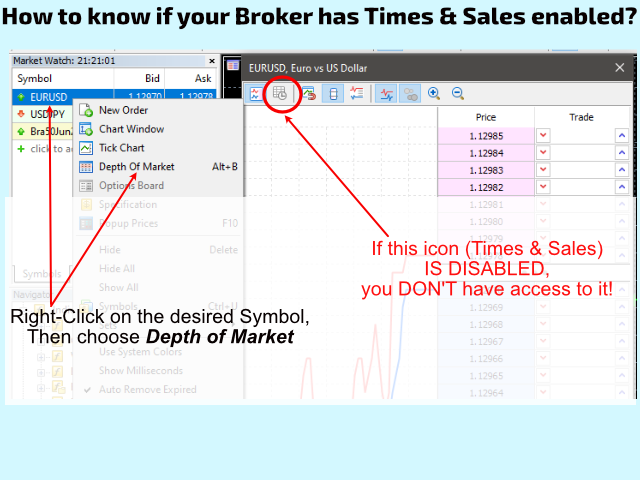
NOTE: If your Broker doesn't provide Times & Sales data this indicator WILL NOT work. Check the screenshots below to how identify if your Broker has Times & Sales (Times & Trades) enabled.


TRADING IDEAS

  • Safe entering on candlestick patterns.
  • Safe entering on Mean Reversions.
  • Safe entering on Counter-trend trading.
  • As a Confirmation Indicator

SETTINGS

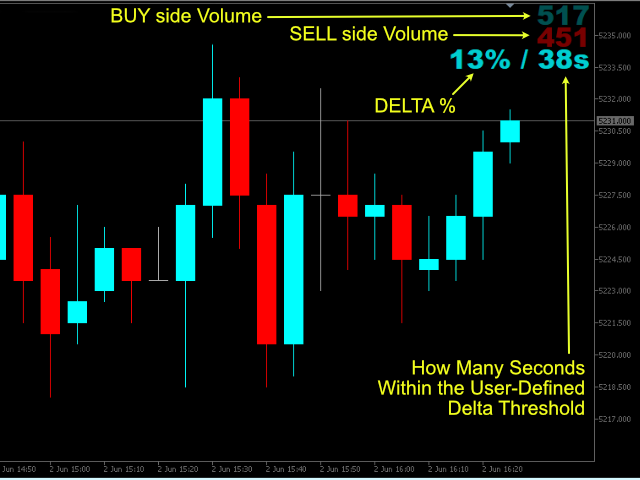
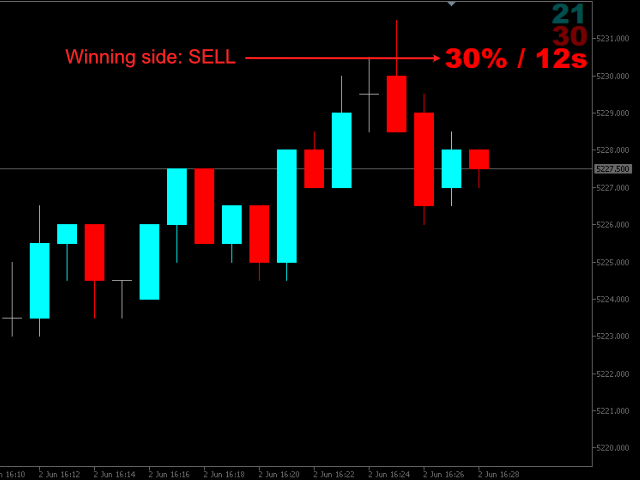
  • Delta percent (BUY versus SELL) to start the monitoring. The values are up to the trader according to his/her strategies, asset being traded, timeframe, time of the day, etc. There is NO right value. Threshold being hit, the timer starts counting how many seconds elapsed within the threshold chosen.
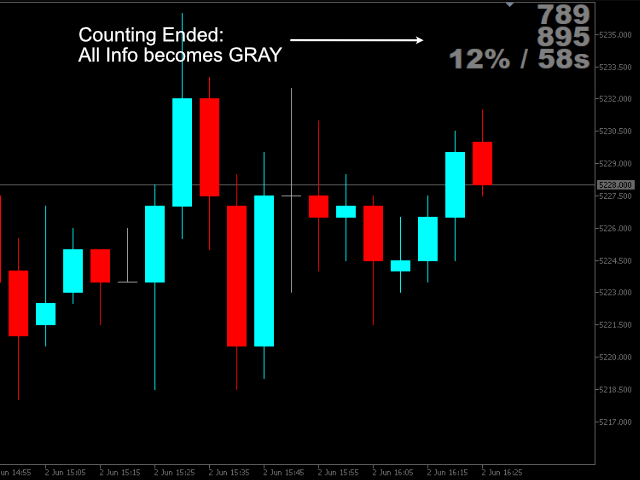
  • Time elapsed to stop the monitoring (when to stop counting the BUY/SELL data).
  • Do you want to force the counting stop/restart on every new Bar?
  • Volume Type to use in monitoring: Real Volume or Ticks.
  • Text Styles for the realtime monitor: Color for Buy/Sell/Idle/Winning sides.
  • Labels Positioning: X/Y offsets on chart, Font type and Font size.


Not sure if this indicator is for you? No problem, just try our DEMO version FREE of charge: Aggression on Bars DEMO

* Due to the new MQL5 policy developers cannot provide DEMO versions to the general public here in this website anymore.


EA FRIENDLY

Just call this indicator with iCustom() following the parameters list found on the last screenshot below. To read the values of the indicator use the following Buffers:
  • #0 = BUY Volume data
  • #1 = SELL Volume data
  • #2 = Delta between BUY and SELL (in %)
  • #3 = Is the Delta within the user defined threshold (1=YES / 0=NO)
  • #4 = Time elapsed within the threshold (in seconds)
  • #5 = Signals a BUY, when Delta reaches the threshold in buffer #3 - this buffer will contain the ASK price, otherwise, ZERO.
  • #6 = Signals a SELL, when Delta reaches the threshold in buffer #3 - this buffer will contain the BID price, otherwise, ZERO.

All buffers are set with ArraySetAsSeries() as TRUE, so the "zero" elements of the buffers are the data from the current/most recent bar.


Отзывы 6
Huynalvak de Sá Almeida
35
Huynalvak de Sá Almeida 2021.11.14 00:07 
 

Bom indicador... Parabéns !!!

marcus vasconcellos
102
marcus vasconcellos 2021.02.27 17:41 
 

Excelente, funciona tranquilo no mini indice e no mini dolar.

Thomas Hahn
117
Thomas Hahn 2020.06.15 09:08 
 

Idea is pretty good but doesn't work with my broker as you need to get special information submitted by him. Unfortunately I've it seen first after ordering :-(

Рекомендуем также
Trend Side - технический индикатор для определения тренда. Является комплектом из нескольких полноценных торговых стратегий. Индикатор использует продвинутую систему фильтрации тренда,  имеет статистическую панель, рассчитывает уровни для входа и выхода, рассчитывает динамический уровень Трейлинг Стопа. Подходит для любых типов символов, никогда не перерисовывает свои сигналы и результаты. Комплексный инструмент для профессиональной трендовой торговли. В комплект к индикатору Trend Side входит т
Версия MT4   |   FAQ Индикатор Owl Smart Levels – это полноценная торговая система внутри одного индикатора, которая включает в себя такие популярные инструменты анализа рынка как усовершенствованные фракталы Билла Вильямса , Valable ZigZag, который строит правильную волновую структуру рынка, а также  уровни Фибоначчи, которые   отмечают точные уровни входа в рынок и места взятия прибыли. Подробное описание стратегии Инструкция по работе с индикатором Советник-помошник в торговле Owl Helper При
KT Pin Bar MT5
KEENBASE SOFTWARE SOLUTIONS
KT Pin Bar identifies the pin bar formation which is a type of price action pattern which depicts a sign of reversal or rejection of the trend. When combined with support and resistance, BRN and other significant levels, Pin Bar pattern proved to be a very strong sign of reversal. Basically, a pin bar is characterized by a small body relative to the bar length which is closed either in upper or lower 50% part of its length. They have very large wicks and small candle body. A pin bar candlest
PipFinite Trend PRO MT5
Karlo Wilson Vendiola
4.87 (663)
Стратегия пробоя для торговли по тренду, фильтрация и все необходимые функции, встроенные в один инструмент! Интеллектуальный алгоритм индикатора Trend Pro с точностью определяет тренд, отфильтровывает рыночный шум и генерирует входные сигналы и уровни выхода. Новые функции с расширенными правилами статистического расчета улучшают общую производительность этого индикатора. Важная информация Для максимального использования потенциала Trend Pro прочитайте полное описание www.mql5.com/en/blogs/
Renko Gold
Ignacio Agustin Mene Franco
Renko Gold! clearly indicates the floors and ceilings where it goes from 4 lines, the line below that marks the floor in green confirming with the thinnest line clarifies the purchase entry, the same is for sale, the top line marks the ceiling and the thinnest red line marks the sale, This indicator works for all temporalities! For Forex and Synthetic Indices markets! It also works for crypto markets! Good profit! World Investor.
Do you, like me, like to trade with the trend? Then this indicator will help you! Rainbow Trend is a trend indicator, which uses several Moving Averages on the chart. It measures different trend strenght zones for different periods: very long term, long term, mid term, short term and very short term. Each zone has its color, and it is possible to have sound alert when the prices leaves a zone and enters another. Its configuration is very simple. If you find any bug or have any suggestions, co
After working during many months, with the help of Neural Networks, we have perfected the ultimate tool you are going to need for identifying key price levels (Supports and Resistances) and Supply and Demand zones. Perfectly suitable to trigger your trades, set up your future actions, decide your Take Profit and Stop Loss levels, and confirm the market direction. Price will always move between those levels, bouncing or breaking; from one zone to another, all the remaining movements are just mark
The Metatrader 5 has a hidden jewel called Chart Object, mostly unknown to the common users and hidden in a sub-menu within the platform. Called Mini Chart, this object is a miniature instance of a big/normal chart that could be added/attached to any normal chart, this way the Mini Chart will be bound to the main Chart in a very minimalist way saving a precious amount of real state on your screen. If you don't know the Mini Chart, give it a try - see the video and screenshots below. This is a gr
The  Basic Candlestick Patterns  is a Multi-Symbol and Multi-Timeframe scanner for identifying candlestick patterns. it displays your chosen patterns on the chart and helps you make trade decisions. The indicator has simple settings for coloring and alerts. You can also activate or deactivate the desired patterns, symbols and timeframes. Bullish Patterns Hammer Inverse hammer Bullish engulfing Morning star Three white soldiers Bearish Patterns Hanging man Shooting star Bearish engulfing Ev
Master OBV
Thalles Nascimento De Carvalho
Индикатор MasterOBV - мощный инструмент технического анализа, использующий объем, положительную корреляцию и скользящее среднее (MA) для улучшения идентификации трендов на финансовых рынках. Внедряя активы с положительной корреляцией через меню индикатора, MasterOBV предлагает изысканный подход к оценке силы и направления трендов. Включение скользящего среднего обеспечивает дополнительное сглаживание движений цен, помогая более точному отслеживанию основного тренда во времени. Учитывая не тол
Market Structure Patterns
Samuel Manoel De Souza
4.67 (18)
Market Structure Patterns is an indicator based on smart money concepts that displays almost all of the SMC/ICT elements needed to take your trading decisions to the next level. Take advantage of the alerts , push notifications and email messages to keep informed from when an element is formed on the chart, the price crosses a level and/or enters in a box/zone. Developers can access the values of the elements of the indicator using the global variables  what allows the automation of trading deci
Усовершенствованная Мультитаймфреймовая версия скользящей средней Хала (Hull Moving Average - HMA). Особенности Две линии индикатора Халла разных таймфреймов на одном графике. Линия HMA старшего таймфрейма определяет тренд, а линия HMA текущего таймфрейма - краткосрочные ценовые движения. Графическая панель с данными индикатора HMA на всех таймфреймах одновременно. Если на каком-либо таймфрейме HMA переключил свое направление, на панели отображается вопросительный или восклицательный знак с тек
Линии тренда являются наиболее важным инструментом технического анализа в торговле на рынке Форекс. К сожалению, большинство трейдеров рисуют их неправильно. Индикатор Automated Trendlines — это профессиональный инструмент для серьезных трейдеров, который поможет вам визуализировать трендовое движение рынков. Есть два типа линий тренда: бычьи линии тренда и медвежьи линии тренда. В восходящем тренде линия тренда Форекс проводится через самые низкие точки колебания ценового движения. Сое
Fractal 358 Plus is a predictive indicator that provides the clearest sight of price movements. Identifying graphic patterns such as Caixote (Crate), Pivot and Inside Candle , it shows entries and exits spots, as well as threats to your trades in the markets. It comes ready to use with B3 Mini Index (WIN$ series) and can be adjusted to use with any asset and timeframe. Fractal 358 unravels price movement Based on the Fibonacci sequence, Fractal 358 is a new and different way of reading and un
Индикатор Support & Resistance - это модификация стандартного индикатора Fractals Билла Вильямса. Индикатор работает на любых временных интервалах. Он отображает на графике уровни поддержки и сопротивления и позволяет установить уровни стоп-лосса и тейк-профита (их точные числовые значения вы можете узнать, наведя на уровни указатель мышки). Синие пунктирные линии - уровни поддержки. Красные пунктирные линии - уровни сопротивления. По желанию вы можете изменить вид и цвет этих линий. Если цена п
Индикатор Trend Line Map является дополнением к индикатору Trend Screener Indicator. Он работает как сканер всех сигналов, генерируемых скринером тренда (сигналы линии тренда). Это сканер линий тренда на основе индикатора Trend Screener. Если у вас нет индикатора Trend Screener Pro, программа Trend Line Map Pro работать не будет. It's a Trend Line Scanner based on Trend Screener Indicator. If you don't have Trend Screener Pro Indicator,     the Trend Line Map Pro will not work . Зайдя в н
A powerful oscillator that provide Buy and Sell signals by calculating the investor liquidity. The more liquidity the more buy possibilities. The less liquidity the more sell possibilities. Please download the demo and run a backtest! HOW IT WORKS: The oscillator will put buy and sell arrow on the chart in runtime only . Top value is 95 to 100 -> Investors are ready to buy and you should follow. Bottom value is 5 to 0 -> Investors are ready to sell and you should follow. Alert + sound will app
Индикатор паттерна 31 ("Длинный остров") из книги Томас Н. Булковский "Полная энциклопедия графических ценовых моделей". Второй гэп в обратном направлении. Параметры: Alerts - Включение алертов при появлении стрелки   Push - Отправка Push-уведомления при появлении стрелки (требуется настройка в терминале) GapSize - Минимальный размер гэпа в пунктах ArrowType - Значок: от 1 до 17 ArrowVShift - Сдвиг значков по вертикали в пунктах   ShowLevels - Показывать уровни ColUp - Цвет линий вверх ColDn
Форекс-индикатор спроса и предложения WAPV ADH является частью набора индикаторов, называемых (Wyckoff Academy Wave Market) Индикатор спроса и предложения Forex WAPV ADH для MT5 предназначен для определения выигрышной стороны между покупателями и продавцами. Его чтение очень простое: когда зеленая линия находится выше красной линии, управляется спрос, когда красная линия находится выше зеленой линии, управляется предложение. Чем больше положительных зеленых и красных линий, тем выше входная гром
The trend is your friend! Look at the color of the indicator and trade on that direction. It does not  repaint. After each candle is closed, that's the color of the trend. You can focus on shorter faster trends or major trends, just test what's most suitable for the symbol and timeframe you trade. Simply change the "Length" parameter and the indicator will automatically adapt. You can also change the color, thickness and style of the lines. Download and give it a try! There are big movements
Noize Absorption Index - is the manual trading system that measures the difference of pressure between bears forces and bulls forces. Green line - is a noize free index that showing curent situation. Zero value of index shows totally choppy/flat market.Values above zero level shows how powerfull bullish wave is and values below zero measures bearish forces.Up arrow appears on bearish market when it's ready to reverse, dn arrow appears on weak bullish market, as a result of reverse expectation.
In MetaTrader, plotting multiple   horizontal lines   and then tracking their respective price levels can be a hassle. This indicator automatically plots multiple horizontal lines at equal intervals for setting price alerts, plotting support and resistance levels, and other manual purposes. This indicator is suitable for Forex traders who are new and looking for chances to make quick profits from buying and selling. Horizontal lines can help traders find possible areas to start trading when the
SuperTrend MT5
KEENBASE SOFTWARE SOLUTIONS
KT SuperTrend is a modified version of the classic SuperTrend indicator with new useful features. Whether its Equities, Futures, and Forex, the beginners' traders widely use the Supertrend indicator.  Buy Signal: When price close above the supertrend line. Sell Signal: When price close below the supertrend line. Features A multi-featured SuperTrend coded from scratch. Equipped with a multi-timeframe scanner. The last signal direction and entry price showed on the chart. All kinds of MetaTra
This is the famous Sunflower indicator for Metatrader5. This indicator marks possible tops and bottoms on price charts. The indicator identifies tops and bottoms in the asset's price history, keep in mind that the current sunflower of the last candle repaints, as it is not possible to identify a top until the market reverses and it is also not possible to identify a bottom without the market stop falling and start rising. If you are looking for a professional programmer for Metatrader5, please
Индикатор Trend Detect сочетает в себе особенности как трендовых индикаторов, так и осцилляторов. Индикатор является удобным инструментом для выявления краткосрочных рыночных циклов и определения уровней перекупленности или перепроданности рынка. Длинную позицию можно открывать, когда индикатор начинает выходить из зоны перепроданности и пробивает нулевой уровень снизу вверх. Короткую позицию можно открывать, когда индикатор начинает выходить из зоны перекупленности и пробивает нулевой урове
Point Black
Ignacio Agustin Mene Franco
Black Card Pack indicator 5/1 point black It has the strategy of professional bollingers where each arrow gives you a different entry signal. It is used to operate in m1 and in d1 It is used for scalping and intraday, modified for forex markets ! suitable for all pairs modified for synthetic index markets suitable for all pairs! Ideal for volatility and jumps!
Индикатор автоматически рассчитывает и строит уровни поддержки и сопротивления Фибоначчи - один из самых эффективных инструментов для анализа рынка. Для расчёта используются усреднённые ценовые данные по выбранному периоду и таймфрейму. В качестве начала и окончания движения взят минимум и максимум за этот период. Уровни Фибоначчи позволяют увидеть потенциальные ориентиры, около которых движение цены может замедлиться или развернуться, то есть используются для прогнозирования дальнейшего движени
Volality Index scalper indicator  Meant for Volality pairs such as Volality 10, 25, 50, 75 and 100 The indicator works on all timeframes from the 1 minute to the monthly timeframe the indicator is non repaint the indicator has 3 entry settings 1 color change on zero cross 2 color change on slope change 3 color change on signal line cross Orange line is your sell signal Blue line is your buy signal.
"Support and Resistance" is a fundamental concept in technical analysis for trading stocks, currencies, or other assets in financial markets. Here's how to use it: Identifying Support Support is a price level where buying is strong. When the price drops to this level, there tends to be significant buying activity, preventing the price from falling further. Identifing Support: Look for the lowest points in a given period and find levels where the price has bounced back up multiple times. Usage:
Этот индикатор покажет вам значения TP и SL (в этой валюте), которые вы уже установили для каждого ордера на графиках (закрытые от линии транзакции/ордера), что очень поможет вам оценить вашу прибыль и убыток для каждого ордера. И он также показывает вам значения PIP. Показанный формат - «Валютные значения нашей прибыли или убытка / значений PIP». Значение TP будет отображаться зеленым цветом, а значение SL — красным. По любым вопросам или для получения дополнительной информации, пожалуйста,
С этим продуктом покупают
Представляем       Индикатор Quantum Trend Sniper   , инновационный индикатор MQL5, который меняет способ определения разворотов тренда и торговли ими! Разработан командой опытных трейдеров со стажем торговли более 13 лет,       Снайперский индикатор Quantum Trend       разработан, чтобы вывести ваше торговое путешествие на новые высоты благодаря инновационному способу определения разворотов тренда с чрезвычайно высокой точностью. ***Купите индикатор Quantum Trend Sniper и получите индикатор
First of all Its worth emphasizing here that this Trading System is Non-Repainting, Non-Redrawing and Non-Lagging Indicator, Which makes it ideal from both manual and robot trading.  The “Smart Trend Trading System MT5” is a comprehensive trading solution tailored for new and experienced traders. It combines over 10 premium indicators and features more than 7 robust trading strategies, making it a versatile choice for diverse market conditions. Trend Following Strategy: Provides precise entry an
First of all Its worth emphasizing here that this Trading Indicator is   Non-Repainting ,   Non-Redrawing   and   Non-Lagging   Indicator, Which makes it ideal from both manual and robot trading.  The Atomic Analyst  is a PA Price Action Indicator that uses Strength and Momentum of the price to find a better edge in the market. Equipped with an AI filter which help remove noises and false signals, and Increase Trading Potential. Using Multiple layers of complex Indicators, the Atomic Analyst
Раскройте силу торговли трендами с помощью индикатора Trend Screener: вашего идеального решения для торговли трендами, основанного на нечеткой логике и мультивалютной системе! Повысьте уровень своей торговли по тренду с помощью Trend Screener, революционного индикатора тренда, основанного на нечеткой логике. Это мощный индикатор отслеживания тренда, который сочетает в себе более 13 инструментов и функций премиум-класса и 3 торговые стратегии, что делает его универсальным выбором для превращения
Сейчас 147 долл. США (увеличиваясь до 499 долл. США после нескольких обновлений) - неограниченные учетные записи (ПК или Mac) Руководство пользователя + Обучающие видео + Доступ к приватному Discord-каналу + VIP-статус и мобильная версия + Лицензия на 5 ПК с неограниченным количеством аккаунтов и терминалов MT4. Сколько раз вы покупали индикатор торговли с замечательными обратными тестами, доказательствами производительности на живых счетах и зашикарными цифрами и статистикой, но после испо
First of all Its worth emphasizing here that this Trading Tool is Non-Repainting, Non-Redrawing and Non-Lagging Indicator, Which makes it ideal for professional trading. The Smart Price Action Concepts Indicator is a very powerful tool for both new and experienced traders. It packs more than 20 useful indicators into one, combining advanced trading ideas like Inner Circle Trader Analysis and Smart Money Concepts Trading Strategies. This indicator focuses on Smart Money Concepts, providing i
Топовый индикатор МТ5, дающий сигналы для входа в сделки без перерисовки! Идеальные точки входа в сделки для  валют, крипты, металлов, акций, индексов !  Смотрите  видео  (6:22) с примером отработки всего одного сигнала, окупившего индикатор. Версия индикатора для MT4 Преимущества индикатора Сигналы на вход без перерисовки Если сигнал появился, он никуда НЕ исчезает! В отличие от индикаторов с перерисовкой, которые ведут к потере депозита, потому что могут показать сигнал, а потом убрать его.
Получайте ежедневную информацию о рынке с подробностями и скриншотами через наш утренний брифинг здесь, на mql5 , и в Telegram ! FX Power MT5 NG - это новое поколение нашего популярного измерителя силы валют FX Power. Что же предлагает этот измеритель силы нового поколения? Все, что вы любили в оригинальном FX Power ПЛЮС Анализ силы GOLD/XAU Еще более точные результаты расчетов Индивидуально настраиваемые периоды анализа Настраиваемый предел расчета для еще более высокой производительности Спец
FX Volume MT5
Daniel Stein
4.94 (16)
Получайте ежедневную информацию о рынке с подробностями и скриншотами в нашем утреннем брифинге здесь, на mql5 , и в Telegram ! FX Volume - это ПЕРВЫЙ и ЕДИНСТВЕННЫЙ индикатор объема, который дает РЕАЛЬНОЕ представление о настроении рынка с точки зрения брокера. Он дает потрясающее представление о том, как институциональные участники рынка, такие как брокеры, позиционируют себя на рынке Forex, гораздо быстрее, чем отчеты COT. Видеть эту информацию прямо на своем графике - это настоящий геймчей
Станьте Breaker Trader и получайте прибыль от изменений структуры рынка по мере изменения цены. Индикатор выключателя блока ордеров определяет, когда тренд или движение цены приближаются к истощению и готовы развернуться. Он предупреждает вас об изменениях в структуре рынка, которые обычно происходят, когда произойдет разворот или серьезный откат. Индикатор использует собственный расчет, который определяет прорывы и ценовой импульс. Каждый раз, когда новый максимум формируется около возможн
Step into the realm of Forex trading with confidence and precision using XQ, a cutting-edge Forex indicator designed to elevate your trading game to unprecedented heights. Whether you're a seasoned trader or just stepping into the world of currency exchange, XQ Forex Indicator empowers you with the insights and signals needed to make informed trading decisions. The signal conditions are a combination of three indicators, and XQ Forex Indicator only display  medium and long-term trends . The ind
TPSpro TRENDPRO   —  трендовый индикатор, который автоматически анализирует рынок и предоставляет информацию о тренде и каждой его смене а также дающий сигналы для входа в сделки без перерисовки! Индикатор использует каждую свечу, анализируя их отдельно. относя к разным импульсам – импульс вверх или вниз. Точные точки входа в сделки  для  валют, крипты, металлов, акций, индексов! - Чтобы максимально раскрыть потенциал этого индикатора, прочтите полное описание -   https://www.mql5.com/ru/blogs
AW Trend Predictor MT5
AW Trading Software Limited
4.76 (54)
Сочетание тренда и пробоя уровней в одной системе. Продвинутый алгоритм индикатора фильтрует рыночный шум, определяет тренд, точки входа, а также возможные уровни выхода из позиции. Сигналы индикатора записываются в статистический модуль, который позволяет выбирать наиболее подходящие инструменты, показывая эффективность истории сигналов. Индикатор рассчитывает отметки ТейкПрофитов и стоплосса. Руководство пользователя ->  ЗДЕСЬ  / MT4 версия ->  ЗДЕСЬ Как торговать с индикатором: Торговля с Tr
40% СКИДКА НА РОЖДЕСТВО! ПОВЫШЕНИЕ ЦЕНЫ ДО $250 С 1 ЯНВАРЯ! Представляем GoldenGate Entries: Революционное Торговое Решение! Откройте для себя революционный подход к торговле с GoldenGate Entries (GGE), передовым индикатором, разработанным для повышения вашего опыта торговли. GGE предоставляет обширный набор функций, чтобы предоставить пользователям точность и уверенность в их торговых решениях. Пары: Любые (валюты - товары - акции - акции - криптовалюты) Таймфреймы: 15 минут до H1 Ос
IX Power , наконец, предлагает непревзойденную точность FX Power для нефорексных символов. Он точно определяет интенсивность краткосрочных, среднесрочных и долгосрочных трендов в ваших любимых индексах, акциях, товарах, ETF и даже криптовалютах. Вы можете   анализировать все, что   может предложить ваш терминал. Попробуйте и почувствуйте, как   значительно улучшается ваш тайминг   при торговле. Ключевые особенности IX Power 100% точные результаты расчетов без перерисовки - для всех торгов
Лучшее решение для новичка или трейдера-эксперта! Этот индикатор является уникальным, высококачественным и доступным торговым инструментом, поскольку мы включили в него ряд собственных функций и новую формулу. С помощью всего лишь ОДНОГО графика вы можете определить силу валюты для 28 пар Форекс! Представьте, как улучшится ваша торговля, потому что вы сможете точно определить точку запуска нового тренда или возможность скальпирования? Руководство пользователя:   нажмите здесь Это первый,
IVISTscalp5
Vadym Zhukovskyi
5 (2)
Представляем вам индикатор iVISTscalp 5 , который не только уникален, но и эффективен в использовании при анализе торговых операциях. Этот индикатор основывается на временных данных и является результатом многолетнего опыта и глубокого анализа финансовых рынков. Индикатор iVISTscalp 5 отличный помощник для ручной торговли. Удобство, простота и визуализация. Все самое сложное спрятано внутри. Мы максимум упростили настройки и использование индикатора iVISTscalp 5 . Индикатор подходит для всех
note: this indicator is for METATRADER4, if you want the version for METATRADER5 this is the link:  https://www.mql5.com/it/market/product/108106 TRENDMAESTRO recognizes a new TREND in the bud, he never makes mistakes. The certainty of identifying a new TREND is priceless. DESCRIPTION TRENDMAESTRO identifies a new TREND in the bud, this indicator examines the volatility, volumes and momentum to identify the moment in which there is an explosion of one or more of these data and therefore the mome
ICT, SMC, SMART MONEY CONCEPTS, SMART MONEY, Smart Money Concept, Support and Resistance, Trend Analysis, Price Action, Market Structure, Order Blocks, BOS/CHoCH,   Breaker Blocks ,  Momentum Shift,   Supply&Demand Zone/Order Blocks , Strong Imbalance,   HH/LL/HL/LH,    Fair Value Gap, FVG,  Premium  &   Discount   Zones, Fibonacci Retracement, OTE, Buy Side Liquidity, Sell Side Liquidity, BSL/SSL Taken, Equal Highs & Lows, MTF Dashboard, Multiple Time Frame, BigBar, HTF OB, HTF Market Structure
Профессиональный Инструмент для Скальпинга на Deriv Внимание! Индикатор будет продан в ограниченном количестве!!! Описание: Этот торговый индикатор предназначен для профессиональных трейдеров, ориентированных на скальпинг. Разработанный с учетом особенностей рынка, он предоставляет высокоточные сигналы для торговли в сторону спайков. Работает на таймфрейме М1 и поддерживает следующие символы: Boom 300 Index, Boom 500 Index, Boom 1000 Index, Crash 300 Index, Crash 500 Index, Crash 1000 Index
Устали от построения линий поддержки и сопротивления? Сопротивление поддержки - это мульти-таймфреймовый индикатор, который автоматически обнаруживает и отображает линии поддержки и сопротивления на графике с очень интересным поворотом: поскольку ценовые уровни тестируются с течением времени и его важность возрастает, линии становятся более толстыми и темными. [ Руководство по установке | Руководство по обновлению | Устранение неполадок | FAQ | Все продукты ] Повысьте технический анализ в одноч
Индикатор Supply Demand использует предыдущее ценовое действие для выявления потенциального дисбаланса между покупателями и продавцами. Ключевым является определение зон с лучшими возможностями, а не просто вероятностей. Индикатор Blahtech Supply Demand обеспечивает функционал, не доступный ни в одной платформе. Этот индикатор 4 в 1 не только выделяет зоны с более высокой вероятностью на основе механизма оценки силы по множественным критериям, но также комбинирует его с мульти-таймфреймовым ана
Представляем       Quantum Breakout PRO   , новаторский индикатор MQL5, который меняет ваш способ торговли в зонах прорыва! Разработан командой опытных трейдеров со стажем торговли более 13 лет,       Квантовый прорыв PRO       разработан, чтобы поднять ваше торговое путешествие к новым высотам с его инновационной и динамичной стратегией зоны прорыва. Quantum Breakout Indicator покажет вам сигнальные стрелки на зонах прорыва с 5 целевыми зонами прибыли и предложением стоп-лосса на основе по
Auto Order Block with break of structure based on ICT and Smart Money Concepts Futures Break of Structure ( BoS )             Order block ( OB )            Higher time frame Order block / Point of Interest ( POI )    shown on current chart           Fair value Gap ( FVG ) / Imbalance   ,  MTF      ( Multi Time Frame )    Volume Imbalance     ,  MTF          vIMB Gap’s Equal High / Low’s     ,  MTF             EQH / EQL Liquidity               Current Day High / Low           HOD /
Скринер поддержки и сопротивления находится в одном индикаторе уровня для MetaTrader, который предоставляет несколько инструментов внутри одного индикатора. Доступные инструменты: 1. Скринер структуры рынка. 2. Зона бычьего отката. 3. Зона медвежьего отката. 4. Ежедневные опорные точки 5. еженедельные опорные точки 6. ежемесячные опорные точки 7. Сильные поддержка и сопротивление, основанные на гармоническом паттерне и объеме. 8. Зоны уровня берега. ПРЕДЛОЖЕНИЕ ОГРАНИЧЕННОЕ ВРЕМЯ: Индикатор подд
Лучшее решение для новичка или трейдера-эксперта! Этот индикатор является уникальным, высококачественным и доступным торговым инструментом, поскольку мы включили в него ряд собственных функций и секретную формулу. Всего на ОДНОМ графике он выдает алерты по всем 28 валютным парам. Представьте, как улучшится ваша торговля, ведь вы сможете точно определить точку запуска нового тренда или возможность скальпирования! Построенный на новых базовых алгоритмах, он позволяет еще проще определять и по
Индикатор разворота ADR сразу показывает, где в настоящее время торгуется цена относительно своего нормального среднего дневного диапазона. Вы будете получать мгновенные оповещения через всплывающие окна, электронную почту или push-уведомления, когда цена превышает свой средний диапазон и уровни выше него по вашему выбору, чтобы вы могли быстро переходить к откатам и разворотам. Индикатор рисует на графике горизонтальные линии на экстремумах среднего дневного диапазона, а также расширения выше
Was: $259 Now: $120 — The Volume by Price Indicator for MetaTrader 5 features Volume Profile and Market Profile TPO (Time Price Opportunity). Get valuable insights out of currencies, equities and commodities data. Gain an edge trading financial markets. Volume and TPO histogram bar and line charts. Volume Footprint charts. TPO letter and block marker charts including split structures. Versatile segmentation and compositing methods. Static, dynamic and flexible ranges with relative and/or absolu
Представляем   Quantum Heiken Ashi PRO Свечи Heiken Ashi, разработанные для обеспечения четкого понимания рыночных тенденций, известны своей способностью отфильтровывать шум и устранять ложные сигналы. Попрощайтесь со сбивающими с толку колебаниями цен и познакомьтесь с более плавным и надежным представлением графиков. Что делает Quantum Heiken Ashi PRO действительно уникальным, так это его инновационная формула, которая преобразует данные традиционных свечей в легко читаемые цветные столбцы. Кр
ICT, SMC, Smart Money Concept, Support and Resistance, Trend Analysis, Price Action, Market Structure, Order Blocks, Breaker Blocks, Momentum Shift, Strong Imbalance, HH/LL/HL/LH, Fair Value Gap, FVG, Premium & Discount Zones, Fibonacci Retracement, OTE, Buyside Liquidity, Sellside Liquidity, Liquidity Voids, Market Sessions,Market Time, NDOG, NWOG,Silver Bullet,ict template На финансовом рынке точный анализ рынка критически важен для инвесторов. Чтобы помочь инвесторам лучше понять тенденции
Другие продукты этого автора
Mini POC
Flavio Javier Jarabeck
4.74 (23)
For those who struggle with overbloated Volume Profile/Market Profile indicators, here is a solution that contains only the Point of Control (POC) information. Super-fast and reliable, the Mini POC indicator presents this vital information visually within your chart. Totally customizable in splittable timeframes, type of Volume, calculation method, and how many days back you need. SETTINGS Timeframe to split the POCs within the day. Volume type to use: Ticks or Real Volume. Calculation method
FREE
Economic Markers
Flavio Javier Jarabeck
4.93 (15)
Easily get all relevant economic events of the current day right into your chart, as markers. Filter what kind of markers do you want: by country (selected individually) and by Importance (High relevance, Medium, Low or any combination of these). Configure the visual cues to your liking. If there is more than one event set to the very same time, their Names will be stacked and you will see the messages merged with the plus (+) sign on the marker. Obviously that long or too much events on the sam
FREE
Tabajara V5
Flavio Javier Jarabeck
4.86 (37)
Metatrader 5 version of the famous Andre Machado's Tabajara indicator. If you don't know Andre Machado's Technical Analysis work you don't need this indicator... For those who need it and for those several friend traders who asked this porting from other platforms, here it is... FEATURES 8-period Moving Average 20-period Moving Average 50-period Moving Average 200-period Moving Average Colored candles according to the inflexion of the 20-period MA SETTINGS You can change the Period of all M
FREE
Are you tired of drawing Support & Resistance levels for your Quotes? Are you learning how to spot Support & Resistances? No matter what is your case, Auto Support & Resistances will draw those levels for you! AND, it can draw them from other timeframes, right into you current chart, no matter what timeframe you are using... You can also Agglutinate regions/zones that are too much closer to each other and turning them into one single Support & Resistance Level. All configurable. SETTINGS Time
FREE
Closing Price Reversal
Flavio Javier Jarabeck
5 (9)
Closing Price Reversal is a very well known and traded candlestick pattern. This little indicator paints with specific (user-selected) colors the Closing Price Reveral Up and Down patterns, as well as the Inside Bars (as a bonus). Higher timeframes are more effective  as with all other candlesticks patterns. Do NOT trade solely on this indicator. Search the web for "Closing Price Reversal" to learn about the several approaches that can be used with this pattern. One of them is combining short/me
FREE
Weis Waves
Flavio Javier Jarabeck
3.24 (25)
The original author is David Weis, an expert in the Wyckoff Method. The Weis Wave is a modern adaptation of the 1930's Wyckoff Method, another expert in Tape Reading techniques and Chart Analysis. Weis Waves takes market volume and stacks it into waves according to price conditions giving the trader valuable insights about the market conditions. If you want to learn more about this subject you can find tons of videos in YouTube. Just look for "The Wickoff Method", "Weis Wave" and "Volume Spread
FREE
Big Player Candles
Flavio Javier Jarabeck
4.75 (28)
If you heard about The Wyckoff Method, Volume Spread Analysis, etc... You are probably searching for the candlestick indicator that shows you the Volume spread all over the current bar, signaling every types of market status... You can control the several Market Levels with custom colors... It is up to you to decide how to use it. Our job is provide you with the indicator... If you like this indicator, all I am asking is a little Review (not a Comment, but a REVIEW! )...    This will mean A
FREE
Inside Bar Radar
Flavio Javier Jarabeck
4.6 (5)
The Inside Bar pattern is a very well known candlestick formation used widely by traders all over the world and in any marketplace. This approach is very simple and adds a little confirmation candle, so it adds a third past candlestick to the count to confirm the direction of the move (upward or downward). Obviously, there is no power on this candlestick formation if the trader has no context on what it is happening on the market he/she is operating, so this is not magic, this "radar" is only a
FREE
Aggression Volume
Flavio Javier Jarabeck
3.8 (20)
Aggression Volume Indicator is the kind of indicator that is rarely found in the MQL5 community because it is not based on the standard Volume data provided by the Metatrader 5 platform. It requires the scrutiny of all traffic Ticks requested on the platform... That said, Aggression Volume indicator requests all Tick Data from your Broker and processes it to build a very special version of a Volume Indicator, where Buyers and Sellers aggressions are plotted in a form of Histogram. Additionally,
FREE
MIDAS Super VWAP
Flavio Javier Jarabeck
4.23 (13)
Imagine VWAP, MVWAP and MIDAS in one place... Well, you found it! Now you can track the movement of Big Players in various ways, as they in general pursue the benchmarks related to this measuring, gauging if they had good execution or poor execution on their orders. Traders and analysts use the VWAP to eliminate the noise that occurs throughout the day, so they can measure what prices buyers and sellers are really trading. VWAP gives traders insight into how a stock trades for that day and deter
FREE
Symbol Watermark
Flavio Javier Jarabeck
4.62 (13)
Another request from my brotherhood was putting the name of the Symbol being seen - a little bigger - on the Chart, just to get sure that they are seeing the correct one... Mistakes pay a high price on the market... It is a very effective, and almost resource-null-consuming indicator that displays the current Symbol Name and Timeframe in almost any position of your Chart, with any color, and any Font Size... And also you can change the divisor character that is presented between the Symbol Name
FREE
Price Momentum
Flavio Javier Jarabeck
4.92 (13)
Value Chart indicator presents the Price evolution in a new form. This indicator, Price Momentum , was developed taking all the calculations presented in the book " Dynamic Trading Indicators " by Mark W. Helweg and David Stendahl (2002). The technique involves de-trended Prices from a user-defined Period of analysis and the addition of a Volatility index correction. The result is an Oscillator with 3 zones: Fair Price Value, Overbought/Oversold and Extremely Overbought/Oversold zones. Adding th
FREE
Stackable VWAP
Flavio Javier Jarabeck
3.33 (6)
Volume Weighted Average Price (VWAP) is a trading benchmark commonly used by Big Players that gives the average price a Symbol has traded throughout the day. It is based on both Volume and price. Additionally we put in this indicator the MVWAP (Moving Volume Weighted Average Price). For those who do not know the usage and the importance od this indicator I recommend a great article about this subject at Investopedia ( https://www.investopedia.com/articles/trading/11/trading-with-vwap-mvwap.asp
FREE
Force Numbers
Flavio Javier Jarabeck
Several assets in several markets have the behavior of using specific numbers as Force Numbers, where support, resistance and price thrust is created. Let this indicator draw those levels of support and resistance for you. You can also stack it to show different level of Prices! This technique is being used by Tape Readers and Order Flow traders all over the world for a long time. Give it a try. Challenge yourself to study new ways of Price Action! SETTINGS What Price reference to use in th
FREE
Waves Sizer
Flavio Javier Jarabeck
4.2 (5)
Wyckoff fans, enjoy! Ideally to be used with the Weis Waves indicator, but it can be easily used alone, the Waves Sizer puts the range (in resulting Price movement) done by the Price on its market swings. You can control how accurate or loose will be the swings. This tool is very helpful for visually know how much the Price has traveled in your Timeframe. This way you can confront this level of effort with the resulting Volume, etc... Weis Waves indicator: https://www.mql5.com/en/market/pro
FREE
VWAP and MVWAP
Flavio Javier Jarabeck
4.17 (6)
Volume Weighted Average Price (VWAP) is a trading benchmark commonly used by Big Players that gives the average price a Symbol has traded throughout the day. It is based on both Volume and price. Additionally we put in this indicator the MVWAP (Moving Volume Weighted Average Price). For those who do not know the usage and the importance od this indicator I recommend a great article about this subject at Investopedia ( https://www.investopedia.com/articles/trading/11/trading-with-vwap-mvwap.asp )
FREE
Flux Diffuser
Flavio Javier Jarabeck
4.43 (7)
Based on Brazilian trader André Moraes' Difusor de Fluxo theory, the indicator is a more reliable version of the original MACD. It is a great confirmation indicator for Swing Trading and also can be used as a Day Trading tool. If you are not familiar with the concept or André's trading strategies, I strongly recommend his excelent book named "Se Afastando da Manada" in which he explains in detail how this indicator is used. Even if you don't know the Portuguese language it is not difficult to un
FREE
Candle Zones
Flavio Javier Jarabeck
5 (1)
You probably heard about Candlesticks behaviors, which in most of the times could denote and trace Volume behaviors even if you are not watching Volume itself... Well, this indicator will do this. Naked traders love to rely solely on candlesticks patterns and with Candle Zones you can trap special patterns and DRAW THEM on your chart. As simple as that. There are several filters you can tweak in order to achieve the analysis you want. Just give it a try. After several months of testing, we think
FREE
The traditional Money Flow Index indicator, this time, EA friendly . There are 3 buffers exposed that can be used by EAs to automatically analyze the Overbought and Oversold conditions of the quote. Just use the traditional iCustom() function to get these signals. This Money Flow Index calculation is based on the traditional Metaquote's MFI indicator. SETTINGS MFI Period Volume type to analyze (Real Volume or Ticks) Starting Overbought region Starting Oversold region USING WITH EAs Buffer
FREE
Market Momentum
Flavio Javier Jarabeck
3.86 (7)
The Market Momentum indicator is based on the Volume Zone Oscillator (VZO), presented by Waleed Aly Khalil in the 2009 edition of the International Federation of Technical Analysts journal, and presents a fresh view of this market valuable data that is oftenly misunderstood and neglected: VOLUME. With this new approach of "seeing" Volume data, traders can infer more properly market behavior and increase their odds in a winning trade. "The VZO is a leading volume oscillator; its basic usefulnes
FREE
Server Clock
Flavio Javier Jarabeck
4.89 (9)
Many friends asked me for a simple, non-obtrusive, resource-friendly clock to track the time during their trades. It seems pretty obvious, but it is a must-have for those trading the market manually, waiting for the Market News, or just to visually know what time it is... Trading is an absorbing endeavor! So, here it is... Totally configurable, including Font Type, Font Size and Chart Location: Upper Left/Center/Right OR Lower Left/Center/Right, with a little twist of adjusting the Offset, just
FREE
ATR Monitor
Flavio Javier Jarabeck
4.83 (6)
ATR is a measure of volatility introduced by market technician J. Welles Wilder Jr. in his book, "New Concepts in Technical Trading Systems". In general, traders are accustomed to seeing the ATR in the form of a sub-window indicator. What I am presenting here is a simplified version of ATR - just the current ATR number - very useful for monitoring just the very moment of the current chart. If you want to monitor several timeframes in the same chart, just add the ATR Monitor indicator several tim
FREE
Price Trail Chart
Flavio Javier Jarabeck
5 (3)
For those who hate candlesticks in lower timeframes (M1 through M15) we "invented" a clean new way to follow Price movement and displacement (volatility) called Price Trail Chart . The big "secret" is to get rid of those annoying candle wicks and draw the whole complete candle without them, this way we get a cleaner chart and a new view of the Price Path. No Open or Close markings, just LOW's and HIGH's, full body candle. Additionaly we inserted a Volume monitor from our Best Downloaded indicat
FREE
Time Spaced Moving Averages
Flavio Javier Jarabeck
4.67 (6)
The concept is simple: Plotting Price behavior within several periods of time. Some Symbols behave very well during the trading day - with this I mean Intraday trading - and this behavior ends up plotting effectively well with the proposed Exponential Moving Averages in this indicator... Obviously that this behavior could not be seen in all Symbols, but you can give it a try... Just drop this indicator in a chart and you will see for yourself... This indicator is intended for "Feeling the Trend
FREE
The Metatrader 5 has a hidden jewel called Chart Object, mostly unknown to the common users and hidden in a sub-menu within the platform. Called Mini Chart, this object is a miniature instance of a big/normal chart that could be added/attached to any normal chart, this way the Mini Chart will be bound to the main Chart in a very minimalist way saving a precious amount of real state on your screen. If you don't know the Mini Chart, give it a try - see the video and screenshots below. This is a gr
Economic Markers PRO
Flavio Javier Jarabeck
5 (1)
Easily get all relevant economic events of the current day right into your chart, as markers. Filter what kind of markers do you want: by country (selected individually) and by Importance (High relevance, Medium, Low or any combination of these). Configure the visual cues to your liking. Additionaly you have the ability to add up to 5 personal markers of your own agenda. With Alerts and/or with blackout periods, if you are using it within an Expert Advisor! All in one Economic Calendar indicator
The Market Momentum indicator is based on the Volume Zone Oscillator (VZO), presented by Waleed Aly Khalil in the 2009 edition of the International Federation of Technical Analysts journal, and presents a fresh view of this market valuable data that is oftenly misunderstood and neglected: VOLUME. With this new approach of "seeing" Volume data, traders can infer more properly market behavior and increase their odds in a winning trade. "The VZO is a leading volume oscillator; its basic usefulnes
ATR Monitor ATR is a measure of volatility introduced by market technician J. Welles Wilder Jr. in his book, "New Concepts in Technical Trading Systems". In general, traders are accustomed to seeing the ATR in the form of a sub-window indicator. What I am presenting here is a simplified version of ATR - just the current ATR number - very useful for monitoring just the very moment of the current chart. And, by default, this indicator will not show up on screen, you can just use the buffers thems
FREE
Arrows Cleaner
Flavio Javier Jarabeck
4.86 (7)
For those who use the Trading Arrows on the chart for later study, but use the Triple Screen approach and got all those arrows everywhere on all additional charts, here it is: Arrows Cleaner! Just drop it on the chart and leave it there. When needed, just with 1-click you get rid of all those annoying arrows... SETTINGS You can position the little Button on any corner of the chart. Additionally you can displace it with the Offset settings. You can enlarge or shrink its size, as well as the tex
FREE
Minions Labs' Candlestick Pattern Teller It shows on your chart the names of the famous Candlesticks Patterns formations as soon as they are created and confirmed. No repainting. That way beginners and also professional traders who have difficulties in visually identifying candlestick patterns will have their analysis in a much easier format. Did you know that in general there are 3 types of individuals: Visual, Auditory, and Kinesthetic? Don't be ashamed if you cannot easily recognize Candlest
Фильтр:
Huynalvak de Sá Almeida
35
Huynalvak de Sá Almeida 2021.11.14 00:07 
 

Bom indicador... Parabéns !!!

Flavio Javier Jarabeck
269902
Ответ разработчика Flavio Javier Jarabeck 2021.11.14 01:11
Obrigado pelas palavras de incentivo! Dá pra ter toneladas de ideias com esse indicador, não?
Um grande abraço!
;)
marcus vasconcellos
102
marcus vasconcellos 2021.02.27 17:41 
 

Excelente, funciona tranquilo no mini indice e no mini dolar.

ajlfigueira Tv
38
ajlfigueira Tv 2020.07.29 23:50 
 

quais corretoras ele funciona??

Flavio Javier Jarabeck
269902
Ответ разработчика Flavio Javier Jarabeck 2021.02.27 13:31
A maioria das Brasileiras, não posso citá-las pelas regras do Fórum...
Thomas Hahn
117
Thomas Hahn 2020.06.15 09:08 
 

Idea is pretty good but doesn't work with my broker as you need to get special information submitted by him. Unfortunately I've it seen first after ordering :-(

Douglas Silva
169
Douglas Silva 2020.06.11 01:34 
 

Пользователь не оставил комментарий к оценке

ricardomga
16
ricardomga 2020.06.05 23:23 
 

Пользователь не оставил комментарий к оценке

Ответ на отзыв
Версия 1.2 2020.10.05
:: Added 2 more buffers to signal EAs a BUY or SELL MODE...
Версия 1.1 2020.06.06
:: Recompiled (obligatory by Metaquotes as of June,05,2020) to the new MT5 version 2485. Please let me know if anything weird happens...