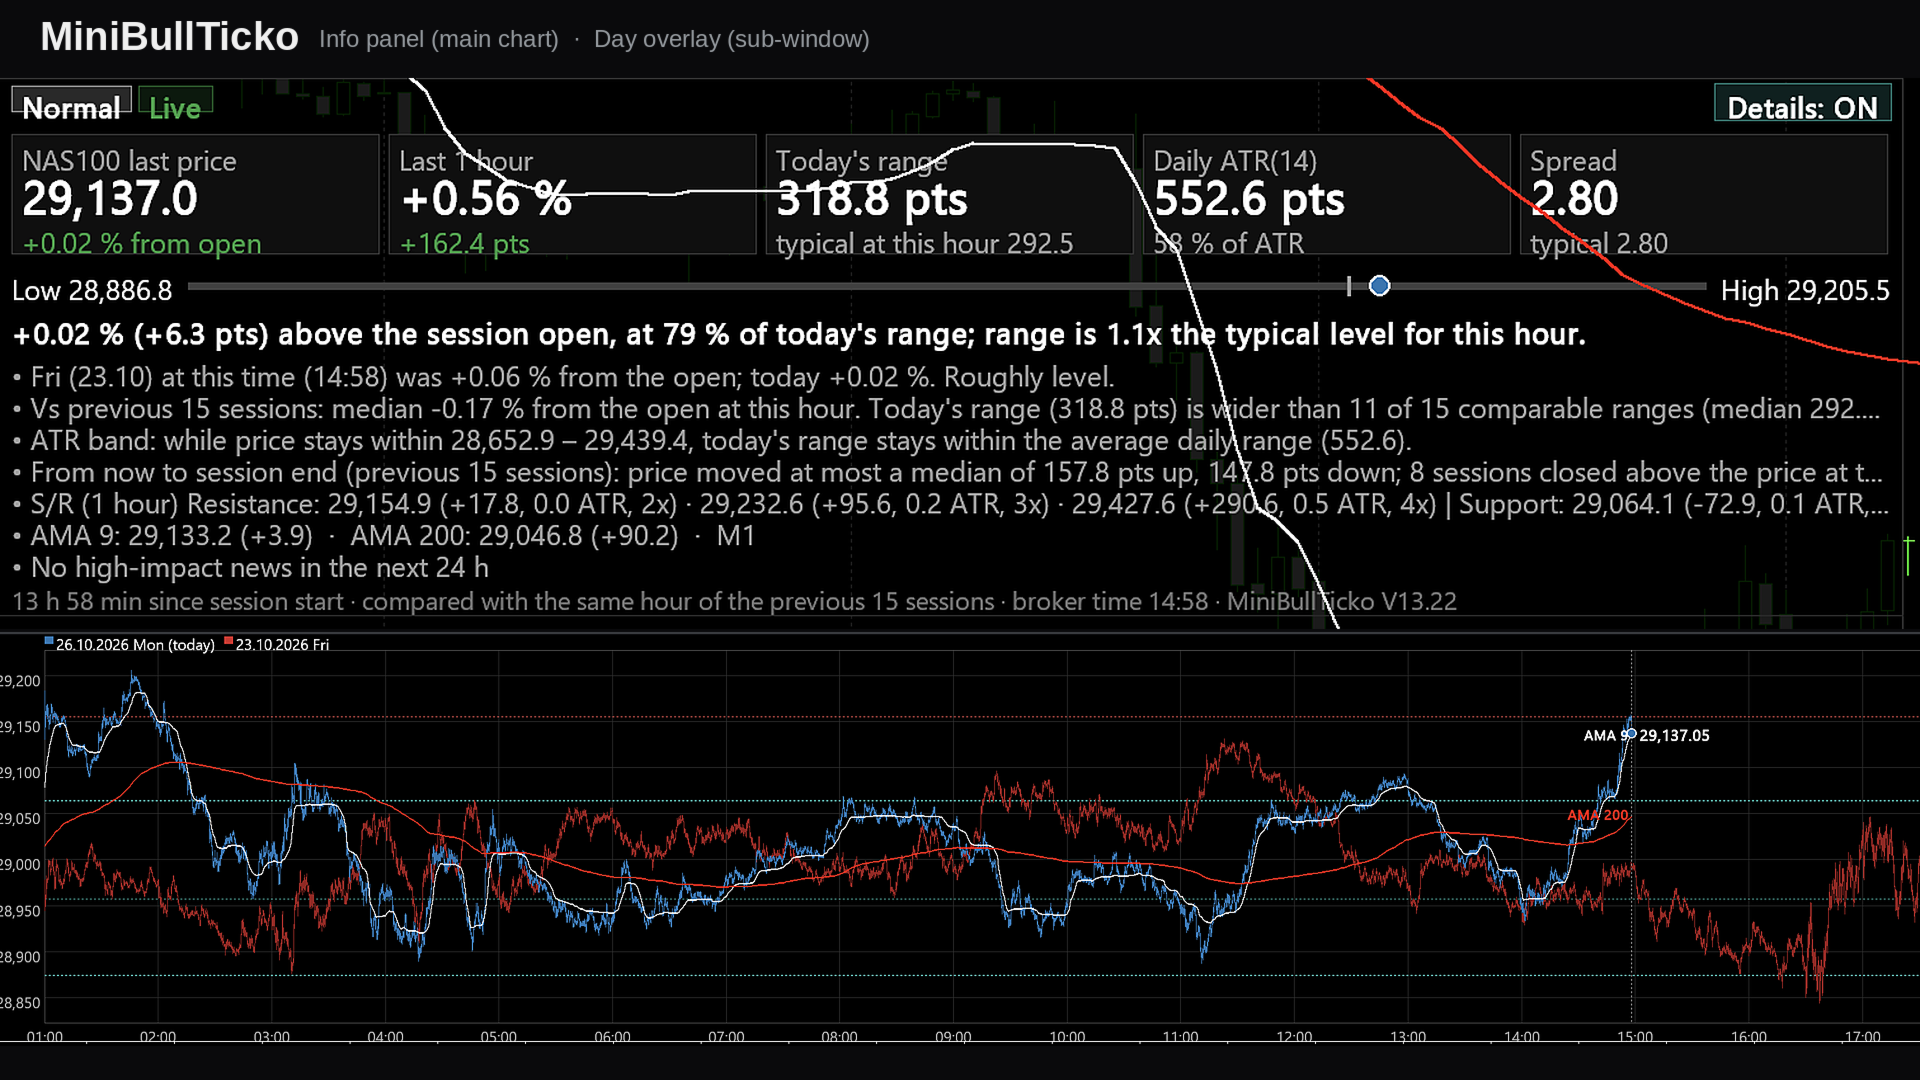
MiniBull Ticko

  • Индикаторы
  • Yusuf Levent Aksun
    Yusuf Levent Aksun
    Platform Engineer и сертифицированный специалист AWS с более чем 20-летним опытом
    в разработке программного обеспечения, облачной архитектуре и DevOps-трансформации.
    В настоящее время руковожу инициативами платформенной инженерии в World Wide Technology
  • Версия: 13.22
  • Обновлено: 26 октября 2026
  • Активации: 5

**Tick-level day overlay, live info panel and automatic Support/Resistance for MetaTrader 5 — built for scalpers.**

MiniBullTicko answers one question that matters to a short-term trader at any moment of the session:

> *"Is today behaving like a normal day **at this exact time of day**, or is something different — more volatile, more expensive to trade, or stretched against a known level?"*

It does this by laying every recent trading session on top of each other **at tick resolution** in an indicator sub-window, while a compact, semi-transparent panel on the main chart summarises the comparison in numbers and plain sentences.

---

## Contents

1. [Screenshots](#1-screenshots)
2. [Key features](#2-key-features)
3. [Requirements and installation](#3-requirements-and-installation)
4. [What you see on the screen](#4-what-you-see-on-the-screen)
5. [Input parameters](#5-input-parameters)
6. [How it works](#6-how-it-works)
7. [Metric and formula reference](#7-metric-and-formula-reference)
8. [A scalper's workflow](#8-a-scalpers-workflow)
9. [Performance notes](#9-performance-notes)
10. [Chart objects and global variables](#10-chart-objects-and-global-variables)
11. [Troubleshooting](#11-troubleshooting)
12. [Limitations and disclaimer](#12-limitations-and-disclaimer)

---

## 1. Screenshots

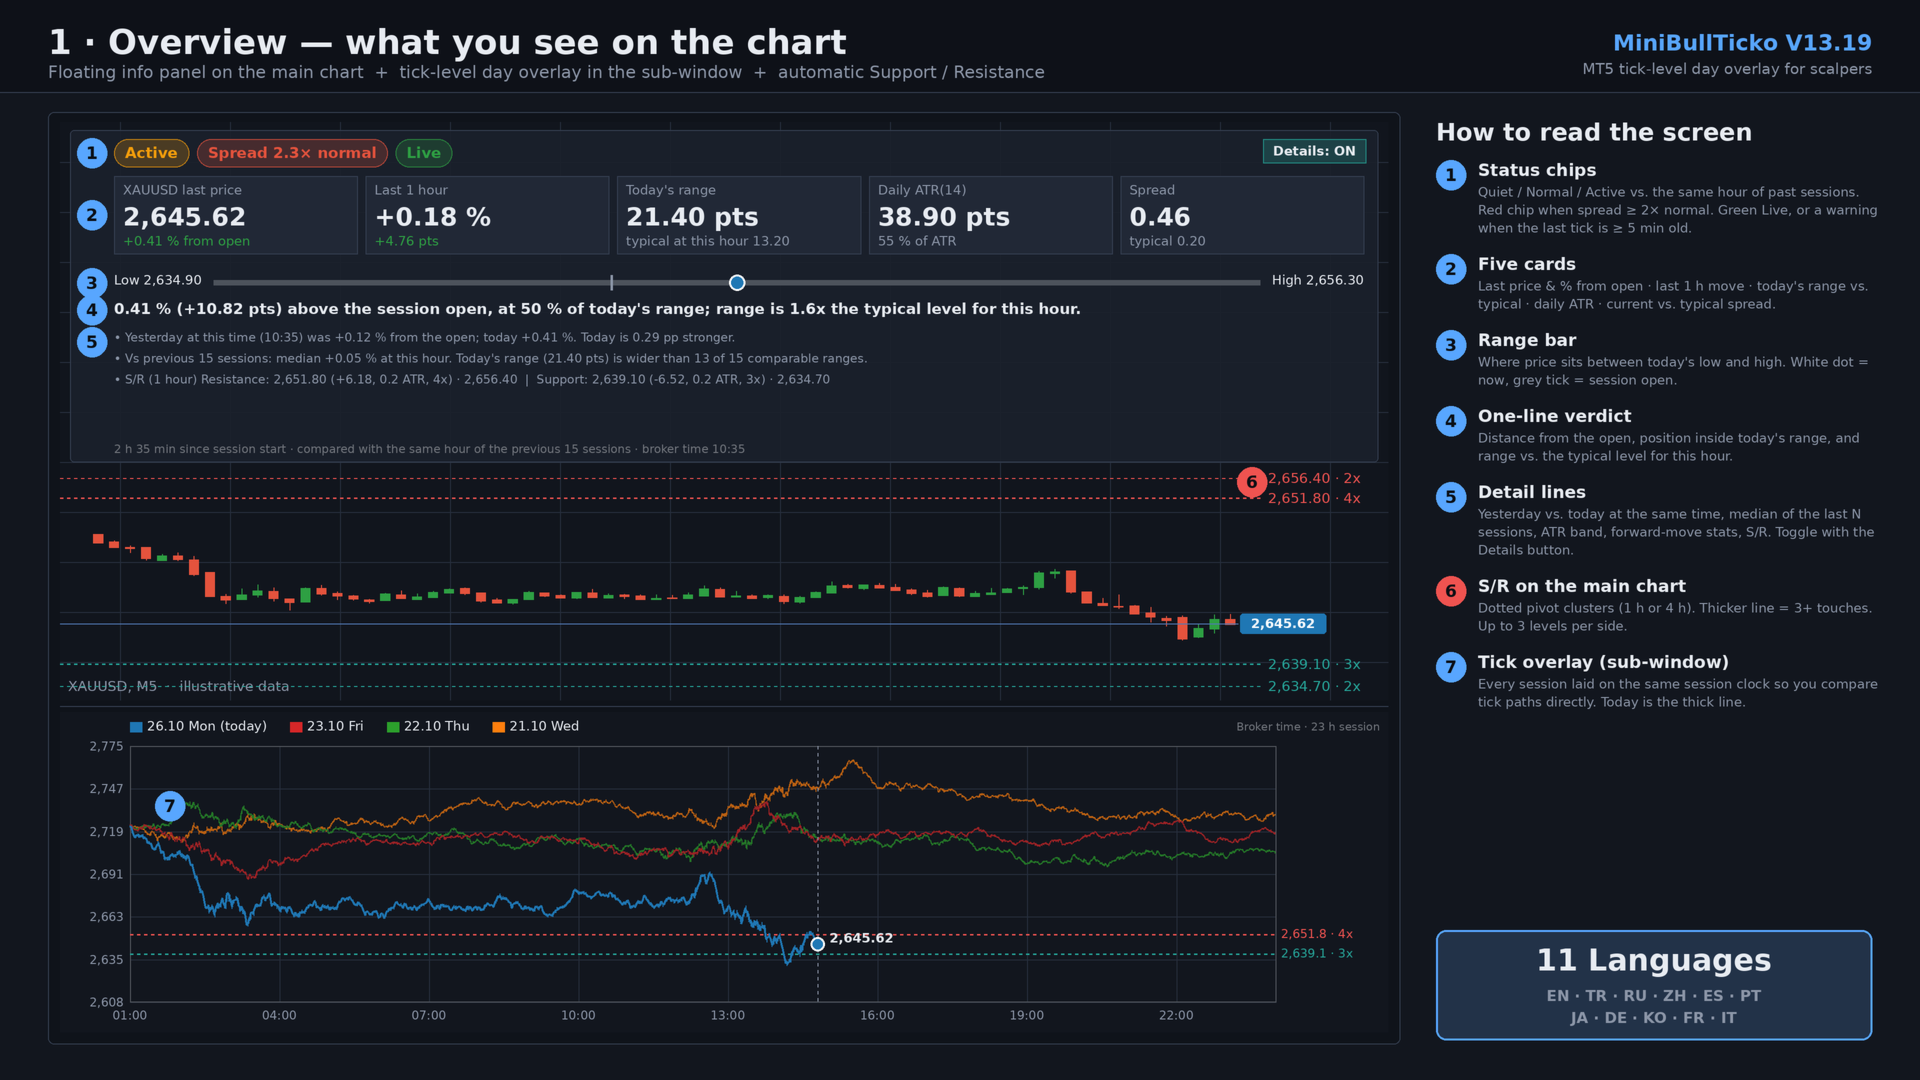
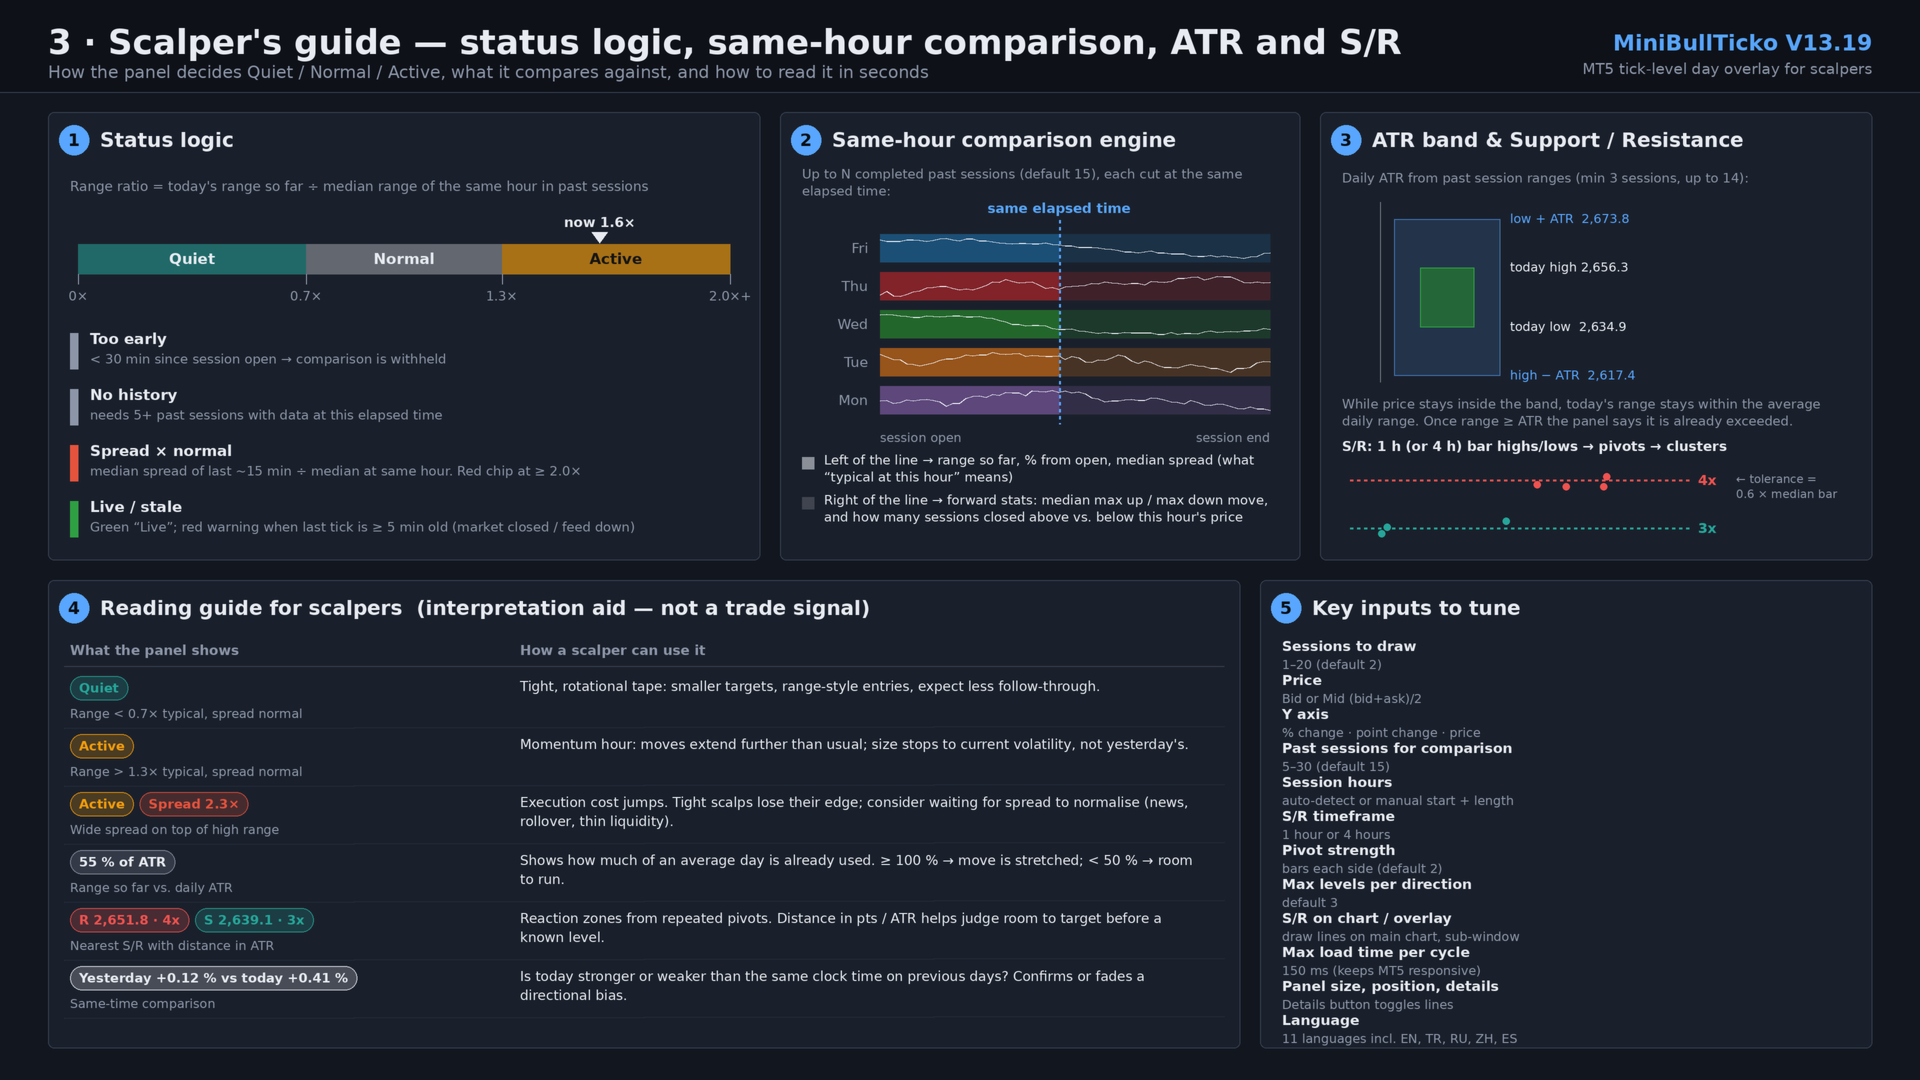
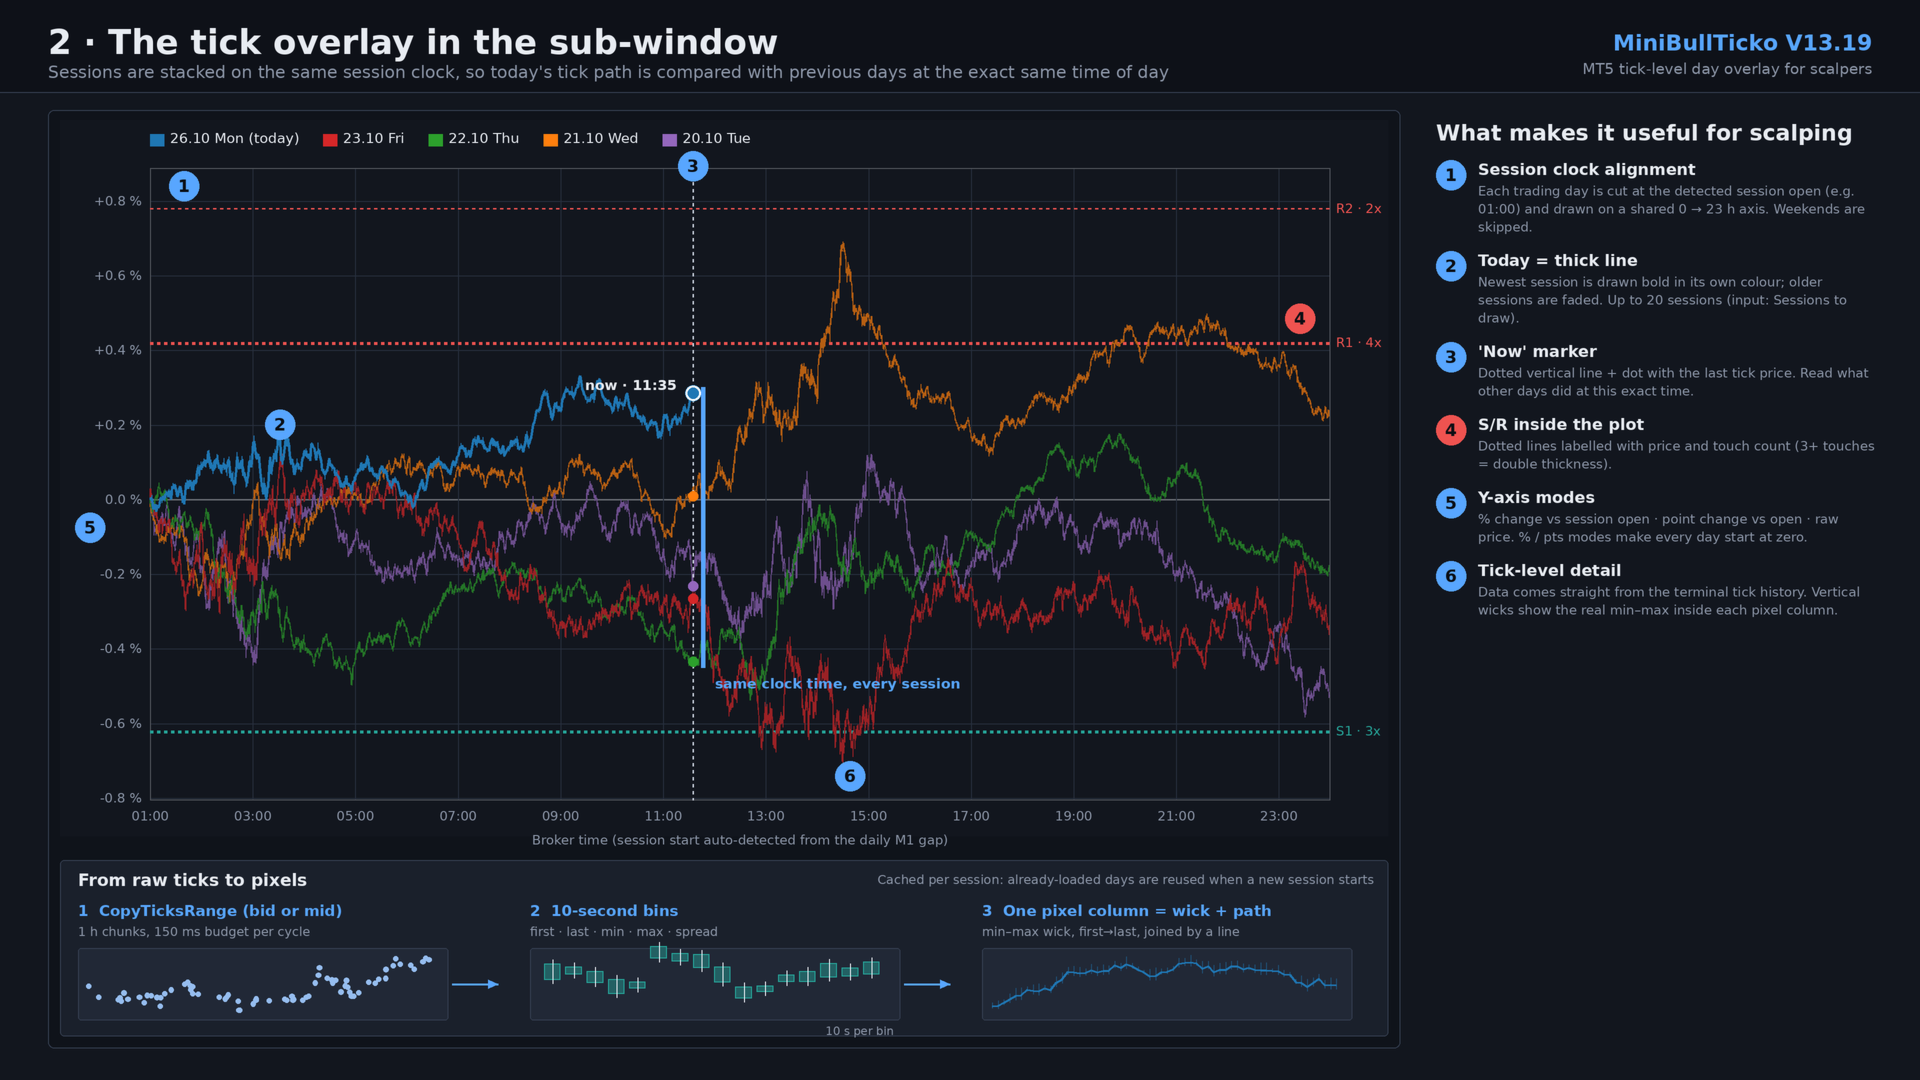
All images are 1920 × 1080 and use illustrative (synthetic) data.

| # | File | What it explains |
|---|------|------------------|
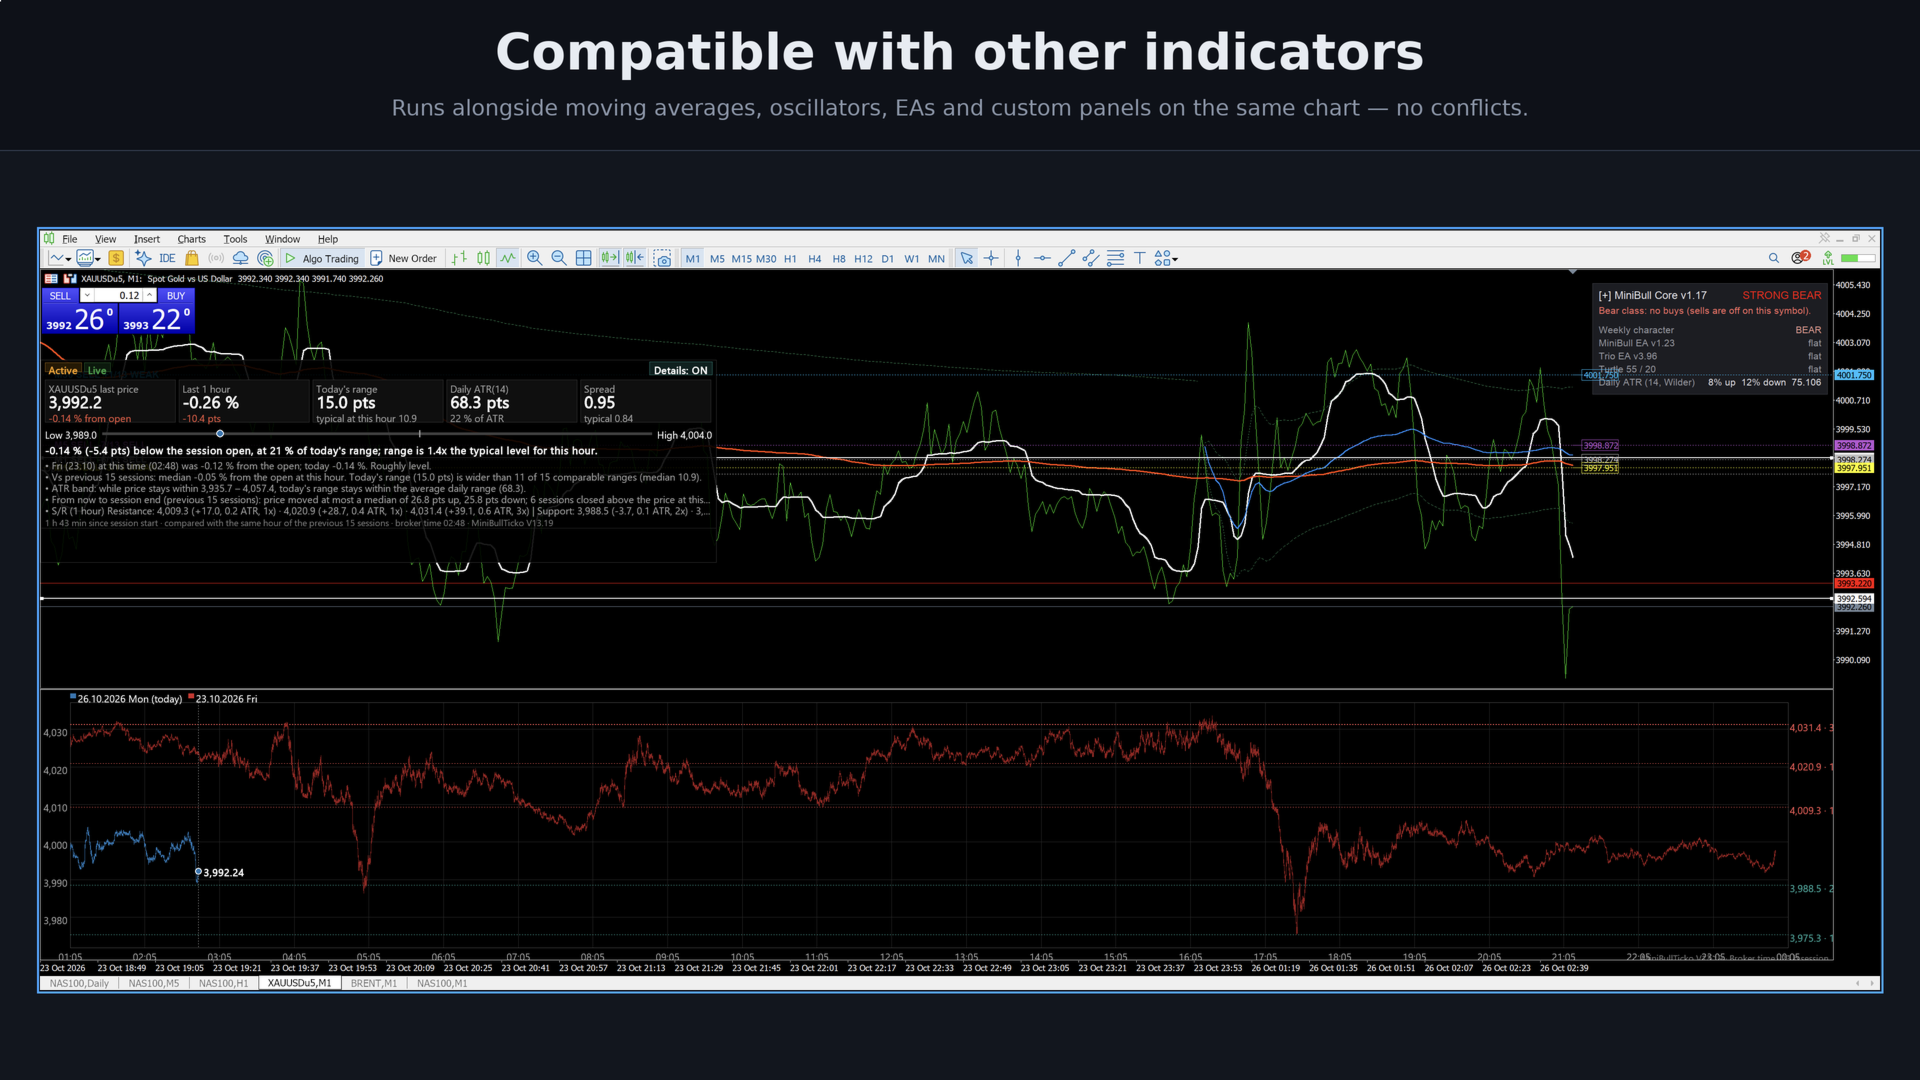
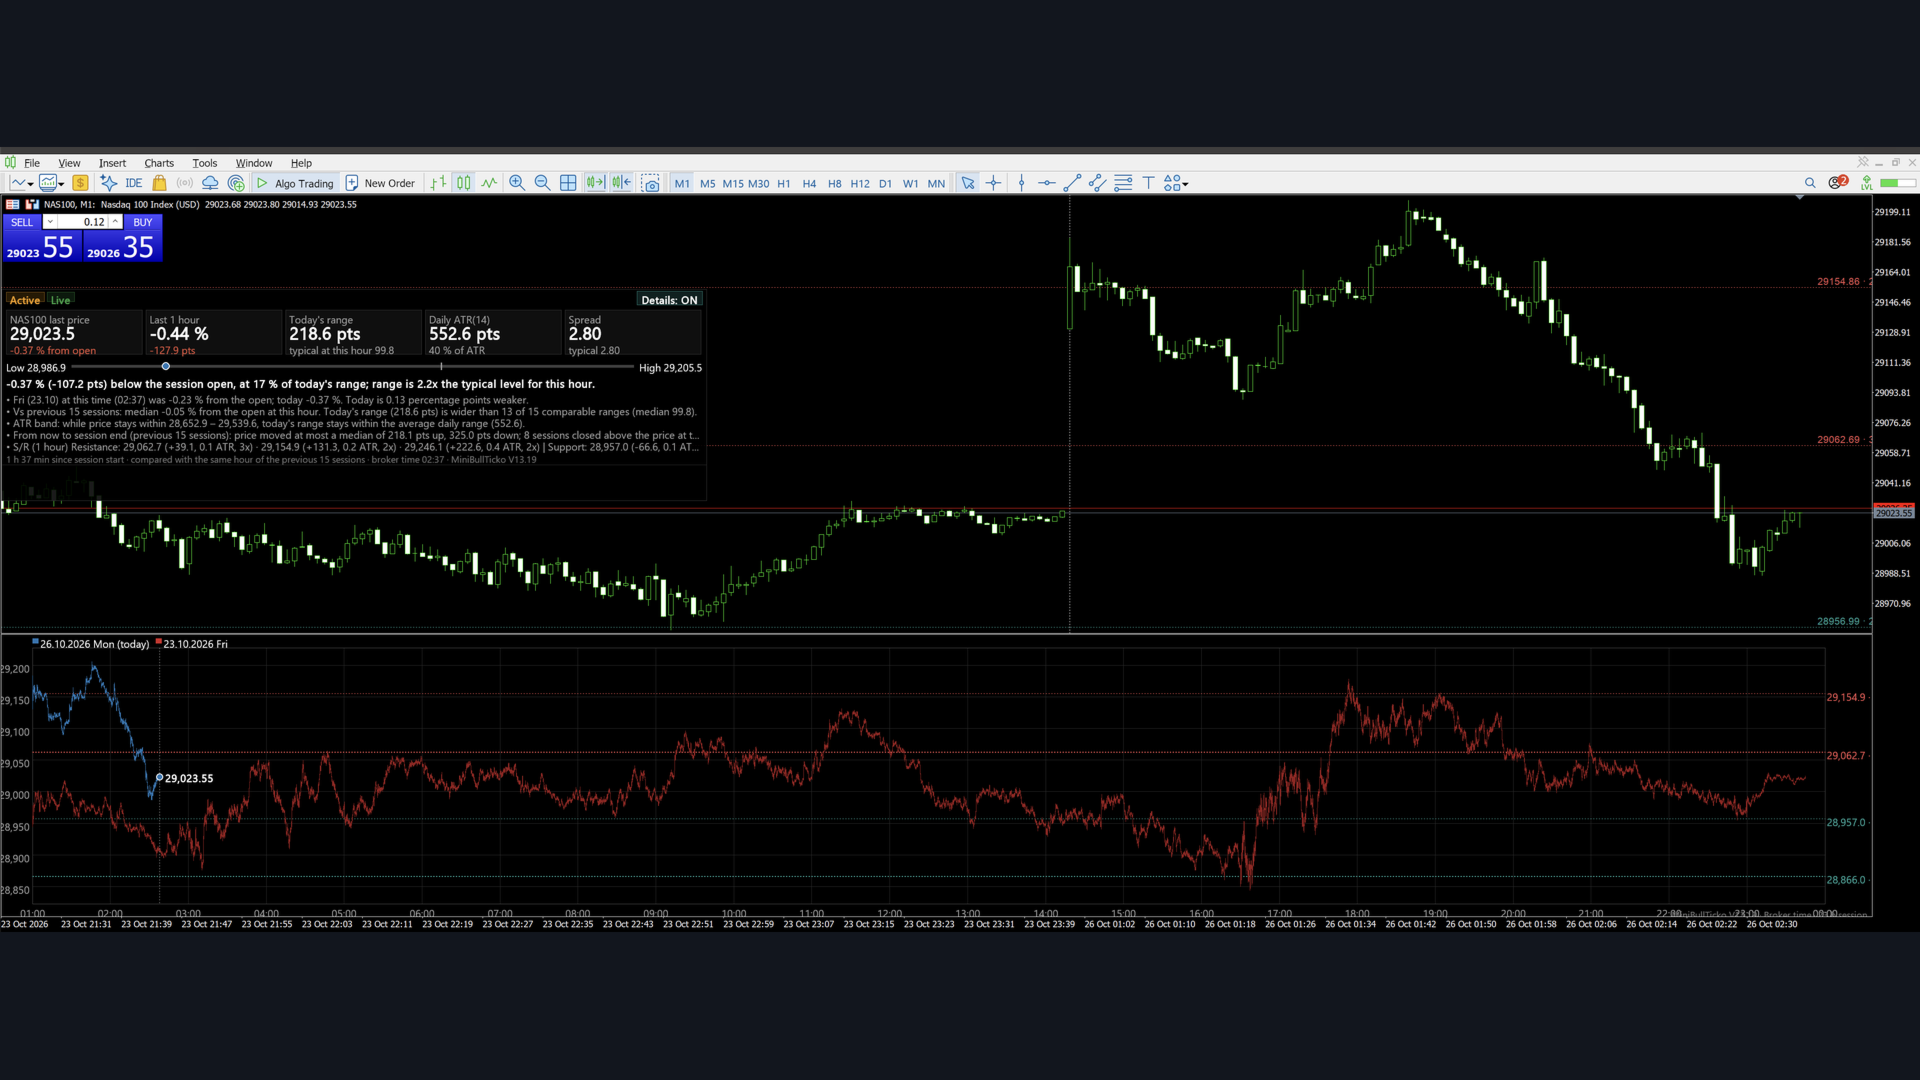
| 1 | `01_overview.png` | The whole screen: main-chart panel, S/R lines, tick overlay sub-window |
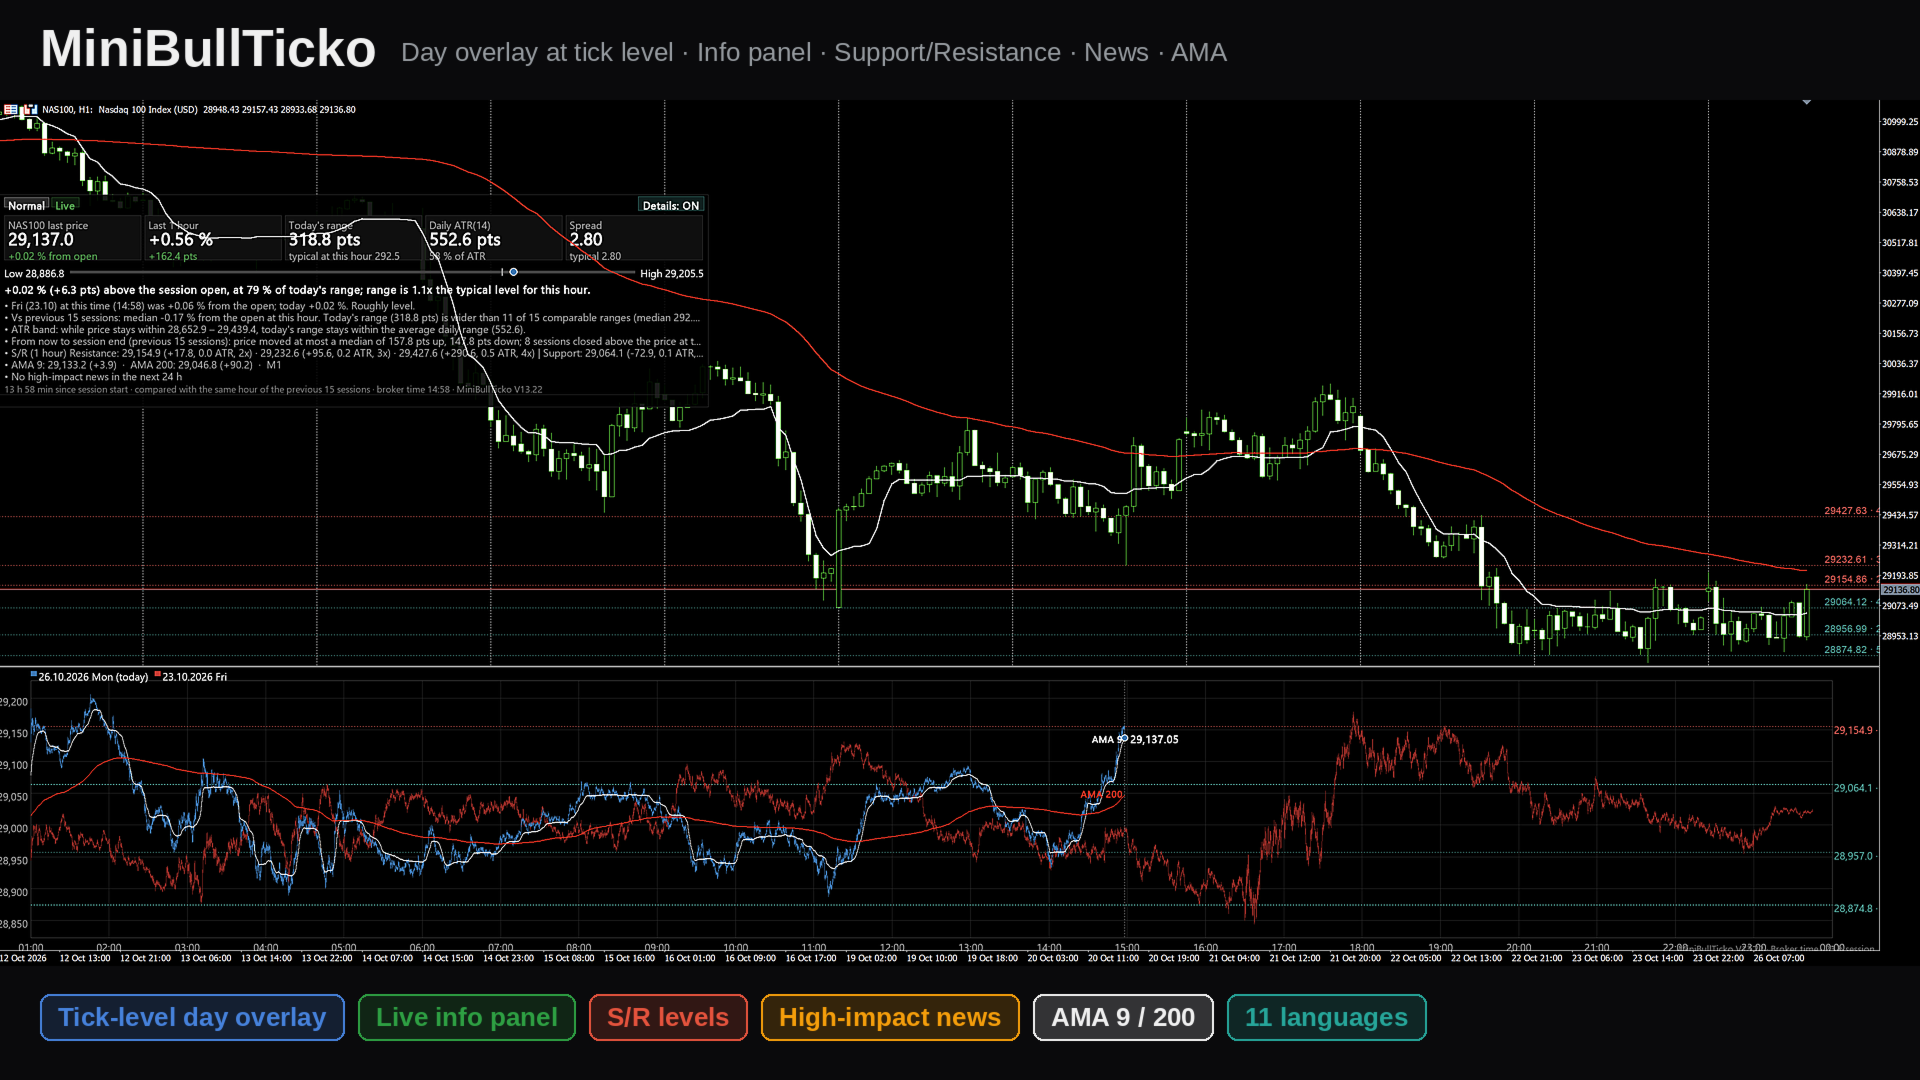
| 2 | `02_tick_overlay.png` | The sub-window in detail: session-clock alignment, "now" marker, tick → bin → pixel pipeline |
| 3 | `03_scalper_guide.png` | Status logic, same-hour comparison engine, ATR band, S/R clustering, reading guide, key inputs |

![Overview](01_overview.png)

![Tick overlay](02_tick_overlay.png)

![Scalper guide](03_scalper_guide.png)

---

## 2. Key features

- **Tick-level day overlay (sub-window).** Up to 20 sessions are drawn on one shared session clock. Today is a thick line; previous days are faded. Because each day is aligned to the *same time of day*, you compare like with like.
- **Real tick data, no external files.** Ticks are read straight from the terminal with `CopyTicksRange`. No tick-recorder EA and no CSV export/import are needed.
- **"Same hour" comparison panel (main chart).** Status chip (Quiet / Normal / Active), five metric cards, a range bar, a one-sentence verdict and optional detail lines — all computed against the same elapsed time in previous sessions.
- **Spread awareness.** Current spread (median of the last ~15 minutes) is compared with the typical spread at that hour. A red chip appears when it is 2× normal or worse.
- **Feed-health indicator.** "Live" in green, or a warning when the last tick is five minutes old or more.
- **Daily ATR in session terms.** ATR is built from the stored sessions' tick ranges, with an "ATR band" that shows where price must stay for today's range not to exceed the average.
- **Automatic Support / Resistance.** Pivot highs/lows from 1-hour or 4-hour bars (built from tick data) are clustered into levels with touch counts, drawn on the main chart and in the overlay, and listed in the panel with distance in points and in ATR.
- **Automatic session detection.** Session open and length are detected from gaps in M1 history, so it adapts to indices, metals, FX and futures-style CFDs. Manual override is available.
- **11 UI languages.** English, Türkçe, Русский, 中文, Español, Português, 日本語, Deutsch, 한국어, Français, Italiano.
- **Responsive loading.** Data loads in time-boxed slices so the terminal never freezes; already-loaded sessions are cached and reused.

---

## 3. Requirements and installation

**Requirements**

- MetaTrader 5 (build with `CCanvas` and `CopyTicksRange` support — any current build).
- Tick history for the symbol. The indicator needs ticks for roughly *N + 1* sessions (default: 16). If the terminal has not downloaded them yet, `CopyTicksRange` will trigger the download and the panel shows "Loading…" until it is done.
- M1 history for automatic session detection (about 9 days).

**Installation**

1. Save `MiniBullTicko_V13_19.mq5` to `MQL5\Indicators\` (File → Open Data Folder).
2. Open it in MetaEditor and compile (F7). The file is UTF-8 with BOM; if non-Latin characters look broken, re-save as *UTF-8 with BOM*.
3. In the terminal: **Insert → Indicators → Custom → MiniBullTicko_V13_19**. It opens in its own sub-window (`indicator_separate_window`, no plots).
4. The info panel appears on the **main chart** and S/R lines are placed on it automatically.

> Tip: use a chart timeframe you scalp on (M1–M5). The indicator itself is timeframe-independent — it works from ticks — but S/R lines are anchored to the chart and the panel sits on top of it.

---

## 4. What you see on the screen

### 4.1 Info panel (main chart)

A semi-transparent canvas (default 1500 × 450 px, 200 px from the top, 0 px from the left).

| Area | Content |
|------|---------|
| **Status chips** | Session state: *too early / not enough history / Quiet / Normal / Active*; a red *Spread N× normal* chip; *Live* or *Last tick N ago* warning (or *Not live · last tick …* when the session is over). |
| **Five cards** | 1) Last price and % from session open. 2) Last 1-hour change in % and points. 3) Today's range in points and the typical range at this hour. 4) Daily ATR(n) and today's range as % of ATR. 5) Current spread and typical spread. |
| **Range bar** | Today's low ↔ high. Grey tick = session open, white/blue dot = current price. |
| **Verdict sentence** | e.g. *"0.41 % (+10.82 pts) above the session open, at 50 % of today's range; range is 1.6x the typical level for this hour."* |
| **Detail lines** (toggle) | Previous session at the same time vs. today; median of the previous N sessions; ATR exceeded / ATR band; forward-looking stats; S/R list. |
| **Details button** | Top-right of the panel; click to turn the detail lines on/off. The choice is remembered. |
| **Caption** | Time since session start, number of sessions compared, broker time, version. |

### 4.2 Tick overlay (sub-window)

- **X axis:** the session clock in broker time (e.g. 01:00 → 00:00).
- **Y axis (selectable):** % change vs. session open, point change vs. session open, or raw price.
- **Lines:** every session is drawn per pixel column from its 10-second bins — a vertical min-max wick, plus a line joining first/last values — so the path keeps real intraday spikes.
- **Today:** thick line, full colour. **Older sessions:** faded.
- **"Now" marker:** dotted vertical line and a dot with the latest tick price.
- **S/R:** dotted horizontal lines with price and touch count on the right; double thickness at 3+ touches.
- **Legend:** date, weekday and "(today)" tag for each session; a "Loading… n/N" counter while data is still being fetched.

### 4.3 S/R on the main chart

Horizontal lines (`OBJ_HLINE`, dotted) with small text labels showing price and touch count. Resistance is red, support is teal. Tooltips show *Resistance/Support price · touches*.

---

## 5. Input parameters

### General

| Input | Default | Description |
|-------|---------|-------------|
| `InpLang` | English | UI language (11 options). |
| `InpFontName` | *(empty)* | Font name; empty = automatic per language. |
| `InpDays` | 2 | Sessions drawn in the overlay (1–20). |
| `InpPrice` | Bid | `Bid` or `Mid` = (bid + ask) / 2. |
| `InpYMode` | Price | Y axis: `% change`, `Point change`, or `Price`. |
| `InpWindowHeight` | 600 | Sub-window height in px (0 = leave unchanged). |
| `InpFont` | 13 | Base font size (px). |
| `InpFontScale` | 0.9 | Font multiplier — raise to 1.3 / 1.6 on high-DPI screens. |

### Session (broker time)

| Input | Default | Description |
|-------|---------|-------------|
| `InpAutoSession` | true | Detect session start/length automatically from M1 gaps. |
| `InpSessHour` / `InpSessMin` | 1 / 0 | Manual session start. |
| `InpSessLen` | 23 | Manual session length in hours. |

### Panel

| Input | Default | Description |
|-------|---------|-------------|
| `InpShowPanel` | true | Show the info panel on the main chart. |
| `InpPanelWidth` | 1500 | Panel width (px). |
| `InpPanelHeight` | 450 | Panel height (px); 0 = automatic, maximum 600. |
| `InpPanelX` / `InpPanelY` | 0 / 200 | Distance from the left / top of the chart. |
| `InpSpacing` | 1.3 | Line-spacing multiplier. |
| `InpShowDetails` | true | Initial state of the detail lines (the button overrides it afterwards). |
| `InpProfileDays` | 15 | Past sessions used for comparison (clamped to 5–30). |

### Support / Resistance

| Input | Default | Description |
|-------|---------|-------------|
| `InpShowSR` | true | Calculate S/R. |
| `InpSRTf` | 1 hour | Bar timeframe for pivots: 1 h or 4 h. |
| `InpSRPivotK` | 2 | Bars required on each side of a pivot. |
| `InpSRLevels` | 3 | Maximum levels per direction. |
| `InpSROnChart` | true | Draw S/R on the main chart. |
| `InpSROnOverlay` | true | Draw S/R inside the sub-window. |

### Performance

| Input | Default | Description |
|-------|---------|-------------|
| `InpBudgetMs` | 150 | Maximum tick-loading time per timer cycle (ms). |

---

## 6. How it works

### 6.1 Session detection

1. Reads about 9 days of M1 bar times.
2. Finds **gaps between consecutive M1 bars from 30 minutes to 10 hours** — the daily break.
3. Buckets the gap-end times into 5-minute slots over the clock and picks the most frequent slot as the **session start**.
4. Measures the time from that start to the last bar before the next break; the **median** (rounded up with a small tolerance) is the **session length** in hours (1–24).
5. If detection keeps failing (20 attempts), it falls back to the manual inputs.

Sessions are then built backwards day by day from the current session date. **Saturdays and Sundays are skipped.** A day with no ticks (holiday) is marked empty and ignored.

### 6.2 Tick loading

- A timer runs every **250 ms**.
- Each session is read in **1-hour chunks** with `CopyTicksRange(…, COPY_TICKS_ALL, …)`.
- Total loading time per cycle is capped by `InpBudgetMs`; the next cycle continues where it stopped.
- Up to 8 consecutive read failures are tolerated per session before it is treated as empty.
- The live session only reads up to the current server time and resumes from the last tick received.
- When a new session begins, existing session objects are **reused**, so the 15–20 previous days are not reloaded.

### 6.3 Binning

Each tick is reduced into a **10-second bin** of its session: first, last, min and max price (bid or mid) and the last observed spread (`ask − bid`). This keeps memory small (a 23-hour session = 8 280 bins) while preserving intrabar extremes.

### 6.4 Redrawing

- Redraw when new data arrived, at most every 300 ms; a forced refresh every 5 seconds.
- A new session start is checked every second.
- Two `CCanvas` layers are used: one in the sub-window (overlay) and one bitmap object on the main chart (panel, semi-transparent).

---

## 7. Metric and formula reference

All "typical at this hour" values compare today with **completed** previous sessions, each evaluated at the **same elapsed time since session open**.

| Metric | Definition |
|--------|------------|
| **% from open** | `last / first_tick_of_session − 1`, in %. |
| **Last 1 h** | `last / price_one_hour_ago − 1`; shown as "no full hour yet" before 1 h has elapsed. |
| **Today's range** | `session high − session low` so far. |
| **Typical range at this hour** | Median over past sessions of `(high − low)` from session open up to the same elapsed time. Requires ≥ 5 sessions with data at that time. |
| **Range ratio** | `today's range / typical range`. Shown only after the first 30 minutes. |
| **Status** | ratio < 0.7 → **Quiet**; 0.7 – 1.3 → **Normal**; > 1.3 → **Active**. |
| **Too early** | Fewer than 30 minutes since session open. |
| **Spread now** | Median of per-bin spreads over the last 90 bins (≈ 15 min). |
| **Typical spread** | Median over past sessions of the same ~15-minute median spread at that hour (needs ≥ 3 values). |
| **Spread × normal** | `spread now / typical spread`; the red chip appears at ≥ 2.0. |
| **Daily ATR(n)** | Average True Range of past sessions' (high, low, previous close); `n = min(14, sessions − 1)`; needs ≥ 3 past sessions. |
| **% of ATR** | `today's range / ATR × 100`. |
| **ATR band** | While price stays between `today_high − ATR` and `today_low + ATR`, today's range remains within the average daily range. If the range already exceeds ATR, the panel states so. |
| **Previous session line** | Previous session's % from open at this time vs. today's, with the difference in percentage points. |
| **Forward statistics** | From the same elapsed time to session end in past sessions: median maximum up-move, median maximum down-move, and how many closed above vs. below the price at that hour. Shown for the live session only (≥ 5 samples). |

### Support / Resistance algorithm

1. Build 1-hour (or 4-hour) high/low bars from the stored 10-second bins of the last `InpProfileDays + 1` sessions (at least 5 bars required).
2. A bar high/low is a **pivot** if it is the extreme within `InpSRPivotK` bars on each side.
3. Sort pivots and **cluster** neighbours whose distance from the running cluster mean is ≤ `0.6 × median bar range`.
4. Each cluster becomes a level at its **mean price**, with the **number of pivots** as its touch count.
5. Levels above the last price are **resistance** (nearest first), levels at or below are **support** (nearest first), up to `InpSRLevels` per side.
6. In the panel each level shows the distance in points and in ATR, and the touch count (e.g. `2,651.80 (+6.18, 0.2 ATR, 4x)`).

---

## 8. A scalper's workflow

> This is an interpretation aid, not a signal generator. Entries, exits and risk remain your decision.

1. **Glance at the chips.** *Quiet* means tight, rotational tape; *Active* means moves extend further than usual; a red *Spread N×* chip means execution is currently more expensive than normal.
2. **Check feed health.** Green *Live* — good. A "last tick N min ago" warning means the market is closed or the feed is down; ignore stale numbers.
3. **Compare with the same clock time.** In the sub-window, look where the thick line sits relative to the faded days at the dotted "now" line. In `% change` mode, every day starts at zero, so strength vs. weakness is immediate.
4. **Size your targets and stops to today's volatility.** Use the *typical range at this hour* and *% of ATR* cards: below ~50 % of ATR there is room to run; above 100 % the move is already stretched.
5. **Respect the levels.** The nearest resistance/support and their distance in ATR show how much room exists before a level that has been touched repeatedly.
6. **Watch spread before scalping tight.** If spread is ≥ 2× normal (news, rollover, thin liquidity), tight targets can lose their edge.
7. **Use the detail lines** (button on the panel) when you want the written comparison; switch them off to keep the chart clean.

Suggested starting configurations:

| Style | Suggestion |
|-------|-----------|
| Pure scalping, one chart | `InpDays` = 2–3, `InpYMode` = % change, `InpSRTf` = 1 h |
| Intraday context | `InpDays` = 5–8, `InpSRTf` = 4 h, `InpProfileDays` = 20 |
| Small screen | Smaller `InpPanelWidth` / `InpPanelHeight`, details OFF, `InpWindowHeight` ≈ 400 |
| High-DPI display | `InpFontScale` = 1.3–1.6 |

---

## 9. Performance notes

- The first start on a new symbol can take a while: the terminal may need to download tick history for ~16 sessions. The overlay appears first; the panel fills in as completed sessions arrive (counter "Loading… n/N").
- Loading is time-boxed (`InpBudgetMs`), so the terminal remains responsive. Lower it on slow machines; raise it to load faster on strong ones.
- Memory per session is small (≈ 8 k bins × 5 arrays); 20 sessions are comfortably handled.
- Canvas redraws are throttled (300 ms minimum interval).

---

## 10. Chart objects and global variables

| Name | Type | Purpose |
|------|------|---------|
| `GUA_Canvas_<n>` | Bitmap label (canvas) in the indicator sub-window | The tick overlay itself (`<n>` = sub-window index). |
| `GUA_Panel` | Bitmap label (canvas) | The info panel on the main chart; click handling for the Details button. |
| `GUA_SR_R0…` / `GUA_SR_S0…` | `OBJ_HLINE` | Resistance / support lines. |
| `GUA_SR_*_t` | `OBJ_TEXT` | Price and touch-count labels next to the lines. |
| `MBT_details` | Terminal global variable | Remembers the Details ON/OFF state across restarts. |

All `GUA_SR_*` objects are removed when the indicator is removed.

---

## 11. Troubleshooting

| Symptom | Likely cause / fix |
|---------|--------------------|
| "Loading tick data…" for a long time | Terminal is downloading tick history. Keep the chart open; check *Tools → Options → Charts* for the tick-history limits and make sure the symbol is in Market Watch. |
| "No tick data found (check symbol / session hours)" | Broker provides no tick history for this symbol, or session hours were detected incorrectly — set `InpAutoSession = false` and enter the session start/length manually. |
| "Window too small – increase its height" | Sub-window is too short; raise `InpWindowHeight` or drag the splitter. |
| Panel says "too early to compare" | Fewer than 30 minutes since session open — expected. |
| Panel says "Not enough history to compare" | Fewer than 5 past sessions have data at this elapsed time. Wait for loading or increase available tick history. |
| ATR shows "needs 3+ past sessions" | Same reason — ATR needs at least 3 completed past sessions. |
| Text too small / too large | Adjust `InpFont` and `InpFontScale`. |
| Non-Latin characters broken | Re-save the file as UTF-8 with BOM in MetaEditor. |
| No S/R lines | Needs ≥ 5 hourly (or 4-hour) bars of stored sessions; also check `InpShowSR` and `InpSROnChart`. |
| Last tick warning during the day | The market is closed for that symbol or the feed is interrupted. |

---

## 12. Limitations and disclaimer

- Works from **broker time** and the broker's tick history; different brokers may produce slightly different shapes and spreads.
- Weekend days are skipped; holidays without ticks are ignored automatically.
- Bid price is the default; the `Mid` option averages bid and ask when both are available.
- Statistics ("typical", ATR, forward moves) are descriptive summaries of recent sessions and do not predict future price.
- The indicator does not place orders and does not generate alerts.

**Disclaimer:** This tool is for information and analysis only and is not financial advice. Trading leveraged products carries a high risk of loss.

---

*MiniBullTicko V13.19 · © MiniBull*
Рекомендуем также
VWAP Fibo Bands RSJ is an indicator that traces the lines of the daily VWAP and from it creates bands using Fibonacci proportions. This spectacular indicator creates 10 band levels through the selected VWAP period using Fibonacci ratios. It is fantastic how the prices respect each level of the bands, where it is possible to realize that almost every time the price closes above / below a level of the bands he will seek the next one. If close above will seek to reach the level above and if close
FREE
Haven Stop Loss Hunter 2.0 - Новый уровень анализа ликвидности Встречайте масштабное обновление — Haven Stop Loss Hunter 2.0 ! Это профессиональный инструмент для работы с зонами скопления ликвидности и ложными пробоями (Sweeps), который стал еще более гибким и функциональным. В этой версии мы реализовали полноценный мультитаймфреймовый (MTF) анализ и продвинутую систему оповещений, чтобы вы могли отслеживать манипуляции крупного капитала по концепции Smart Money, не тратя время на постоянное пе
FREE
Watermark Centralized
Ronnie Ferreira Silva
4 (4)
Watermark Centralized Adds a watermark centered with the asset name and chosen period. It is possible to override the font type, font size, font color and separator character. The watermark is positioned behind the candles, not disturbing the visualization. It has automatic re-centering if the window is resized. Hope this indicator helps you, good trading ;)
FREE
Professional Renko Chart MT5 Professional Renko Chart MT5 — это чистый индикатор графика Renko для MetaTrader 5, предназначенный для отображения кирпичей Renko в отдельном окне индикатора, с возможностью дополнительной визуализации блоков Renko прямо на основном ценовом графике. Индикатор создан для трейдеров, которым нужен привычный стиль графика Renko внутри MetaTrader 5, похожий на визуализацию Renko, доступную на популярных современных графических платформах, таких как TradingView. Он преобр
Stop guessing and start executing with precision. Learning complex trading methodologies takes years of screen time—until now. The Propfolio Strategy Mentor OS is an elite, on-chart analytical dashboard that acts as your live digital trading mentor. It doesn't just draw lines on your chart; it actively scans the market, identifies high-probability setups across 8 different institutional strategies, and tells you exactly what to look for in real-time via the Live Mentorship Terminal. Whether you
Ksm mt5
Andriy Sydoruk
3 (2)
Ksm: Умное Решение для Автоматизированной Торговли на Форексе Ksm – это инструмент для автоматизации торговли на Форексе, который применяет современные методы анализа временных данных для работы с множеством валютных пар и различных временных интервалов. Основные Возможности и Преимущества Мультивалютная поддержка : Ksm позволяет работать с множеством валютных пар, что помогает трейдерам адаптировать стратегии к разным рыночным условиям. Новые валютные пары можно легко добавить. Анализ временны
Investopedia FIVE
Joseph Anthony Aya-ay Yutig
Советник Investopedia FIVE EA основан на этой статье: https://www.investopedia.com/articles/forex/08/five-minute-momo.asp ТОРГОВЫЕ УСЛОВИЯ - Ищите валютную пару, торгующуюся ниже EMA X-периода, а MACD находится на отрицательной территории. - Подождите, пока цена пересечет EMA X-периода, затем убедитесь, что MACD либо находится в процессе перехода от отрицательного к положительному, либо перешел на положительную территорию в течение пяти баров. - Открывайте длинные позиции на X пунктов выше
Viking Alpha DAX Ivar Edition
Valdeci Carlos Dos Passos Albuquerque
Viking Alpha DAX — Germany 40 Expert Advisor for MetaTrader 5 LAUNCH PROMO Only 10 copies at launch price. Price increases with each sale. Launch price: $297 Next price: $497 Final price: $997 Live Performance: FX Blue — Vikingtradingbots What Makes Viking Alpha DAX Different Most DAX robots fail for one simple reason: they treat the Germany 40 like a forex pair. It isn't. The DAX has a heartbeat — a specific rhythm tied to the Frankfurt Stock Exchange opening, the European session structure, an
BTC Master Pro
Farzad Saadatinia
4.62 (13)
BTC Master Pro — ваш надежный инструмент для дисциплинированной торговли Bitcoin. Новая версия теперь усилена искусственным интеллектом OpenAI , обеспечивая более точное исполнение сделок и улучшенную фильтрацию торговых сигналов в условиях высокой волатильности крипторынка. Этот профессиональный торговый робот разработан специально для торговли Bitcoin (BTCUSD) на платформе MetaTrader 5 , с акцентом на структурированное исполнение, контролируемую нагрузку на депозит и интеллектуальное управлени
Phantom Gold
Ignacio Agustin Mene Franco
Phantom GOLD MT5 v1.0 Phantom GOLD MT5: The algorithmic spectrum that hunts gold moves with surgical precision Phantom GOLD is a next-generation Expert Advisor designed exclusively for XAUUSD (gold), combining modern artificial intelligence with the most powerful Smart Money Concept (SMC) strategies, institutional price action, and advanced trend filters. It's not just a robot: it's an invisible hunter operating in the shadows of the market, detecting high-probability zones where large instit
DAILY OH/OL SDEV QUANT MODEL - STATISTICAL TRADING WITH PRECISION RISK MANAGEMENT TRADE WITH MATHEMATICAL CERTAINTY - KNOW YOUR EXACT STOP-LOSS AND TAKE-PROFIT BEFORE YOU ENTER This indicator analyzes 5,000+ days of price history to give you: Exact entry levels (sigma bands locked at daily open) Exact stop-loss distance (from M
ACRON Supply Demand EA
Georgios Kalomoiropoulos
4.5 (4)
Советник ACRON Supply Demand — это полностью автоматизированный торговый алгоритм, построенный на концепциях спроса и предложения в сочетании с логикой фильтрации ценовых действий. Он был создан трейдерами на основе реального торгового опыта с целью обеспечения стабильного и устойчивого роста в долгосрочной перспективе. Он разработан для реалистичной торговли с контролируемым риском и возможностью использования различных стратегий для диверсификации. [РУКОВОДСТВО ПО ПРОДУКТУ] [FAQ]   После покуп
ProTrade EA
Jim Ariel Camarce Ignao
Key Features   Automated Candle Pattern Recognition 10 Professional Patterns : Detects Bullish/Bearish Engulfing, Hammer/Shooting Star, Morning/Evening Star, Piercing/Dark Cloud, and 6 additional professional candlestick patterns Smart Filtering : Combine multiple patterns with configurable confirmation logic Volume Confirmation : Optional volume filter to validate pattern strength Multi-Timeframe Analysis : Separate execution and bias timeframes for better timing   Trading Dashboard Int
" Blow It Up!" - The Trading Indicator That Questions Your Life Choices Tired of boring indicators? Meet your new market companion that delivers: "YOLO BUY!" arrows when you should probably panic Explosive rectangle confetti (because why not?) 200+ soul-crushing quotes like "Your stop loss is imaginary" and "This is n't trading, it's donating to whales" Random alerts that roast your strategy This Indicator is lik e Therapy - Because daytrading shouldn't fe el like watching paint dry! Highlights
X Sensors Pro — это профессиональный индикатор профиля объема, который визуализирует распределение торгового объема по ценовым уровням за выбранный период. Индикатор автоматически определяет локальные экстремумы (HH и LL), рассчитывает Point of Control (POC) — уровень с максимальным объемом, а также строит уровни поддержки и сопротивления на основе выявленного диапазона.   Основные возможности: ·                       Визуализация профиля объема в виде цветных гистограмм ·                      
FusionTrailing EA – Your Ultimate Weapon for Market Domination! Transform your trading and crush every market move with the most advanced trailing stop system available. FusionTrailing EA delivers unstoppable power with its dual-mode setup: • Fusion Mode: Automatically sets a bulletproof stop loss using a maximum loss threshold and activates smart trailing
Market Projection Pro — MT5 Хотите видеть на графике сценарий продолжения ценовых циклов? Market Projection Pro анализирует выбранный вами исторический участок, выделяет циклические компоненты и строит составную проекцию вправо от окна анализа. Вы сами выбираете исходный участок и горизонт, чтобы сопоставлять сценарий с текущей структурой цены и возможными зонами поворота. Что вы увидите на графике Интерактивные границы позволяют выбрать исторический участок прямо на графике. Расчёт циклических
Представляем Neural Bitcoin Impulse - инновационный торговый бот, созданный с использованием технологии обучения нейросети на объёмных массивах рыночных данных. Встроенная математическая модель искусственного интеллекта ищет потенциальный импульс каждого следующего рыночного бара и использует образовавшиеся паттерны дивергенции и конвергенции между прогностическими показателями и ценой для формирования высокоточных разворотных точек открытия торговых позиций. В основе торгового робота лежит ра
Acronix Acronix — советник для MetaTrader 5, использующий контртрендовый скальпинг и ориентированный на EURUSD и GBPUSD. Разработанный Blackore Finance , Acronix сочетает сигналы входа RSI, фильтрацию ADX, адаптивное расстояние между входами и автоматическое управление позициями. Мультивалютная совместимость распространяется на основные валютные пары Forex и золото (XAUUSD) с отдельными настройками для каждого инструмента. Торговая стратегия Acronix ищет краткосрочные ценовые откаты на основе дв
V Wave EA
STANTON ROUX
5 (1)
V-Wave EA Unlock the power of automated trading with V-Wave EA ! This cutting-edge Expert Advisor integrates a robust set of indicators, including VWAP , Moving Averages ,  IBS , and FIBO Levels for precise entries. Key Features: 1. Powerful Indicators: VWAP (Volume-Weighted Average Price): The core of the strategy, ensuring optimal entries based on volume-driven market trends. Two Moving Averages: Customize crossover and trend strategies for added confirmation. IBS (Internal Bar Strength): Fin
Exclusive EA for FOREX HEDGE account The EA (FuzzyLogicTrendEA) is based on fuzzy logic strategies based on the analysis of a set of 5 indicators and filters. Each indicator and filter has a weight in the calculation and, when the fuzzy logic result reaches the value defined in the EA parameter, a negotiation is opened seeking a pre-defined gain. As additional functions it is possible to define maximum spread, stop loss and so on . Recommended Symbol: EURUSD, AUDUSD, GBPUSD, NZDUSD, USDCAD, AUD
Smart SuperTrend Scalping Signals Pro is a MetaTrader 5 indicator designed for traders who want a clean visual trend-following system directly on the chart. Instead of displaying the traditional SuperTrend as a line, the indicator colors the actual price candles based on the current market condition. Green candles indicate bullish SuperTrend conditions, red candles indicate bearish SuperTrend conditions, and gray candles indicate sideways or weak-trend conditions. The indicator also includes a s
Manyal trading system, CovEchoTrend Robot, focuses on reliability and flexibility. By employing statistical analysis methods to study the relationships between the base indicator and market patterns, the system enables a deeper understanding of market processes. Intelligent pattern analysis: The application of statistical data processing helps identify key trend reversal points more accurately, signaling significant market shifts. Informed decision-making is based on the intersection of indicato
Gold Quant Intelligence EA Advanced Multi-Market Quantitative Intelligence for XAUUSD Gold Quant Intelligence EA is a professional MetaTrader 5 Expert Advisor designed to analyze the gold market through a multi-market quantitative framework rather than relying on a single technical indicator. The EA continuously evaluates XAUUSD together with Silver, EURUSD, GBPUSD, USDJPY, DXY and US10Y to identify relationships that may provide additional context for the current gold market environment. Its q
Pattern Recognition EA - From Learn to Earn. The market repeats itself. This EA finds every past repeat of the current candle sequence - and lets history vote the direction. ONE SHAPE. EVERY REPEAT IN HISTORY VOTES. The last N candles on your signal timeframe form a shape. The EA scans the history you choose - a fixed number of bars or everything your broker provides - for the SAME shape, and checks what happened next, every single time. Only when enough repeats exist AND a clear majority of t
Trend Sniper Matrix is an institutional-grade trend-riding quantitative trading terminal engineered strictly for Tier-1 multi-asset market environments. Meticulously optimized for advanced Prop Firm Evaluation Compliance and low-latency execution, this Expert Advisor integrates a high-performance bare-metal framework customized for XAUUSD (GOLD), EURUSD, GBPUSD, and USDJPY on low-latency hedging accounts. The core analytical framework leverages a dual-layered Multi-Timeframe Heiken Ashi Smooth
Day Direction Scanner
Efren Hernandez Partida
5 (3)
Сканер направления движения дня (Day Direction Scanner) — это индикатор, который использует направление текущей свечи на дневном, 4-часовом, 1-часовом, 15-минутном и 5-минутном графиках для определения направления рынка. Когда все свечи сходятся в одном направлении, индикатор показывает, является ли день бычьим или медвежьим, или же если четкого направления нет. Он полезен для быстрого определения направления движения рынка в течение дня. Особенности: - Работает со всеми валютными парами, инд
FREE
O Alpha B3 Renko Trader  é um robô especialista para negociação no Bovespa B3  (miniíndice e minidólar) que une a análise de candlesticks do gráfico Renko (calculado internamente, sem imagens gráficas) com a estratégia Alpha B3 . O robô permite configurar, para os sinais de entrada, o tamanho do brick do gráfico Renko, bem como um número de candlesticks para análise. Além disso, você deve configurar os stops fixos, em pontos. O robô permite também a configuração de funções, tais como número de c
Exclusive Imperium MT5 — автоматизированная торговая система Exclusive Imperium MT5 — это эксперт-советник для MetaTrader 5, основанный на алгоритмах анализа рынка и управлении рисками. Советник работает в полностью автоматическом режиме и требует минимального вмешательства со стороны трейдера. Внимание! Свяжитесь со мной сразу после покупки , чтобы получить инструкции по настройке! ВАЖНО: Все примеры, скриншоты и тесты приведены исключительно в демонстрационных целях. Если у одного брокера опре
This indicator uses a mathematical calculation algorithm . This algorithm calculates the remainder between the updated model and the actual values and produces the possible progress of the graph on the graph. It is not a super prophet in trading, but it is very good for the trader when entering the market and to analyze it before entering. Applicable for all currencies. Данный индикатор использует алгоритм математических вычислений . Данный алгоритм вычисляет остаток между обновленной моделью и
С этим продуктом покупают
Trend Sniper X
Sarvarbek Abduvoxobov
4.86 (42)
Trend Sniper X — это трендовый индикатор для MetaTrader 5, работающий на нескольких таймфреймах, который помогает трейдерам точно и ясно определять направление тренда и потенциальные точки разворота. для MT4: https://www.mql5.com/en/market/product/193245 Информация о цене: Текущая цена является промо-ценой и может измениться по мере выхода предстоящих обновлений и новых функций. Бонусное предложение: Чтобы получить БЕСПЛАТНЫЙ авто-трейд советник Assistant EA для этого индикатора, пожалуйста, на
Новый король в городе — Индикатор + управление ордерами (TP1 + TP2 + TP3) + опциональный Telegram-сигнал-сендер ВКЛЮЧЁН (БЕСПЛАТНО) (ПОЛНОЦЕННАЯ ТОРГОВАЯ И СИГНАЛЬНАЯ СИСТЕМА) Gold Slayer EA Этот индикатор включает в себя продвинутую стратегию, торговую систему с настраиваемым управлением ордерами и систему mean reversion, которая сочетает расширения Envelope и поддерживается несколькими интеллектуальными фильтрами подтверждения, такими как RSI, для поиска высоковероятных точек разворота с сигн
Smart Trend Trading System — MetaTrader 5 После покупки напишите мне на MQL5, чтобы БЕСПЛАТНО получить Smart Universal Expert Advisor, а также доступ к онлайн-курсу, руководство в формате PDF и доступ к закрытой группе. STTS объединяет направление тренда, сигналы входа и выхода, зоны разворота и важные ценовые уровни прямо на графике. Торгуйте по системе вручную или подключите отдельный совместимый советник для автоматического исполнения с выбранными вами настройками. ОДНА СИСТЕМА. ЧЕТЫРЕ ТОРГОВ
Получите своё торговое преимущество в поле зрения! M5 Sniper — это новый индикатор от MeanFX. Он сочетает точные торговые сигналы с адаптивными уровнями TP/SL — в результате создавая лучшие возможные статистические сделки! Цена увеличивается каждые 5 покупок, следующая цена — 69$ Напишите мне после покупки, чтобы получить советы/руководство и бонусного EA Что выделяет его среди других? Проверенная статистическая эффективность на Gold XAUUSD ( работает практически на каждом активе , с акцентом н
SuperScalp Pro
Van Minh Nguyen
4.54 (37)
SuperScalp Pro - Professional Multi-Layer Confluence Scalping System SuperScalp Pro — это продвинутый индикатор для скальпинга, который расширяет возможности классического Supertrend с помощью нескольких интеллектуальных фильтров подтверждения. Он помогает выявлять торговые возможности Buy/Sell с более высокой вероятностью успеха и значительно сокращать количество ложных сигналов. Чёткие стрелки Buy и Sell отображаются непосредственно на графике вместе с автоматически рассчитываемыми в реальном
SMC Intraday Formula
VividMind Digital Solutions
5 (26)
Давайте сначала будем честны. Ни один индикатор сам по себе не сделает вас прибыльным. Если кто-то говорит вам обратное — он продаёт вам мечту. Любой индикатор, который показывает идеальные стрелки покупки/продажи, можно сделать безупречным — просто увеличьте нужный участок истории и сделайте скриншот успешных сделок. Мы так делать не будем. SMC Intraday Formula — это инструмент. Он считывает структуру рынка за вас, определяет зоны с наивысшей вероятностью движения цены и точно показывает, как
Entry Points Pro — топ-1 индикатор по количеству отзывов (более 600 отзывов и более 28 000 скачиваний демо обеих версий). Индикатор даёт самые перспективные точки входа в сделки без перерисовки на любых инструментах. Индикатор покажет заранее стрелкой точку входа в сделку, укажет цену входа и нарисует на графике уровень входа и стопа, а так же рассчитает рабочий лот под твой депозит и риск, а панель статистики поможет выбрать самый перспективный инструмент и таймфрейм .  Тебе остаётся поставить
Auto Optimized SpeedAngle — это система векторизации импульса институционального уровня, которая исключает подгонку под исторические данные (curve-fitting) за счет непрерывной форвард-оптимизации (Walk-Forward Optimization, WFO). Вместо того чтобы полагаться на статические входные параметры, которые теряют эффективность при смене рыночных режимов, индикатор динамически перекалибрует свои настройки, используя валидацию на вневыборочных данных (Out-of-Sample, OOS). Это гарантирует, что отображаемы
Gann Made Easy   - это профессиональная, но при этом очень простая в применении Форекс система, основанная на лучших принципах торговли по методам господина У.Д. Ганна. Индикатор дает точные BUY/SELL сигналы, включающие в себя уровни Stop Loss и Take Profit. ПОЖАЛУЙСТА, СВЯЖИТЕСЬ СО МНОЙ ПОСЛЕ ПОКУПКИ, ЧТОБЫ ПОЛУЧИТЬ ТОРГОВЫЕ ИНСТРУКЦИИ И ОТЛИЧНЫЕ ДОПОЛНИТЕЛЬНЫЕ ИНДИКАТОРЫ БЕСПЛАТНО! Вероятно вы уже не раз слышали о торговли по методам Ганна. Как правило теория Ганна отпугивает от себя не только
ARIPoint
Temirlan Kdyrkhan
1 (4)
ARIBot is a powerful trading companion designed to generate high-probability entry signals with dynamic TP/SL/DP levels based on volatility. Built-in performance tracking shows win/loss stats, PP1/PP2 hits, and success rates — all updated live. Key Features: Buy/Sell signals with adaptive volatility bands Real-time TP/SL/DP levels based on ATR Built-in MA Filter with optional ATR/StdDev volatility Performance stats panel (Success, Profit/Loss, PP1/PP2) Alerts via popup, sound, push, or email Cus
Adaptive Price Action Engine Купи индикатор — получи советник (EA) к нему бесплатно Самооптимизирующийся мульти-таймфреймовый анализ тренда и свечных моделей Рынок постоянно меняется — и не каждая модель Price Action имеет одинаковую ценность в разных рыночных режимах. Adaptive Price Action Engine создан для адаптации к изменяющимся рыночным условиям, объединяя трендовую структуру, мульти-таймфреймовый анализ, свечные модели и статистическую оптимизацию в единой аналитической системе. Два адапти
M1 SNIPER   — это простая в использовании торговая система. Это стрелочный индикатор, разработанный для тайм фрейма M1. Индикатор можно использовать как отдельную систему для скальпинга на тайм фрейме M1, а также как часть вашей существующей торговой системы. Хотя эта торговая система была разработана специально для торговли на M1, ее можно использовать и с другими тайм фреймами. Первоначально я разработал этот метод для торговли XAUUSD и BTCUSD. Но я считаю этот метод полезным и для торговли на
Индикатор Tokyo Indicator обеспечивает наглядное представление о направлении тренда, потенциальных торговых сигналах и текущей рыночной ситуации. Его ступенчатая линия тренда с цветовой индикацией позволяет различать «бычьи» фазы (выделены синим цветом) и «медвежьи» фазы (выделены пурпурным цветом). Соответствующие стрелки указывают на возможные точки входа в рынок (покупку или продажу) при смене тренда. Встроенная информационная панель объединяет данные о текущем сигнале, рыночном настроении,
Следующее обновление — версия 2.52 уже скоро! [НОВОЕ] Приготовьтесь к 4 новым важным функциям, призванным улучшить ваш анализ рынка и торговый процесс. Мы выводим анализ рынка на новый уровень с помощью 4 новых функций, разработанных с учётом ваших потребностей в трейдинге. Представляем: 1. TRADE OVERVIEW DASHBOARD 2. CONFLUENCE AT ZONE 3. STRONG & WEAK HIGH/LOW 4. OTE 1. TRADE OVERVIEW DASHBOARD Панель, которая помогает легче понимать общую картину рынка, предоставляя рекомендации для поддержк
Boba Analysis Suite
Trade Ready Solutions LLC
5 (2)
Boba Analysis Suite Boba Analysis Suite — аналитический индикатор для MetaTrader 5. Он объединяет структуру рынка, значимые ценовые зоны и общий рыночный контекст в одном представлении на графике. Индикатор разработан на основе практического опыта трейдера и наставника по трейдингу. Он помогает выстроить последовательный процесс анализа: оценивать направление рынка, определять важные уровни и рассматривать несколько таймфреймов в совокупности. Анализ с учётом контекста Значение отдельных сигнало
FiboSniper Pro – Multi-Filter Fibonacci System with Auto SL/TP and Control Panel FiboSniper Pro — это технический индикатор, который объединяет динамические Fibonacci Envelopes с несколькими фильтрами подтверждения для формирования отборных сигналов Buy и Sell. Уровни Fibonacci рассчитываются на основе Moving Average и ATR, а затем фильтруются с помощью ADX, EMA, RSI, ATR, Volume, Time и структуры свечи. Индикатор отображает на графике автоматические уровни Stop Loss и Take Profit на основе ATR,
Break and Retest Hunter is a powerful MetaTrader 5 indicator designed to automatically identify support and resistance levels, breakout structures, and potential retest opportunities in real time. Bonus Indicator: After purchasing Break and Retest Hunter , contact me to receive Trade Indicator Assistant EA completely free as a bonus utility. $65 for the next 10 copies . Next price is $120.  Combining adaptive market analysis, clear BUY/SELL signals, Fibonacci-based profit targets, and a premiu
Trend Catcher   анализирует движения рыночных цен, используя комбинацию собственных и индивидуально разработанных адаптивных индикаторов анализа тренда. Он определяет истинное направление рынка, отфильтровывая краткосрочные шумы и фокусируясь на силе импульса, расширении волатильности и поведении ценовой структуры. Он также использует комбинацию сглаживающих и фильтрующих тренд индикаторов, таких как скользящие средние, RSI и фильтры волатильности. Мониторинг реальных операций, а также другие
Power Candles V3 — самооптимизирующийся индикатор силы Power Candles V3 преобразует силу валюты и инструмента в готовый к использованию торговый план на каждом графике, к которому он прикреплен. Вместо того, чтобы просто раскрашивать свечи, он выполняет автоматическую оптимизацию в режиме реального времени в фоновом режиме и предоставляет вам оптимальные значения Stop Loss, Take Profit и порог сигнала для выбранного вами символа. Один клик — и все готово для реальной торговли: на графике появляю
Neuro Poseidon - новый индикатор от Дарьи Резуевой. Он сочетает точные торговые сигналы с адаптивными уровнями TP/SL , в результате создавая максимально выгодные сделки! TO SWITCH TO   ENG   PLEASE CHOOSE IT IN THE UPPER-RIGHT CORNER OF THE WEBSITE Напишите мне и получите  Neuro Poseidon Assistant  в подарок для автоматизации вашей торговли! Что отличает его от других индикаторов? 1. Доказанная прибыльность на всех активах и таймфреймах 2. На графике присутствуют только подтвержденные сигналы н
Unix Scalper — MetaTrader 5 После покупки напишите мне на MQL5, чтобы БЕСПЛАТНО получить Smart Universal Expert Advisor, а также доступ к онлайн-курсу, руководство в формате PDF и доступ к закрытой группе. Найдите торговую ситуацию. Оцените план. Выберите способ торговли. UNIX Scalper объединяет анализ рынка, решения BUY/SELL/WAIT и уровни Entry, Stop Loss, TP1 и TP2 в одной удобной панели. УВИДЬТЕ СИГНАЛ И ТОРГОВЫЙ ПЛАН • Понятные решения: BUY, SELL или WAIT. • Определённые уровни: Entry, Stop
Представляем       Quantum Breakout PRO   , новаторский индикатор MQL5, который меняет ваш способ торговли в зонах прорыва! Разработан командой опытных трейдеров со стажем торговли более 13 лет,       Квантовый прорыв PRO       разработан, чтобы поднять ваше торговое путешествие к новым высотам с его инновационной и динамичной стратегией зоны прорыва. Quantum Breakout Indicator покажет вам сигнальные стрелки на зонах прорыва с 5 целевыми зонами прибыли и предложением стоп-лосса на основе поля
FX Trend NG: Следующее поколение интеллектуального анализа трендов на разных рынках Обзор FX Trend NG — это профессиональный инструмент анализа трендов и мониторинга рынка с поддержкой нескольких таймфреймов. Он позволяет за секунды получить полное структурное понимание текущего состояния рынка. Вместо переключения между десятками графиков вы мгновенно видите, какие инструменты находятся в тренде, где импульс ослабевает и где наблюдается сильная синхронизация между таймфреймами. Специальное пр
Мультивалютный индикатор силы и импульса MT5 Dynamic Forex28 Navigator — это развитие наших давних популярных индикаторов, объединяющее силу трёх в одном: Advanced Currency Strength28 Indicator (700 отзывов) Advanced Currency IMPULSE with ALERT (530 отзывов) CS28 Combo Signals (недавний бонус) Оба индикатора-предшественника вместе получили более 1,200 отзывов на MQL5 Market и с 2016 года являются неотъемлемой частью сообщества MT4. Dynamic Forex28 Navigator MT5 переносит ту же проверенную логику
Scalper Vault — это мощная, полноценная торговая система, созданная для трейдеров, которые стремятся к стабильным результатам в внутридневной торговле. Этот высокоточный индикатор представляет собой комплексное, самостоятельное торговое решение, обеспечивающее аналитику профессионального (институционального) уровня как для торговли на рынке Forex, так и для работы с бинарными опционами. Пожалуйста, свяжитесь со мной после покупки, чтобы получить мои торговые советы, а также отличный бонус! Исклю
Volatility Master for MetaTrader is a real-time dashboard tool that scans up to  50 symbols  to identify high-volatility , trending markets instantly. With bullish/bearish signals, customizable alerts, and a user-friendly interface, it helps you avoid range-bound conditions and focus on high-probability trades. Clarity leads to confidence. Trade confidently and protect your capital effectively with this powerful dashboard. We don't offer free or bonus indicators in exchange of reviews from you.
Apex Patterns PRO Купите индикатор — получите Expert Advisor на его основе БЕСПЛАТНО. Самооптимизирующаяся система анализа графических паттернов и пробоев Традиционные сканеры паттернов полагаются на фиксированные входные параметры, что часто приводит к снижению их эффективности при изменении рыночной волатильности и структуры. Apex Patterns PRO разработан для адаптации к меняющимся рыночным условиям, объединяя распознавание структурных графических паттернов, фильтрацию по моментуму и статистич
SR Liquidity   — это торговый индикатор, предназначенный для выявления скрытых зон, где концентрируется рыночная ликвидность и наблюдается наиболее сильная реакция цены. Эти особые зоны ликвидности выступают в качестве мощных уровней поддержки и сопротивления, предоставляя вам четкую картину того, где с наибольшей вероятностью произойдет разворот рынка. Вместо построения стандартных линий поддержки и сопротивления, индикатор SR Liquidity анализирует реальное поведение цены, выявляя зоны концентр
OrderFlux – Индикатор Order Flow Footprint Chart, Volume Profile и Market Profile для MetaTrader 5 OrderFlux — это индикатор Order Flow Footprint для MetaTrader 5, который наглядно показывает, что происходит внутри каждой свечи. Он раскрывает отдельную свечу и отображает объём торгов на каждом ценовом уровне, разделяя агрессивные покупки и агрессивные продажи. На основе тиковых данных в реальном времени строится полноценный Footprint Chart с Delta, Imbalance, Absorption, Volume Profile, Market P
Этот индикатор является уникальным, качественным и доступным инструментом для торговли, включающим в себя наши собственные разработки и новую формулу. В обновленной версии появилась возможность отображать зоны двух таймфреймов. Это означает, что вам будут доступны зоны не только на старшем ТФ, а сразу с двух таймфреймов - таймфрейма графика и старшего: отображение вложенных зон. Обновление обязательно понравится всем трейдерам, торгующим по зонам спроса и предложения. Важная информация Для макс
Другие продукты этого автора
# MiniBull Guard v1.30 ## Never trade without a stop again. **You open the trade. MiniBull Guard sets the stop, shows the risk and keeps your head clear.** - **No more naked positions.** Every new trade gets a stop loss within moments, even when you forget, hesitate or trade from your phone. - **A stop the market can breathe around.** Sized from real volatility (ATR) by default, or from a distance you choose. - **Know your loss before it happens.** In money and in percent of your equity, not
FREE
# MiniBull Board **Version 1.14 — MetaTrader 5 indicator (separate window)** **11 languages: English, Turkish, Russian, Chinese, Spanish, Portuguese, Japanese, German, French, Italian, Korean** — automatically in the language of your MetaTrader terminal, or chosen with a single input. MiniBull Board is a compact watch-list dashboard for MetaTrader 5. For every symbol you choose it shows where the price stands today, this week and this month: the current price, the day / week / month opening
FREE
# MiniBull Report (v1.06) — free **Your market briefing in a sub-window. MiniBull Report answers the questions an intraday trader asks before every decision — in plain language, in your own time zone, and with the same answers on every chart timeframe.** *Where is price against the monthly, weekly, daily and 4H trend? How far is it stretched? How much of today's typical range is used? Where are the nearest resistance and support? Is a high-impact event coming? What speaks for a long, what spe
FREE
MTF MA Анализатор: позиция цены относительно SMA/EMA/KAMA на 11 таймфреймах в одной панели. ### Full Description: ** Забудьте о переключении между графиками разных таймфреймов!** MiniBull Periscope - Мультитаймфреймовый Анализатор Позиции Скользящих Средних Видите полную картину без открытия множества графиков! MiniBull Periscope отображает текущую позицию цены относительно скользящих средних на 11 таймфреймах одновременно - от месячного (MN1) до минутного (M1). **ОСНОВНЫЕ ФУНКЦИИ:** •
FREE
MTF Композитный Анализатор: 9 индикаторов на 11 таймфреймах с системой оценки (-9 до +9). ### Full Description: ** Забудьте о переключении между графиками разных таймфреймов!** MiniBull MTF Observer - Мультитаймфреймовый Композитный Анализатор Сигналов Максимальная мультииндикаторная панель! Анализирует 9 различных технических индикаторов на 11 таймфреймах одновременно и выдает композитную оценку от -9 до +9 для каждого таймфрейма. **9 АНАЛИЗИРУЕМЫХ ИНДИКАТОРОВ:** • RSI (Индекс Относите
VAMA Signal Simulator сканирует 7 таймфреймов (M1-D1, веса от 5% до 30%) и оценивает каждый по 4 скользящим средним и 6 осцилляторам, объединяя их в взвешенный сигнал Strong Buy/Buy/Neutral/Sell/Strong Sell. Подтверждённый сигнал также должен совпадать с адаптивной к волатильности скользящей средней H4 (период сокращается при высокой волатильности, увеличивается на спокойном рынке) И направлением тренда на M15 и H1. Каждый подтверждённый сигнал отображается стрелкой и меткой BUY/SELL на графике,
# MiniBull Session S/R · MTF VWAP · Auto **A MetaTrader 5 indicator for intraday index and CFD traders who read the market through session structure, volume-weighted price, and multi-timeframe support/resistance.** Version 4.51 · MT5 (MQL5) · Works on any chart timeframe --- ## What it is MiniBull Session S/R MTF VWAP Auto is an all-in-one context indicator built for people who trade indices (NAS100 and similar) intraday, around session opens, prior-day levels, and volume-weighted fair valu
# MiniBull Price Action v49.14 **A complete top-down trading map on one chart: market direction, the zones worth trading, and the exact moment a reversal is confirmed — calculated on closed bars only, no repaint.** MiniBull Price Action answers three questions in order, the same way a disciplined discretionary trader does: 1. **Direction** – Is this a bull market, a bear market, or no market at all? 2. **Zone** – Where is the price worth trading? (In a bull market: pullbacks. In a bear market
# MiniBull Core v1.07 **One chart tool built only from the parts that passed our tests: the MiniBull market class and weekly character, the signals of the MiniBull Price Action EA and the Algorithmic Trio EA, the key daily levels, a day-anchored VWAP and a minimum-lot risk calculator. No repaint, closed bars only.** MiniBull Core is an indicator. **It does not open, close or change any trade.** It shows on your chart where the two MiniBull Expert Advisors would enter and exit, explains in a s
# MiniBull Price Action EA v1.26 **A slow, rule-based trend follower for MetaTrader 5. It buys only when the whole market structure is bullish, holds for weeks, and steps aside when the structure turns.** MiniBull Price Action EA trades the **market class** of the MiniBull Price Action indicator (v49.19). The class combines the monthly, weekly and daily KAMA with a long and a short adaptive moving average into one number from −3 (Strong Bear) to +3 (Strong Bull). The EA enters when the class
# MiniBull Guard&Journal **Automatic ATR stop loss, live risk and margin panel, and a trade journal that grades your discipline from A to F.** Most accounts are not lost because of bad setups. They are lost because of size, missing stops, revenge trades and holding losers too long. MiniBull Guard&Journal watches all of that for you, live, and then shows you the truth in a report card. It never opens a trade. It never closes a trade. It does not use WebRequest or any internet access. Everythi
# Algorithmic Trio EA v3.96 A MetaTrader 5 Expert Advisor that trades US index CFDs (**SPX500, NAS100, US30**) with a multi-timeframe trend engine and a separate, pre-tuned profile for each instrument. It opens one market order at a time at the broker's **minimum lot**, attaches an ATR-based stop-loss and a 2.5 x ATR take-profit, and stops itself after a losing streak. > **Test it on a demo account first.** The EA places real orders. --- ## What it does The EA works only on **closed H4 bar
Фильтр:
Нет отзывов
Ответ на отзыв