Trend Regime Line

Trend Regime Line

Version 1.1 · algoteknik

What This Indicator Is

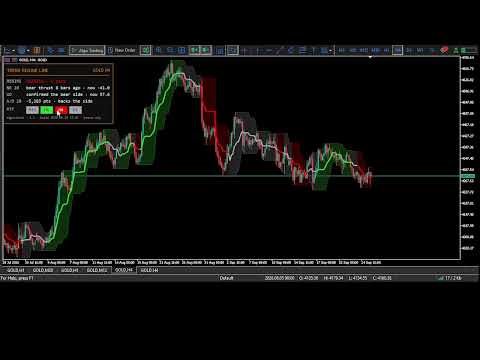
Trend Regime Line reads the trend through a triad: three Larry Williams tools that each answer their own question, and one line on the price chart that is coloured only when the answers fit together. Williams %R says which side price is thrusting to, the Ultimate Oscillator whether momentum confirms that side, and Williams Accumulation/Distribution whether buying or selling pressure still backs it. Green means the triad agrees on a bullish side, red on a bearish one, and grey that it does not agree or has not confirmed a new side yet. The line itself is simple on purpose: it is the middle of the highest high and the lowest low of the last ten bars, the price at which Williams %R reads -50. What the indicator adds is the colour, and every rule behind the colour is written in this manual and adjustable in the dialog. The colour can be shown three ways, from a shaded band with a panel to painted candles, as described below.

Every default is Larry Williams' own value: %R over 10 bars with its zones at -10 and -90, and the Ultimate Oscillator over 7, 14 and 28 bars weighted 4, 2 and 1.

Release notes, chart examples and new product announcements are posted on the TrendTower channel: https://www.mql5.com/en/channels/trendtower

How The Triad Decides The Colour

The first of the three sets the side: Williams' %R thrust. When a bar closes with %R at -10 or higher, near the top of its ten-bar range, the side turns bullish. When a bar closes with %R at -90 or lower, it turns bearish. Between the two zones the side does not change, so an ordinary pullback inside a move does not flip it.

The second, the Ultimate Oscillator, confirms a new side. After a flip the line stays grey until the oscillator closes above 50 for a bullish side, or below 50 for a bearish one. Usually this happens on the same bar, because a close at the edge of the range tends to carry the oscillator with it. When it does not, the grey says the thrust has no momentum behind it yet.

The third, Williams Accumulation/Distribution, is the second opinion. Its change over the last 28 bars, the Ultimate Oscillator's slow period, is compared with the side. When it turns against the side the line goes grey, and it stays grey until %R thrusts again in the side's direction with Accumulation/Distribution back in favour. A new high that price makes and Accumulation/Distribution does not is Williams' classic warning, and this is how it shows on the line.

Only closed bars are read. The bar that is still open keeps the colour of the last closed bar and only the line's value moves with it, so a colour on the chart is in the same place tomorrow.

Reading The Line

A strong trend stays one colour. %R keeps closing near the edge of its range, the oscillator stays on the same side and accumulation keeps pace. Williams was clear that an overbought reading in a strong market is strength, not a reason to sell, and the line does not turn on it.

A top that is being distributed usually shows as grey before it shows as red: price is still making highs, but Accumulation/Distribution has stopped following. A bottom being accumulated is the mirror image. A flip straight from green to red with no grey between is a fast reversal, where the new side was confirmed on the bar it appeared.

Grey is not a third direction. It means the triad disagrees, and a chart that is grey for long stretches is a market without a side.

The Three Views

The first setting chooses how the colour is shown. Regime Dashboard, the default, shades the %R range itself, the band from the lowest low to the highest high of the last ten bars whose middle is the line, in the colour of the regime, draws the candles over it and adds a panel. Regime Cloud shows the same band and the line without the panel. Paint Bars colours the candles instead: every candle takes the regime's colour, hollow when the bar closed up and filled when it closed down.

MetaTrader 5 draws an indicator's shading over the chart's candles and cannot make it transparent, and every candle lies inside its own ten-bar range. So the band is a tint: the regime colour mixed toward the chart's background, as far as the Cloud strength setting says. The candles are then drawn again on top of it, in the chart's own candle colours, and follow them when they are changed; they are drawn as candles even when the chart shows bars or a line. Where the colour changes, the band is split along a diagonal between the old colour and the new one. Paint Bars needs the chart's Chart on foreground option to be off, which is MetaTrader's default: with it on, the chart draws its own candles over everything the indicator draws, and the indicator says so once in the journal.

The panel reads the last closed bar and says which member of the triad holds the colour where it is, in the rule's own terms rather than as bare readings. It gives the regime and how many bars it has lasted, the %R thrust that set the side and how long ago it was, whether the Ultimate Oscillator has confirmed the side or is still waiting for its close beyond the midline, and whether Accumulation/Distribution backs the side or what keeps the line grey when it does not. With the A marker shown, a row gives the last A signal. Four squares show the regime on four timeframes, M15, H1, H4 and D1 by default. Each is the colour a chart of that timeframe shows on its last closed bar, computed over that timeframe's last 1000 bars, or ten times the longest period if that is more; on every closed bar of the datasets described below, a hundred bars were already enough to give the same colour as the full history. A square stays empty until its timeframe's history has loaded. The panel can be anchored to any corner or dragged with the mouse, and it stays where it was left.

What The Measurements Say

The figures below were computed on 9 datasets (GOLD M15, GOLD H1, GOLD H4, EURUSD H1, EURUSD H4, XAUUSD D1, EURUSD D1, US100 H1, US100 H4) by the measurement script that ships with the source. They grade the colour against the price legs as they are known in hindsight, where a leg ends when price moves three average true ranges against its extreme. Hindsight is used only to grade the line; the indicator never sees it. They describe how the line behaved, and they are not a forecast of what it will do.

On coloured bars, the colour matched the leg in progress on 67% to 78% of bars, depending on the dataset. The line was grey on 31% to 40% of bars.

The colour changes 77 to 99 times per 1,000 bars, and a colour lasts a median of 7 to 9 bars. Between 18% and 28% of colour runs last only one or two bars. Some of these are a one-bar grey between two opposite colours, which is a real transition. Others are brief flashes when the Accumulation/Distribution change sits close to zero at a thrust. They are left visible, because hiding them would need a threshold that has no Williams value behind it.

The A Marker

An optional marker, off by default, shows Williams' Ultimate Oscillator divergence trigger. The setup is his: price makes a lower low while the oscillator makes a higher low, the first oscillator low is under 30, and the two lows are 4 to 60 bars apart. The signal comes when the oscillator closes above the highest oscillator reading between the two lows. The sell setup mirrors it, with the first high above 70. Lows and highs are Williams' intermediate swings, which are known only once the next swing has formed, so a marker appears a few bars after the low it refers to. A filled arrow below the bar marks a buy trigger and a filled arrow above the bar a sell trigger.

Measured on the same datasets, the leg that followed an A signal ran its way 72% of the time, over 472 signals. Ten bars later the average move was -0.02 average true ranges, so the move itself showed no edge. The marker is there to watch the moment Williams' rule fires next to the line, not as a trade signal.

Alerts

The indicator can raise an alert when the colour turns, as a terminal popup, a push notification or both. Both are off by default. An alert is raised only for a bar that closed while the indicator was attached, so attaching it to a chart does not replay turns that happened before. If several bars close at once, for example after a reconnect, every turn among them goes into a single message that says how many there were and which was the last, because MetaTrader drops push notifications sent faster than two a second or ten a minute. Push notifications need a MetaQuotes ID in the terminal settings; if one cannot be sent, the indicator writes that once to the journal.

For Experts: iCustom

Every value the indicator computes is published and can be read with iCustom. The buffer indices are:

0 to 5: the cloud's three fillings, for drawing only
6 to 11: the seams over the cloud's colour changes, for drawing only
12 and 13: the %R range high and its colour index
14 and 15: the %R range low and its colour index
16 to 27: the candles, for drawing only
28: the line value
29: colour index, 0 bullish, 1 bearish, 2 neutral
30: A buy marker at the bar's low, empty unless the marker is shown
31: A sell marker at the bar's high, empty unless the marker is shown
32: regime, +1 bullish, 0 neutral, -1 bearish
33: %R thrust side, +1 or -1, and 0 before the first thrust
34: A signal on this bar, +1, -1 or 0, published whether or not the marker is shown
35: B signal on this bar, +1, -1 or 0
36: Williams Accumulation/Distribution change over the momentum period, in points
37: Williams %R
38: Ultimate Oscillator
39: Williams Accumulation/Distribution in points; its level depends on how much history is loaded, and only its changes are used

An expert that only reads the buffers has no use for the panel: passing the Regime Cloud view as the first parameter leaves it out.

The B signal in buffer 35 is Williams' %R pullback timing inside the Accumulation/Distribution swing bias: %R leaving -90 upward when the bias is up, or -10 downward when it is down, with a five-bar wait after a touch of -100 or 0. It is published for research and is not drawn. Measured on the same datasets, the leg that followed ran against it about two times in three: buy signals ran their way 34% of the time over 3756 signals, and sell signals 29% of the time over 4266.

What Has No Setting Of Its Own

A few behaviours are decided rather than exposed. The five-bar wait after %R touches -100 or 0, and the -95 and -5 levels that end it, are Williams' own. Buying pressure, true range and the Accumulation/Distribution step are counted in whole points, so the oscillator and momentum windows are exact sums: the same bars give the same values whatever history is loaded, and a bar costs the same work whatever the periods. The %R range is rescanned only when the bar leaving the window held its high or its low. The first bars of the chart, up to the longest period, carry no line while the indicator warms up. The cloud's edges are drawn at twice the cloud's strength. The panel is the only thing drawn as chart objects: they are removed with the indicator, and any that a crash leaves behind are cleared the next time it starts. Two copies can share a chart, for example a Regime Dashboard and a Paint Bars; when one restarts and clears the other's panel with the leftovers, that panel draws itself again within a second.

Settings Reference

The labels below are the labels in the properties dialog, in the order the dialog shows them, with the default each one ships with.

1. VIEW

View — default: Regime Dashboard (cloud, candles, panel, MTF)

Cloud strength (percent toward the regime colour, 0 = no cloud) — default: 20

2. WILLIAMS %R

%R period; the line is the middle of this range (Williams: 10) — default: 10

Top zone: a close here turns the side bullish (Williams: -10) — default: -10.0

Bottom zone: a close here turns the side bearish (Williams: -90) — default: -90.0

3. ULTIMATE OSCILLATOR

Fast period (Williams: 7) — default: 7

Middle period (Williams: 14) — default: 14

Slow period (Williams: 28) — default: 28

Fast weight (Williams: 4) — default: 4.0

Middle weight (Williams: 2) — default: 2.0

Slow weight (Williams: 1) — default: 1.0

Midline: a new side is shown once UO closes beyond it (Williams: 50) — default: 50.0

4. WILLIAMS A/D

Momentum period: A/D moving against the side greys it (28 = UO slow) — default: 28

5. LINE AND COLOURS

Bullish colour — default: LimeGreen

Bearish colour — default: Red

Neutral colour — default: DarkGray

Line width (1-5) — default: 3

6. PANEL (Regime Dashboard view)

Panel corner — default: Top left

Panel distance from that corner, across — default: 12

Panel distance from that corner, down — default: 22

Panel text size (7-16) — default: 9

Let the panel be dragged with the mouse — default: true

Timeframe square 1 — default: M15

Timeframe square 2 — default: H1

Timeframe square 3 — default: H4

Timeframe square 4 — default: D1

7. UO DIVERGENCE MARKER (A)

Show the A signal: Williams' UO divergence trigger — default: false

A buy setup: first UO low under (Williams: 30) — default: 30.0

A sell setup: first UO high over (Williams: 70) — default: 70.0

A: fewest bars between the two swings — default: 4

A: most bars between the two swings — default: 60

8. ALERTS

Alert when the colour turns on a closed bar (popup) — default: false

The same alert, pushed to the phone — default: false

Version History

1.1: the indicator carries its Market name, Trend Regime Line, everywhere: in the indicator list, on the panel, and in its alerts and journal messages. The calculation, the drawing and the settings are unchanged, and so is every value published for iCustom.

1.0: first release.

About The Author

Published by algoteknik. Other products and contact details are on the seller profile: https://www.mql5.com/en/users/bugraky123

Questions, bug reports and feature requests are welcome on the TrendTower channel: https://www.mql5.com/en/channels/trendtower

Disclaimer

This is an indicator for analysis and decision support. It does not place trades. Always test thoroughly before using any tool in live trading. Trading involves risk. The colour is a description of what the market has done, not a forecast of what it will do.

algoteknik

Support, updates and every other product: mql5.com/en/users/bugraky123
Product channel: mql5.com/en/channels/trendtower

Trend Regime Line version 1.1

Рекомендуем также
Rapid Pulse Scalper
Muhammad Mustajab Bajwa Muhammad Ri
Rapid Pulse Scalper Fast Signals. Precise Entries. Smart H1 Scalping Control. Rapid Pulse Scalper is a professional MT5 scalping indicator designed for traders who want clean, fast, and filtered Buy/Sell signals on major forex pairs using the H1 timeframe . It uses a multi-confirmation signal system to help reduce market noise and focus on higher-quality trading opportunities. This indicator is built for disciplined traders who want simple chart signals, structured trade levels, and smart trade

Holiday Sales Zones Indicator The Zones Indicator is your everyday Trading tool that  leverages advanced algorithms, including ICT institutional concepts like order blocks , engulfing candle patterns , and Level interactions , to identify critical levels of supply and demand (Resistance & Support). Visual signals are generated and clearly marked on the chart, providing a straightforward guide for traders to spot key opportunities. Key Features Advanced Algorithmic Analysis : Identifies supply
Manyal trading system, CovEchoTrend Robot, focuses on reliability and flexibility. By employing statistical analysis methods to study the relationships between the base indicator and market patterns, the system enables a deeper understanding of market processes. Intelligent pattern analysis: The application of statistical data processing helps identify key trend reversal points more accurately, signaling significant market shifts. Informed decision-making is based on the intersection of indicato
The indicator is the advanced form of the MetaTrader 4 standard Fibonacci tool. It is unique and very reasonable for serious Fibonacci traders. Key Features Drawing of Fibonacci retracement and expansion levels in a few seconds by using hotkeys. Auto adjusting of retracement levels once the market makes new highs/lows. Ability to edit/remove any retracement & expansion levels on chart. Auto snap to exact high and low of bars while plotting on chart. Getting very clear charts even though many ret
Mahra Pro Indicator MT5
Mahra Said Mohammed Al Kaabi
Mahra Pro Indicator MT5 Overview Mahra Pro is a MetaTrader 5 chart indicator designed to support structured analysis of XAUUSD (Gold). It combines trend, momentum, volatility and price-structure conditions to identify potential buy and sell setups and display them directly on the chart. The indicator does not open, modify or close trades. All trading decisions and order execution remain under the user's control. Main features • Buy and sell signal arrows on the chart. • Fast and slow EMA lines w
Trend based indicator Identify trends with this indicator A simple-to-use trend indicator No complicated settings Attributes: Can be used in all symbols Can be used in all time frames Relatively high signals No complicated settings Specific to the trend Lifetime support Settings: Alarm Show Alert: By activating these settings, after receiving the signal, you will receive an alarm in Metatrader Alarm Show Notification: By activating these settings, after receiving the signal, you will receive a
Cobalt Predictive Channel: Динамический регрессионный ассистент, предсказывающий будущее Перестаньте чертить каналы вручную, терять деньги на ложных пробоях (fakeouts) и всегда входить в тренды последними. Cobalt Predictive Channel — это ассистент институционального уровня для «Раннего предупреждения и регрессии», специально разработанный для высоковолатильных рынков, таких как XAUUSD, Bitcoin и основные валютные пары Forex. В отличие от традиционных индикаторов, он не просто рисует прошлое; он
FREE
LevelPAttern MT5 - технический индикатор, основанный на дневных уровнях и паттернах Price Action. В основе индикатора лежит стандартный индикатор ZigZag + разворотные свечные модели такие как "Звезда", "Молот" - он же пин-бар, "Поглощение", и другие. При формировании паттерна и касании ценой уровня, индикатор выдает звуковое и текстовое уведомление. Поддерживается отправка уведомлений на электронную почту и push-уведомлений на мобильные устройства. Особенности работы индикатора Подходит для раб
Стратегия RSI Bollinger Bands Arrow Стратегия RSI Bollinger Bands Arrow – это чистый и эффективный технический индикатор, разработанный для выявления высоковероятных точек разворота с использованием комбинации RSI и полос Боллинджера. Эта стратегия использует индикатор RSI вместе с полосами Боллинджера, чтобы: Продавать , когда цена находится выше верхней полосы Боллинджера. Покупать , когда цена находится ниже нижней полосы Боллинджера. Сигналы генерируются только тогда, когда оба индикатора по
GDS Renko Entry Helper - Free Renko Price Interaction Indicator for MetaTrader 5 GDS Renko Entry Helper is a free Renko price interaction indicator for MetaTrader 5. It helps traders highlight important areas where price reacts, slows down, returns to a zone or changes behavior around support and resistance. The tool is designed for manual Renko analysis. It does not generate buy or sell signals and does not tell the trader when to enter the market. Its purpose is to help focus attention on area
CosmiCLab SMC FIBO CosmiCLab SMC FIBO — это профессиональный торговый индикатор, основанный на концепциях Smart Money Concepts (SMC), анализе структуры рынка и уровнях Fibonacci. Индикатор автоматически определяет свинги рынка и строит уровни Fibonacci по последнему импульсному движению. Также индикатор определяет ключевые изменения структуры рынка: BOS — Break Of Structure CHOCH — Change Of Character Дополнительно отображаются сигнальные стрелки BUY / SELL при пробое структуры. Индикатор подход
RBreaker Gold Indicators — это краткосрочная внутридневная торговая стратегия для фьючерсов на золото, которая сочетает в себе два подхода: трендовое следование и внутридневные развороты. Она позволяет не только получать прибыль при трендовом движении, но и своевременно фиксировать прибыль при развороте рынка, открывая позиции в новом направлении. Данная стратегия на протяжении 15 лет подряд входила в десятку самых прибыльных торговых стратегий по версии американского журнала Futures Truth. Она
TrendFusionXplorer consists of three powerful trend-analyzing indicators — TRP , PMax and OTT — developed by Kivanc Ozbilgic. Each indicator displays the trend's support and resistance levels based on its unique properties and methodology. TrendFusionXplorer assists in determining entry and exit points for markets and can also be used for setting trailing stop-loss (SL) and take-profit (TP) levels on open positions. Specifications 1. Trend Reversal Predictor (TRP): TRP follows Thomas R. DeMar
HAS RSI Signal — Профессиональный трендовый индикатор с расчетом SL/TP HAS RSI Signal — это мощный торговый инструмент, объединяющий проверенную классику и современные алгоритмы фильтрации шума. Индикатор анализирует рынок через призму сглаженных свечей Heiken Ashi и осциллятора RSI, предоставляя трейдеру четкие сигналы на вход в моменты разворота тренда или выхода из зон перекупленности/перепроданности. Основные преимущества: Двойная фильтрация: Использование Heiken Ashi Smoothed позволяет искл
Elevate your trading with the precision of "Big Figures." Financial markets are not driven by random numbers; they are driven by institutional liquidity. Central banks, hedge funds, and major commercial traders consolidate their orders at whole integer levels (e.g., 1.1000, 2000.00, 150.00). These are the "Psychological Magnets" where the real price action happens. RoundLevel Pro for MetaTrader 5 is a high-performance tool designed to visualize this invisible grid of institutional interest with
Caicai L&S Yield Histogram Important Notice: This indicator is an integral tool of the automated EA Caicai Long and Short Pair Trading . This indicator visually displays the percentage deviation (Yield %) of a pair's current spread relative to its own historical mean. It is an excellent tool for quickly visualizing the gross financial potential of a market distortion in Long & Short operations. Main Features: Percentage Visualization: Understand the size of the distortion in palpable percentage
Most SMC tools throw everything at you, every order block, every gap, every swing point and leave you to figure out which ones actually matter right now. That's not an edge. That's more noise dressed up as analysis. Smart Alpha SMC does something different. It doesn't just show you structure — it tells you what to DO with it, and just as importantly, when to do NOTHING. IT KNOWS WHEN YOU'RE ALLOWED TO TRADE — AND WHEN YOU'RE NOT Here's the trap every trader falls into: taking a "perfect look
Better RSI With Tester
Mohammad Taher Halimi Tabrizi
Category: Trend Indicator Platform: MetaTrader 5 Type: Entry Indicator Timeframes: All Trader Styles: Scalping, Day Trading, Swing Trading, Binary Options Markets: All Description This indicator is an enhanced version of the Relative Strength Index (RSI) with additional features for visual clarity and cycle detection. It is designed to provide traders with a clearer view of momentum conditions and potential turning points. Main features: Improved RSI Visualization – The indicator displays RSI va
Индикатор Crypto_Forex "Молот и падающая звезда" для MT5. Не перерисовывается, не имеет задержек. - Индикатор "Молот и падающая звезда" — очень мощный индикатор для торговли по Price Action. - Индикатор распознаёт бычий "Молот" и медвежий "Падающая звезда" на графике: - Бычий молот — сигнал в виде синей стрелки на графике (см. изображения). - Медвежий "Падающая звезда" — сигнал в виде красной стрелки на графике (см. изображения). - PC, Mobile alerts. - Индикатор "Молот и падающая звезда" отличн
All about time and price by ICT. This indicator provides a comprehensive view of ICT killzones, Silver Bullet times, and ICT Macros, enhancing your trading experience.  In those time windows price either seeks liquidity or imbalances and you often find the most energetic price moves and turning points. Features: Automatic Adaptation: The ICT killzones intelligently adapt to the specific chart you are using. For Forex charts, it follows the ICT Forex times: In EST timezone: Session: Asia: 20h00-0
Индикатор тренда Plasma Trend представляет собой простую техническую индикацию, которая используется для определения текущего направления тренда на рынке. Индикатор Plasma Trend является мощным инструментом для определения направления тренда на рынке Форекс. Его основой являются как стандартные технические индикаторы, так и собственные математические расчеты, что обеспечивает более точное и надежное определение тренда. Его реализация в виде линий двух цветов упрощает визуальное определение смен
The First Dawn indicator uses a unique mechanism to search and plot signals. This keeps searching for signals, making it a great indicator for scaping and identification of changes in direction, swing trading and trend trading. The    First Dawn     helps you get early signals. The backtest gives the true picture of how the indicator works with real/demo accounts. Although this is a tiny indicator it is packed with advantageous settings that will help you whether you desire to: Snap the Peaks a
* Исправлен и ускорен зигзаг. (Вы можете изменить диапазон) * Зигзаг обновляется с каждой новой свечой/баром. * Если вы хотите, активировав кнопку, только при нажатии кнопки он ищет шаблон. Если вы делаете это автоматически, он выполняет поиск при каждом обновлении диаграммы. * 17 часто используемых гармонических паттернов и специальный паттерн, в котором вы можете определить свои собственные пропорции. * Вы можете сделать график простым с отображением цены. Вы можете сделать представление треу
Sweep Two-Bar Reclaim MT5 Systematic Structural Liquidity Sweep and Two-Bar Reclaim Reversal Engine The Sweep Two-Bar Reclaim indicator for MetaTrader 5 provides an objective analytical framework designed to identify high-probability reversal opportunities resulting from liquidity sweeps around key price boundaries. Price frequently sweeps past an established structural level to trigger stop orders or breakout entries, only to abruptly reverse and collapse back into the prior range. This softwar
"Hunttern harmonic pattern finder" base on the dynamic zigzag with the notification and prediction mode This version of the indicator identifies 11 harmonic patterns and predicts them in real-time before they are completely formed. It offers the ability to calculate the error rate of Zigzag patterns depending on a risk threshold. It moreover sends out a notification once the pattern is complete. The supported patterns: ABCD BAT ALT BAT BUTTERFLY GARTLEY CRAB DEEP CRAB CYPHER SHARK THREE DRIV
The Price Tracker Indicator is designed to outline a dynamic price channel, showcasing areas where price movement is typically contained. The indicator highlights potential areas of interest where price may react when approaching the channel limits. Versatile for Scalping and Swing Trading The indicator adapts to all timeframes and can complement various trading strategies. It integrates seamlessly with tools such as supply and demand levels, reversal patterns, and other confluences. Key Feat
AutoStructure — ваш ключ к точному входу на рынке Forex! AutoStructure  — это профессиональный форекс-индикатор, созданный для трейдеров, которые ценят точность, скорость и контроль над рынком. С его помощью вы за считанные секунды сможете: -Автоматически отрисовывать ключевые уровни поддержки и сопротивления ;  -Визуализировать зоны FVG (Fair Value Gaps) для поиска выгодных разворотов ;  -Анализировать Order Blocks на многих тайм-фреймах; -Строить уровни Фибоначчи с учётом реального движен
CandleStick Patterns Indicator for MT5 — Professional Pattern Scanner Bring proven candlestick analysis into your workflow. This indicator automatically scans your chart and highlights high-quality reversal and continuation patterns, so you can react faster and with more confidence. Check the “More from author” section on the Market page to see our full suite of indicators. What it does Scans historical and live candles from a user-defined lookback range. Detects and labels major single- and m
The indicator scans for Dinapoli thrust pattern in multiple timeframes for a specific market. Key Features Indicator can be used for all markets It can scan for thrust pattern on W1, D1, H4, H1, M30, M15 and M5 timeframes Ability to choose number of bars required above/below displaced moving average to define thrust Able to move display label on chart by single click Parameters Minimum Bars: Least amount of bars to account for Thrust DMA Period: Moving average period DMA Shift: Number or bars re
Eos AI
Lasse Mathias Baagoe S Christensen
How to Read EOS AI EOS AI is designed to make its current market assessment easy to understand from one compact dashboard. The panel gives you three main pieces of information: BUY Probability – the neural model's current bullish assessment SELL Probability – the neural model's current bearish assessment Signal – BUY, SELL or WAIT after the required confirmation rules are applied The probabilities provide context, while the final signal applies the additional confirmation logic. This means the
С этим продуктом покупают
Trend Sniper X
Sarvarbek Abduvoxobov
4.9 (39)
Trend Sniper X — это трендовый индикатор для MetaTrader 5, работающий на нескольких таймфреймах, который помогает трейдерам точно и ясно определять направление тренда и потенциальные точки разворота. для MT4: https://www.mql5.com/en/market/product/193245 Информация о цене: Текущая цена является промо-ценой и может измениться по мере выхода предстоящих обновлений и новых функций. Бонусное предложение: Чтобы получить БЕСПЛАТНЫЙ авто-трейд советник Assistant EA для этого индикатора, пожалуйста, на
Neuro Poseidon - новый индикатор от Дарьи Резуевой. Он сочетает точные торговые сигналы с адаптивными уровнями TP/SL , в результате создавая максимально выгодные сделки! TO SWITCH TO   ENG   PLEASE CHOOSE IT IN THE UPPER-RIGHT CORNER OF THE WEBSITE Напишите мне и получите  Neuro Poseidon Assistant  в подарок для автоматизации вашей торговли! Что отличает его от других индикаторов? 1. Доказанная прибыльность на всех активах и таймфреймах 2. На графике присутствуют только подтвержденные сигналы н
M1 SNIPER   — это простая в использовании торговая система. Это стрелочный индикатор, разработанный для тайм фрейма M1. Индикатор можно использовать как отдельную систему для скальпинга на тайм фрейме M1, а также как часть вашей существующей торговой системы. Хотя эта торговая система была разработана специально для торговли на M1, ее можно использовать и с другими тайм фреймами. Первоначально я разработал этот метод для торговли XAUUSD и BTCUSD. Но я считаю этот метод полезным и для торговли на
Gann Made Easy   - это профессиональная, но при этом очень простая в применении Форекс система, основанная на лучших принципах торговли по методам господина У.Д. Ганна. Индикатор дает точные BUY/SELL сигналы, включающие в себя уровни Stop Loss и Take Profit. ПОЖАЛУЙСТА, СВЯЖИТЕСЬ СО МНОЙ ПОСЛЕ ПОКУПКИ, ЧТОБЫ ПОЛУЧИТЬ ТОРГОВЫЕ ИНСТРУКЦИИ И ОТЛИЧНЫЕ ДОПОЛНИТЕЛЬНЫЕ ИНДИКАТОРЫ БЕСПЛАТНО! Вероятно вы уже не раз слышали о торговли по методам Ганна. Как правило теория Ганна отпугивает от себя не только
Entry Points Pro — топ-1 индикатор по количеству отзывов (600 отзывов и 31 000 скачиваний обеих версий). Индикатор даёт самые перспективные точки входа в сделки без перерисовки на любых инструментах. Индикатор покажет заранее стрелкой точку входа в сделку, укажет цену входа и нарисует на графике уровень входа и стопа, а так же рассчитает рабочий лот под твой депозит и риск, а панель статистики поможет выбрать самый перспективный инструмент и таймфрейм .  Тебе остаётся поставить отложенный ордер
Adaptive Price Action Engine Купи индикатор — получи советник (EA) к нему бесплатно Самооптимизирующийся мульти-таймфреймовый анализ тренда и свечных моделей Рынок постоянно меняется — и не каждая модель Price Action имеет одинаковую ценность в разных рыночных режимах. Adaptive Price Action Engine создан для адаптации к изменяющимся рыночным условиям, объединяя трендовую структуру, мульти-таймфреймовый анализ, свечные модели и статистическую оптимизацию в единой аналитической системе. Два адапти
Currency Strength Wizard   — очень мощный индикатор, предоставляющий вам комплексное решение для успешной торговли. Индикатор рассчитывает силу той или иной форекс-пары, используя данные всех валют на нескольких тайм фреймах. Эти данные представлены в виде простых в использовании индексов валют и линий силы валют, которые вы можете использовать, чтобы увидеть силу той или иной валюты. Все, что вам нужно, это прикрепить индикатор к графику, на котором вы хотите торговать, и индикатор покажет вам
Каждый покупатель этого индикатора получает дополнительно Бесплатно: Авторскую утилиту "Bomber Utility", которая автоматически сопровождает каждю торговую операцию, устанавливает уровни Стоп Лосс и Тейк профит и закрывает сделки согласно правилам этой стратегии, Сет-файлы для настройки этого индикатора на различных активах, Сет-файлы для настройки Bomber Utility в режимы: "Минимум Риска", "Взвешенный Риск" и "Стратегия Выжидания", Пошаговый видео-мануал, который поможет вам быстро установить, н
Superhero
Ihor Otkydach
5 (3)
SUPERHERO индикатор - это мультивалютная торговая система, которая создана по принципу "Все включено". Индикатор самостоятельно анализирует рынок и дает сигналы когда открывать и когда закрывать сделки. Используются ордера Стоп Лосс и Тейк профит. Соотношение R:R = 1:1 Эта система может присылать на смартфон PUSH-уведомления, так что вы сможете делать сделки "на ходу" без привязки к ПК. Отлично подходит для Проп Фирм трейдинга. БОНУС ДЛЯ КАЖДОГО ПОКУПАТЕЛЯ: Каждый покупатель этого индикатора пол
Volatility Master for MetaTrader is a real-time dashboard tool that scans up to  50 symbols  to identify high-volatility , trending markets instantly. With bullish/bearish signals, customizable alerts, and a user-friendly interface, it helps you avoid range-bound conditions and focus on high-probability trades. Clarity leads to confidence. Trade confidently and protect your capital effectively with this powerful dashboard. We don't offer free or bonus indicators in exchange of reviews from you.
Trend Trading - это индикатор, предназначенный для получения максимальной прибыли от трендов, происходящих на рынке, путем определения времени отката и прорыва. Он находит торговые возможности, анализируя, что делает цена во время установленных тенденций. [ Руководство по установке | Руководство по обновлению | Устранение неполадок | FAQ | Все продукты ] Торгуйте на финансовых рынках с уверенностью и эффективностью Прибыль от устоявшихся тенденций без проволочек Признать прибыльные откаты, пр
IQ FX Gann Levels a precision trading indicator based on W.D. Gann’s square root methods . It plots real-time, non-repainting support and resistance levels to help traders confidently spot intraday and scalping opportunities with high accuracy. William Delbert Gann (W.D. Gann) was an exceptional market analyst, whose trading technique was based on a complex blend of mathematics, geometry, astrology, and ancient mathematics which proved to be extremely accurate. We don't offer free or bonus indic
RelicusRoad Pro: Квантовая Рыночная Операционная Система СКИДКА 70% ПОЖИЗНЕННЫЙ ДОСТУП (ОГРАНИЧЕНО) - ПРИСОЕДИНЯЙТЕСЬ К 2000+ ТРЕЙДЕРАМ Почему большинство трейдеров теряют деньги даже с «идеальными» индикаторами? Потому что они торгуют Единичными Концепциями в вакууме. Сигнал без контекста — это лотерея. Чтобы выигрывать стабильно, вам нужна КОНФЛЮЭНЦИЯ . RelicusRoad Pro — это не простой стрелочный индикатор. Это полная Количественная Рыночная Экосистема . Она отображает «Дорогу Справедливой Сто
First time on MetaTrader, introducing IQ Star Lines - an original Vedic Astrology based indicator. "Millionaires don't use astrology, billionaires do" . - J.P. Morgan, Legendary American financier and banker. We don't offer free or bonus indicators in exchange of reviews from you. You won't need any free products with this indicator to make it work. ;) Enjoy! Welcome to  the new and updated  IQ Star Lines , the ultimate fusion of ancient planetary harmonic cycles and modern quantitative trading.
Auto Optimized SpeedAngle — это система векторизации импульса институционального уровня, которая исключает подгонку под исторические данные (curve-fitting) за счет непрерывной форвард-оптимизации (Walk-Forward Optimization, WFO). Вместо того чтобы полагаться на статические входные параметры, которые теряют эффективность при смене рыночных режимов, индикатор динамически перекалибрует свои настройки, используя валидацию на вневыборочных данных (Out-of-Sample, OOS). Это гарантирует, что отображаемы
UZFX {SSS} Scalping Smart Signals v5.0 MT5 — это высокопроизводительный торговый индикатор без перерисовки, разработанный для скальперов, дейтрейдеров и свинг-трейдеров, которым требуются точные сигналы в режиме реального времени на быстро меняющихся рынках. Разработанный компанией (UZFX-LABS), этот индикатор сочетает в себе анализ ценового действия, подтверждение тренда и интеллектуальную фильтрацию для генерации высоковероятных сигналов на покупку и продажу, предупреждающих сигналов и возможно
M1 Quantum MT5
Hamed Dehgani
4.2 (10)
Торговые сигналы в реальном времени с использованием M1 Quantum: Сигнал  (Сделка выполнена автоматически с помощью Quantum Trade Assistant , бесплатно включённого в этот продукт.) Последние новости : Выпущена версия 1.64. Теперь для всех сделок Stop Loss размещается за соответствующими зонами поддержки/сопротивления. Функция Smart Close также была улучшена для повышения производительности EA в этой версии. С 9 августа live-сигнал работает на версии 1.64. План цен: Текущая цена: $169 (Предложени
Scalper Vault   — это профессиональная торговая система, которая дает вам все необходимое для успешного скальпинга. Этот индикатор представляет собой полную торговую систему, которую могут использовать трейдеры форекс и бинарных опционов. Рекомендуемый тайм фрейм М5. Система дает точные стрелочные сигналы в направлении тренда. Она также предоставляет вам сигналы выхода и рассчитывает рыночные уровни Ганна. Индикатор дает все типы оповещений, включая PUSH-уведомления. Пожалуйста, напишите мне пос
Shock Pullback
Suleiman Alhawamdah
5 (1)
Проще говоря, вы можете начать торговлю, когда рядом с текущей свечой начинают появляться белые цифры — так называемые «пипсы». Белые «пипсы» указывают на то, что сделка на покупку или продажу в данный момент активна и движется в правильном направлении, что обозначается их белым цветом. Когда движение белых пипсов прекращается и превращается в статичный зелёный цвет, это сигнализирует об окончании текущего импульса. Зелёный цвет цифр представляет собой общий заработанный профит в «пипсах», незав
Вот версия на русском языке, готовая для публикации в MQL5 Market: Volume Profile Multiple — Множественные профили объёма с буферами для алгоритмической торговли Устали строить Volume Profile блок за блоком, перерисовывая и пересчитывая его при каждой смене таймфрейма? Volume Profile Multiple автоматически строит на графике несколько последовательных профилей объёма, показывая, где реально находился институциональный интерес в каждом отрезке рынка — а не только в последнем видимом диапазоне. Что
Presenting one-of-a-kind Gann Indicator for XAUUSD IQ Gold Gann Levels is a non-repainting, precision tool designed exclusively for XAUUSD intraday trading. It uses W.D. Gann’s square root method to plot real-time support and resistance levels, helping traders spot high-probability entries with confidence and clarity. William Delbert Gann (W.D. Gann) was an exceptional market analyst whose trading technique was based on a complex blend of mathematics, geometry, astrology, and ancient calculation
Сложно найти и дефицит по частоте, дивергенции являются одним из самых надежных торговых сценариев. Этот индикатор автоматически находит и сканирует регулярные и скрытые расхождения, используя ваш любимый осциллятор. [ Руководство по установке | Руководство по обновлению | Устранение неполадок | FAQ | Все продукты ] Легко торговать Находит регулярные и скрытые расхождения Поддерживает много известных генераторов Реализует торговые сигналы на основе прорывов Отображает подходящие уровни стоп-
Azimuth Pro
Ottaviano De Cicco
5 (7)
Azimuth Pro V2: Синтетический фрактальный структурный анализ и подтверждённые входы для MT5 Обзор Azimuth Pro — многоуровневый индикатор свинговой структуры от Merkava Labs . Четыре вложенных уровня свингов, привязанный к свингам VWAP, определение ABC-паттернов, трёхтаймфреймная структурная фильтрация и подтверждённые входы на закрытой свече — один график, один рабочий процесс от микро-свингов до макро-циклов. Это не слепой сигнальный продукт. Это рабочий процесс, основанный на структуре, для т
Индикатор SyntheticaFX Scalper Pro Индикатор SyntheticaFX Scalper Pro — это универсальный и удобный инструмент, разработанный для помощи трейдерам в определении точек входа с высокой точностью на различных таймфреймах и для всех валютных пар. Этот индикатор предоставляет четкие визуальные сигналы на графике, а также рекомендуемые уровни стоп-лосса (SL) и тейк-профита (TP), что упрощает планирование сделок с уверенностью. Благодаря встроенной панели управления индикатор SyntheticaFX Scalper Pro
Простыми словами Это индикатор, который объединяет двух экспертов — RSI и MACD — в одну систему. Вместо того чтобы смотреть на два разных графика и гадать, он сам принимает решение: когда оба индикатора согласны, он рисует стрелку (покупка или продажа). Главное: стрелки не перерисовываются . Появилась — значит, останется на месте. Можно спокойно тестировать и торговать вживую. В чём суть «комбо» Обычно трейдеры смотрят на RSI (силу движения) и MACD (направление тренда) по отдельности. Здесь они
Gartley Hunter Multi - Индикатор для поиска гармонических моделей одовременно на десятках торговых инструментов и на всех возможных ценовых диапазонах. Инструкция/Мануал ( Обязательно читайте перед приобретением ) | Версия для МТ4 Преимущества 1. Паттерны: Гартли, Бабочка, Акула, Краб. Летучая мышь, Альтернативная летучая мышь, Глубокий краб, Cypher 2. Одновременный поиск паттернов на десятках торговых инструментов и на всех возможных таймфреймах 3. Поиск паттернов всех возможных размеров. От са
GEM Signal Pro GEM Signal Pro — это трендовый индикатор для MetaTrader 5, созданный для трейдеров, которым нужны более понятные сигналы, более структурированные торговые сетапы и более практичное управление рисками прямо на графике. Вместо того чтобы показывать только простую стрелку, GEM Signal Pro помогает представить всю торговую идею в более наглядной и удобной форме. Когда условия подтверждены, индикатор может отображать на графике цену входа, stop loss и цели take profit, помогая трейдеру
Btmm state engine pro
Garry James Goodchild
5 (4)
BTMM State Engine Pro by G-Labs — Beat The Market Maker indicator for MetaTrader 5. Asian session range, London and New York kill zones, level progression (L1/L2/L3), peak formation detection (PFH/PFL), entry signals, and a multi-pair scanner from one chart. Stop scanning charts one pair at a time. The State Engine tracks the BTMM daily cycle automatically — Asian box, room boundaries, level blocks, peak formations, and filtered entries — while the scanner dashboard shows level, peak status, d
SR Liquidity   — это торговый индикатор, предназначенный для выявления скрытых зон, где концентрируется рыночная ликвидность и наблюдается наиболее сильная реакция цены. Эти особые зоны ликвидности выступают в качестве мощных уровней поддержки и сопротивления, предоставляя вам четкую картину того, где с наибольшей вероятностью произойдет разворот рынка. Вместо построения стандартных линий поддержки и сопротивления, индикатор SR Liquidity анализирует реальное поведение цены, выявляя зоны концентр
ARICoin is a powerful trading companion designed to generate high-probability entry signals with dynamic TP/SL/DP levels based on volatility. Built-in performance tracking shows win/loss stats, PP1/PP2 hits, and success rates all updated live. Key Features: Buy/Sell signals with adaptive volatility bands Real-time TP/SL/DP levels based on ATR Built-in MA Filter with optional ATR/StdDev volatility Performance stats panel (Success, Profit/Loss, PP1/PP2) Alerts via popup, sound, push, or email Cust
Другие продукты этого автора
Smart Chandelier Exit  Smart Chandelier Exit is an adaptive trailing-stop and trend-direction indicator. It plots a multi-layer ratchet stop line that follows price: green below price in an uptrend, red above price in a downtrend. The line only ever ratchets in the trend's favor, never against it, so it doubles as a mechanical trailing stop and a clear trend-state signal. What makes it smart is the built-in Pearson R trend-quality filter. A raw stop line tells you where the stop is; the Pearson
FREE
Quant Trend Cloud A cloud that is a regime, not a thread: the band between two slow adaptive lines. No arrows and no dots - the colour says which way the regime stands, and the brightness says whether the candle and the fast line stand clear of the band on that bar. Version 1.0. Release notes, chart examples and new product announcements are posted on the TrendTower channel: https://www.mql5.com/en/channels/trendtower What It Is The cloud is the band between Kaufman's adaptive average and VIDYA.
FREE
Refine OBV  Refine OBV measures cumulative volume flow read against its own adaptive signal line with a color-coded spread and non-repainting divergence detection. Raw On Balance Volume answers one question: is volume being credited to the buyers or the sellers? While useful, raw OBV is a single wandering line with no reference point. Refine OBV adds an adaptive EMA of the flow itself as a reference line. The distance between the flow and its signal line (the spread) is rendered as a color-coded
FREE
Smart Exit EA
Bugra Kaan Yildirim
Smart Exit EA — Ride the Trend, Skip the Chop Smart Exit EA follows a trend with an adaptive ATR trailing line and stays in the move until the trend really turns. It is built for two problems every trend trader knows: getting shaken out of a good trade too early, and getting chopped up in a sideways market. Release notes, chart examples and new product announcements are posted on the TrendTower channel:   https://www.mql5.com/en/channels/trendtower What It Does Rides trends longer.   The trailin
FREE
Trix Trend algoteknik · MetaTrader 5 Indicator Manual Overview Trix Trend is a momentum oscillator based on TRIX — the rate of change of a triple-smoothed exponential moving average of price. Triple smoothing removes most of the short-term noise, so the oscillator reacts to the underlying momentum of the move rather than to every small wiggle, while staying more responsive than a simple long moving average. The indicator draws a slope-colored TRIX line, a weighted signal line, a zero line, and t
FREE
SVS Assistant
Bugra Kaan Yildirim
SVS Assistant SVS Assistant is the execution half of Smart Volatility Squeeze MT5. It carries out the orders you request from that indicator's 1-Click Trading Desk, applies your risk rules to them, and manages the resulting positions. It is published free of charge. Please read this before downloading: it does not analyse the market and it produces no signals of its own. Without the Smart Volatility Squeeze indicator running on the same chart there is nothing for it to listen to, and it will do
FREE
Smart Volatility Squeeze MT5 Smart Volatility Squeeze MT5 is a volatility compression and momentum expansion indicator for MetaTrader 5. It builds on John Carter's Volatility Squeeze framework and extends the usual single-tier squeeze into three compression tiers, so you can see not only whether the market is compressed but how tightly it is compressed before it expands. The indicator opens in a separate window and draws two elements: a linear regression momentum histogram and a row of coloured
Quant Desk Pro
Bugra Kaan Yildirim
Quant Desk Pro An R-native trade manager for MetaTrader 5.   It manages the trades you have already opened: it measures what each one is really risking, protects it, scales out of it on a plan you set, trails what is left, and stops the whole book when the day has gone far enough wrong. Read this first.   Quant Desk Pro does not open trades and has no signal. And it ships in   VIEW ONLY : it will not send a single order until you set   I understand the risks   to true in the inputs. Until you do
Quant Key Levels, version 1.0. The reference levels a discretionary trader actually works from, on one chart and in one visual language. Eleven families, each on its own switch, and nothing on the chart that a level does not earn. What separates it from a pivot pack is not the number of families. It is that the things most level tools assume, this one measures. How far your broker's clock sits from UTC, measured out of your own terminal rather than typed into a box. Where an exchange actually op
Smart Chandelier Exit EA Smart Chandelier Exit EA is the Expert Advisor for the Smart Chandelier Exit indicator. It runs the indicator's chandelier engine by itself, with the same formula, the same default settings and the same fake-flip confirmation, and turns the confirmed flips into trades. A flip is traded only when it agrees with the higher timeframe, and every position carries a stop on the broker's server that follows the chandelier line and is never loosened. By default there is no fixed
Фильтр:
Нет отзывов
Ответ на отзыв