Trend Regime Line
- Indicadores
- Versão: 1.1
- Atualizado: 24 setembro 2026
- Ativações: 20

Trend Regime Line
Version 1.1 · algoteknik
What This Indicator Is
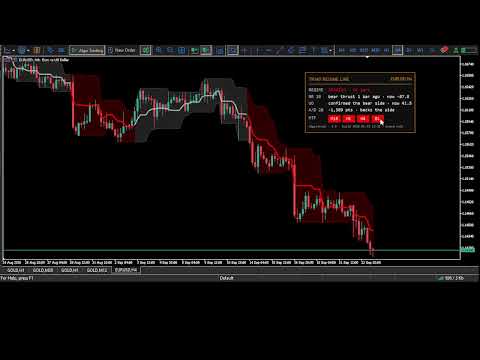
Trend Regime Line reads the trend through a triad: three Larry Williams tools that each answer their own question, and one line on the price chart that is coloured only when the answers fit together. Williams %R says which side price is thrusting to, the Ultimate Oscillator whether momentum confirms that side, and Williams Accumulation/Distribution whether buying or selling pressure still backs it. Green means the triad agrees on a bullish side, red on a bearish one, and grey that it does not agree or has not confirmed a new side yet. The line itself is simple on purpose: it is the middle of the highest high and the lowest low of the last ten bars, the price at which Williams %R reads -50. What the indicator adds is the colour, and every rule behind the colour is written in this manual and adjustable in the dialog. The colour can be shown three ways, from a shaded band with a panel to painted candles, as described below.
Every default is Larry Williams' own value: %R over 10 bars with its zones at -10 and -90, and the Ultimate Oscillator over 7, 14 and 28 bars weighted 4, 2 and 1.
Release notes, chart examples and new product announcements are posted on the TrendTower channel: https://www.mql5.com/en/channels/trendtower
How The Triad Decides The Colour
The first of the three sets the side: Williams' %R thrust. When a bar closes with %R at -10 or higher, near the top of its ten-bar range, the side turns bullish. When a bar closes with %R at -90 or lower, it turns bearish. Between the two zones the side does not change, so an ordinary pullback inside a move does not flip it.
The second, the Ultimate Oscillator, confirms a new side. After a flip the line stays grey until the oscillator closes above 50 for a bullish side, or below 50 for a bearish one. Usually this happens on the same bar, because a close at the edge of the range tends to carry the oscillator with it. When it does not, the grey says the thrust has no momentum behind it yet.
The third, Williams Accumulation/Distribution, is the second opinion. Its change over the last 28 bars, the Ultimate Oscillator's slow period, is compared with the side. When it turns against the side the line goes grey, and it stays grey until %R thrusts again in the side's direction with Accumulation/Distribution back in favour. A new high that price makes and Accumulation/Distribution does not is Williams' classic warning, and this is how it shows on the line.
Only closed bars are read. The bar that is still open keeps the colour of the last closed bar and only the line's value moves with it, so a colour on the chart is in the same place tomorrow.
Reading The Line
A strong trend stays one colour. %R keeps closing near the edge of its range, the oscillator stays on the same side and accumulation keeps pace. Williams was clear that an overbought reading in a strong market is strength, not a reason to sell, and the line does not turn on it.
A top that is being distributed usually shows as grey before it shows as red: price is still making highs, but Accumulation/Distribution has stopped following. A bottom being accumulated is the mirror image. A flip straight from green to red with no grey between is a fast reversal, where the new side was confirmed on the bar it appeared.
Grey is not a third direction. It means the triad disagrees, and a chart that is grey for long stretches is a market without a side.
The Three Views
The first setting chooses how the colour is shown. Regime Dashboard, the default, shades the %R range itself, the band from the lowest low to the highest high of the last ten bars whose middle is the line, in the colour of the regime, draws the candles over it and adds a panel. Regime Cloud shows the same band and the line without the panel. Paint Bars colours the candles instead: every candle takes the regime's colour, hollow when the bar closed up and filled when it closed down.
MetaTrader 5 draws an indicator's shading over the chart's candles and cannot make it transparent, and every candle lies inside its own ten-bar range. So the band is a tint: the regime colour mixed toward the chart's background, as far as the Cloud strength setting says. The candles are then drawn again on top of it, in the chart's own candle colours, and follow them when they are changed; they are drawn as candles even when the chart shows bars or a line. Where the colour changes, the band is split along a diagonal between the old colour and the new one. Paint Bars needs the chart's Chart on foreground option to be off, which is MetaTrader's default: with it on, the chart draws its own candles over everything the indicator draws, and the indicator says so once in the journal.
The panel reads the last closed bar and says which member of the triad holds the colour where it is, in the rule's own terms rather than as bare readings. It gives the regime and how many bars it has lasted, the %R thrust that set the side and how long ago it was, whether the Ultimate Oscillator has confirmed the side or is still waiting for its close beyond the midline, and whether Accumulation/Distribution backs the side or what keeps the line grey when it does not. With the A marker shown, a row gives the last A signal. Four squares show the regime on four timeframes, M15, H1, H4 and D1 by default. Each is the colour a chart of that timeframe shows on its last closed bar, computed over that timeframe's last 1000 bars, or ten times the longest period if that is more; on every closed bar of the datasets described below, a hundred bars were already enough to give the same colour as the full history. A square stays empty until its timeframe's history has loaded. The panel can be anchored to any corner or dragged with the mouse, and it stays where it was left.
What The Measurements Say
The figures below were computed on 9 datasets (GOLD M15, GOLD H1, GOLD H4, EURUSD H1, EURUSD H4, XAUUSD D1, EURUSD D1, US100 H1, US100 H4) by the measurement script that ships with the source. They grade the colour against the price legs as they are known in hindsight, where a leg ends when price moves three average true ranges against its extreme. Hindsight is used only to grade the line; the indicator never sees it. They describe how the line behaved, and they are not a forecast of what it will do.
On coloured bars, the colour matched the leg in progress on 67% to 78% of bars, depending on the dataset. The line was grey on 31% to 40% of bars.
The colour changes 77 to 99 times per 1,000 bars, and a colour lasts a median of 7 to 9 bars. Between 18% and 28% of colour runs last only one or two bars. Some of these are a one-bar grey between two opposite colours, which is a real transition. Others are brief flashes when the Accumulation/Distribution change sits close to zero at a thrust. They are left visible, because hiding them would need a threshold that has no Williams value behind it.
The A Marker
An optional marker, off by default, shows Williams' Ultimate Oscillator divergence trigger. The setup is his: price makes a lower low while the oscillator makes a higher low, the first oscillator low is under 30, and the two lows are 4 to 60 bars apart. The signal comes when the oscillator closes above the highest oscillator reading between the two lows. The sell setup mirrors it, with the first high above 70. Lows and highs are Williams' intermediate swings, which are known only once the next swing has formed, so a marker appears a few bars after the low it refers to. A filled arrow below the bar marks a buy trigger and a filled arrow above the bar a sell trigger.
Measured on the same datasets, the leg that followed an A signal ran its way 72% of the time, over 472 signals. Ten bars later the average move was -0.02 average true ranges, so the move itself showed no edge. The marker is there to watch the moment Williams' rule fires next to the line, not as a trade signal.
Alerts
The indicator can raise an alert when the colour turns, as a terminal popup, a push notification or both. Both are off by default. An alert is raised only for a bar that closed while the indicator was attached, so attaching it to a chart does not replay turns that happened before. If several bars close at once, for example after a reconnect, every turn among them goes into a single message that says how many there were and which was the last, because MetaTrader drops push notifications sent faster than two a second or ten a minute. Push notifications need a MetaQuotes ID in the terminal settings; if one cannot be sent, the indicator writes that once to the journal.
For Experts: iCustom
Every value the indicator computes is published and can be read with iCustom. The buffer indices are:
0 to 5: the cloud's three fillings, for drawing only
6 to 11: the seams over the cloud's colour changes, for drawing only
12 and 13: the %R range high and its colour index
14 and 15: the %R range low and its colour index
16 to 27: the candles, for drawing only
28: the line value
29: colour index, 0 bullish, 1 bearish, 2 neutral
30: A buy marker at the bar's low, empty unless the marker is shown
31: A sell marker at the bar's high, empty unless the marker is shown
32: regime, +1 bullish, 0 neutral, -1 bearish
33: %R thrust side, +1 or -1, and 0 before the first thrust
34: A signal on this bar, +1, -1 or 0, published whether or not the marker is shown
35: B signal on this bar, +1, -1 or 0
36: Williams Accumulation/Distribution change over the momentum period, in points
37: Williams %R
38: Ultimate Oscillator
39: Williams Accumulation/Distribution in points; its level depends on how much history is loaded, and only its changes are used
An expert that only reads the buffers has no use for the panel: passing the Regime Cloud view as the first parameter leaves it out.
The B signal in buffer 35 is Williams' %R pullback timing inside the Accumulation/Distribution swing bias: %R leaving -90 upward when the bias is up, or -10 downward when it is down, with a five-bar wait after a touch of -100 or 0. It is published for research and is not drawn. Measured on the same datasets, the leg that followed ran against it about two times in three: buy signals ran their way 34% of the time over 3756 signals, and sell signals 29% of the time over 4266.
What Has No Setting Of Its Own
A few behaviours are decided rather than exposed. The five-bar wait after %R touches -100 or 0, and the -95 and -5 levels that end it, are Williams' own. Buying pressure, true range and the Accumulation/Distribution step are counted in whole points, so the oscillator and momentum windows are exact sums: the same bars give the same values whatever history is loaded, and a bar costs the same work whatever the periods. The %R range is rescanned only when the bar leaving the window held its high or its low. The first bars of the chart, up to the longest period, carry no line while the indicator warms up. The cloud's edges are drawn at twice the cloud's strength. The panel is the only thing drawn as chart objects: they are removed with the indicator, and any that a crash leaves behind are cleared the next time it starts. Two copies can share a chart, for example a Regime Dashboard and a Paint Bars; when one restarts and clears the other's panel with the leftovers, that panel draws itself again within a second.
Settings Reference
The labels below are the labels in the properties dialog, in the order the dialog shows them, with the default each one ships with.
1. VIEW
View — default: Regime Dashboard (cloud, candles, panel, MTF)
Cloud strength (percent toward the regime colour, 0 = no cloud) — default: 20
2. WILLIAMS %R
%R period; the line is the middle of this range (Williams: 10) — default: 10
Top zone: a close here turns the side bullish (Williams: -10) — default: -10.0
Bottom zone: a close here turns the side bearish (Williams: -90) — default: -90.0
3. ULTIMATE OSCILLATOR
Fast period (Williams: 7) — default: 7
Middle period (Williams: 14) — default: 14
Slow period (Williams: 28) — default: 28
Fast weight (Williams: 4) — default: 4.0
Middle weight (Williams: 2) — default: 2.0
Slow weight (Williams: 1) — default: 1.0
Midline: a new side is shown once UO closes beyond it (Williams: 50) — default: 50.0
4. WILLIAMS A/D
Momentum period: A/D moving against the side greys it (28 = UO slow) — default: 28
5. LINE AND COLOURS
Bullish colour — default: LimeGreen
Bearish colour — default: Red
Neutral colour — default: DarkGray
Line width (1-5) — default: 3
6. PANEL (Regime Dashboard view)
Panel corner — default: Top left
Panel distance from that corner, across — default: 12
Panel distance from that corner, down — default: 22
Panel text size (7-16) — default: 9
Let the panel be dragged with the mouse — default: true
Timeframe square 1 — default: M15
Timeframe square 2 — default: H1
Timeframe square 3 — default: H4
Timeframe square 4 — default: D1
7. UO DIVERGENCE MARKER (A)
Show the A signal: Williams' UO divergence trigger — default: false
A buy setup: first UO low under (Williams: 30) — default: 30.0
A sell setup: first UO high over (Williams: 70) — default: 70.0
A: fewest bars between the two swings — default: 4
A: most bars between the two swings — default: 60
8. ALERTS
Alert when the colour turns on a closed bar (popup) — default: false
The same alert, pushed to the phone — default: false
Version History
1.1: the indicator carries its Market name, Trend Regime Line, everywhere: in the indicator list, on the panel, and in its alerts and journal messages. The calculation, the drawing and the settings are unchanged, and so is every value published for iCustom.
1.0: first release.
About The Author
Published by algoteknik. Other products and contact details are on the seller profile: https://www.mql5.com/en/users/bugraky123
Questions, bug reports and feature requests are welcome on the TrendTower channel: https://www.mql5.com/en/channels/trendtower
Disclaimer
This is an indicator for analysis and decision support. It does not place trades. Always test thoroughly before using any tool in live trading. Trading involves risk. The colour is a description of what the market has done, not a forecast of what it will do.
algoteknik
Support, updates and every other product: mql5.com/en/users/bugraky123
Product channel: mql5.com/en/channels/trendtower
Trend Regime Line version 1.1