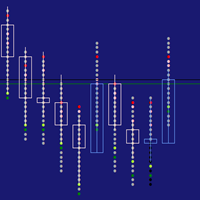
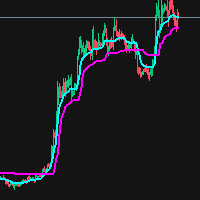
Quant Key Levels

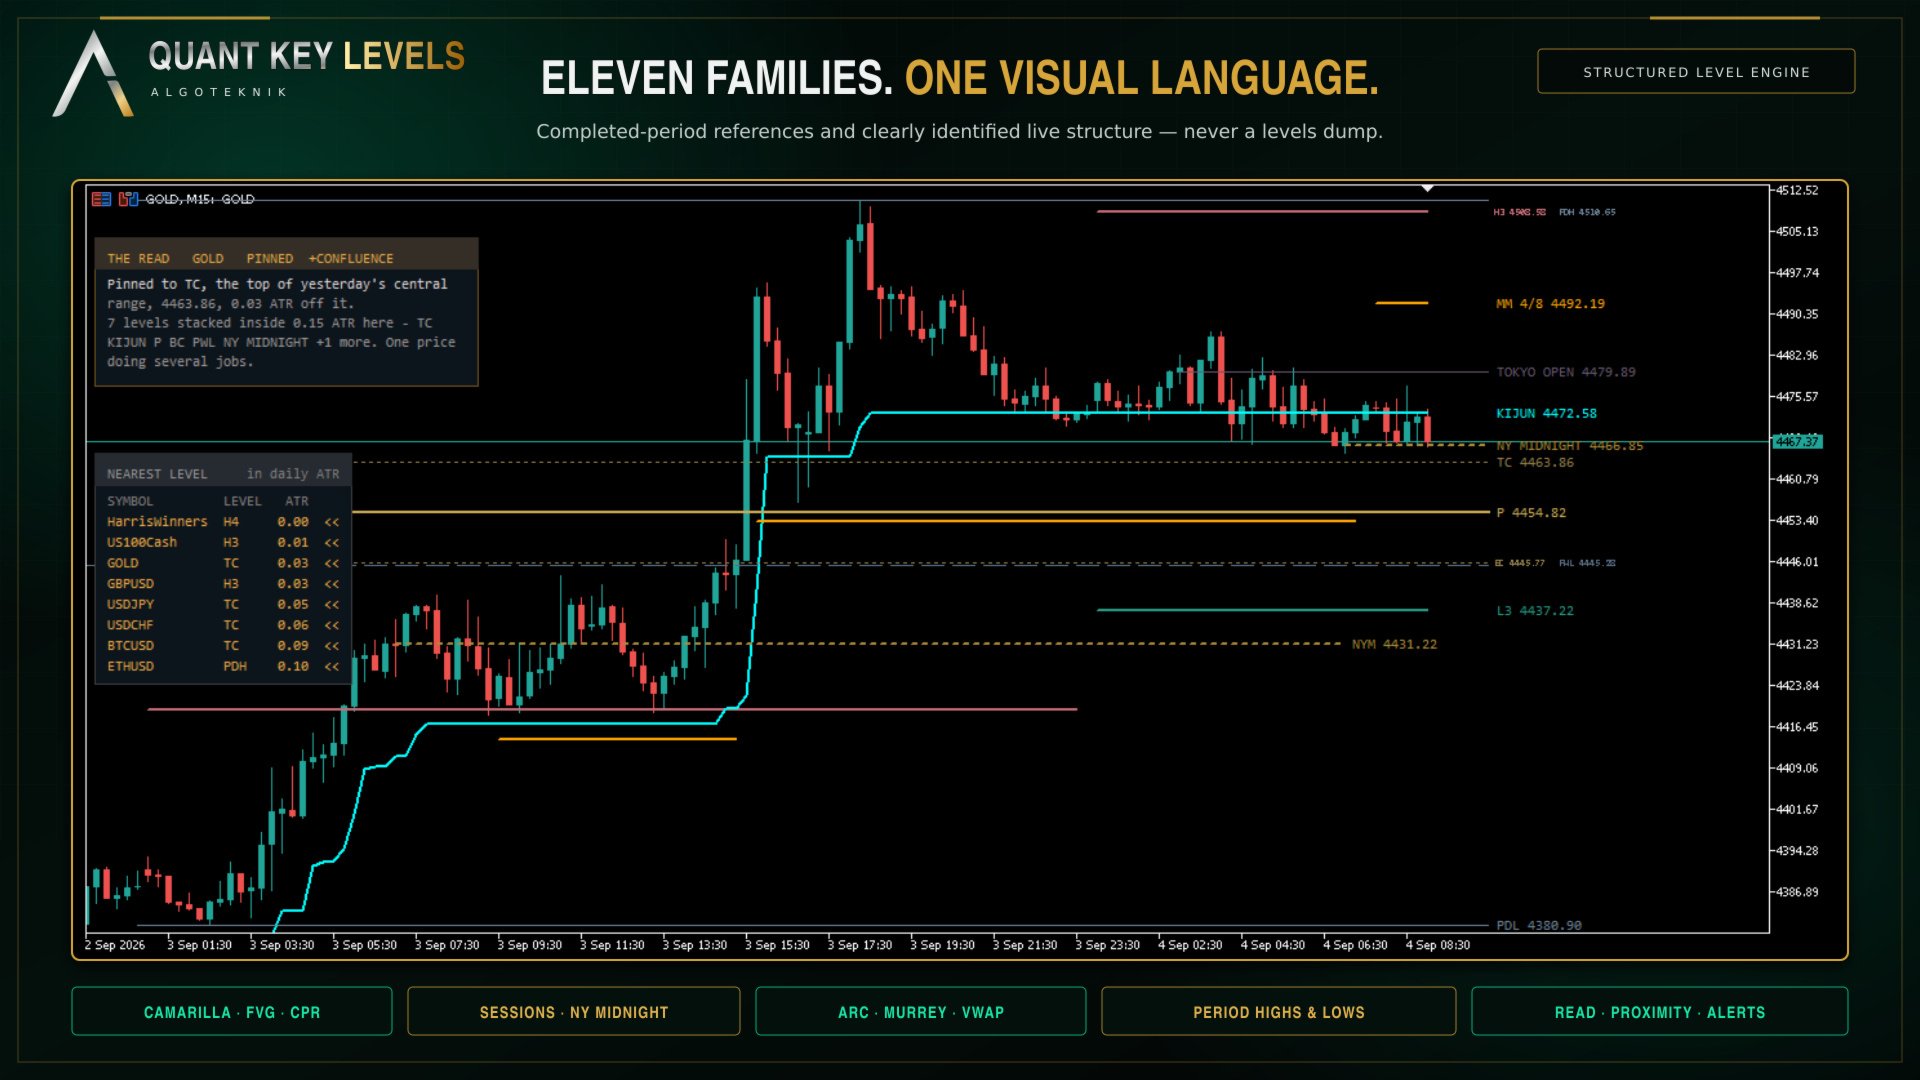
Quant Key Levels, version 1.0. The reference levels a discretionary trader actually works from, on one chart and in one visual language. Eleven families, each on its own switch, and nothing on the chart that a level does not earn.

What separates it from a pivot pack is not the number of families. It is that the things most level tools assume, this one measures. How far your broker's clock sits from UTC, measured out of your own terminal rather than typed into a box. Where an exchange actually opens, to the minute, on that exchange's own daylight saving calendar. How wide a pivot range is, in the symbol's own average day rather than in points that mean nothing across instruments. And what it measures it shows you: the offset goes in the journal and optionally on the chart, the range width is written on its label, the distance to the nearest level is a number you can read.

Every level is defined from a period that has already closed, so once it is drawn it does not move. There is exactly one exception and it is marked as such, today's running high and low, which is a live range by definition. Where the numbers can be checked against something you already own, they are: the Camarilla family matches the Camarilla Channel that ships with MetaTrader 5, value for value, on the same chart.

Release notes, chart examples and new product announcements are posted on the TrendTower channel: https://www.mql5.com/en/channels/trendtower

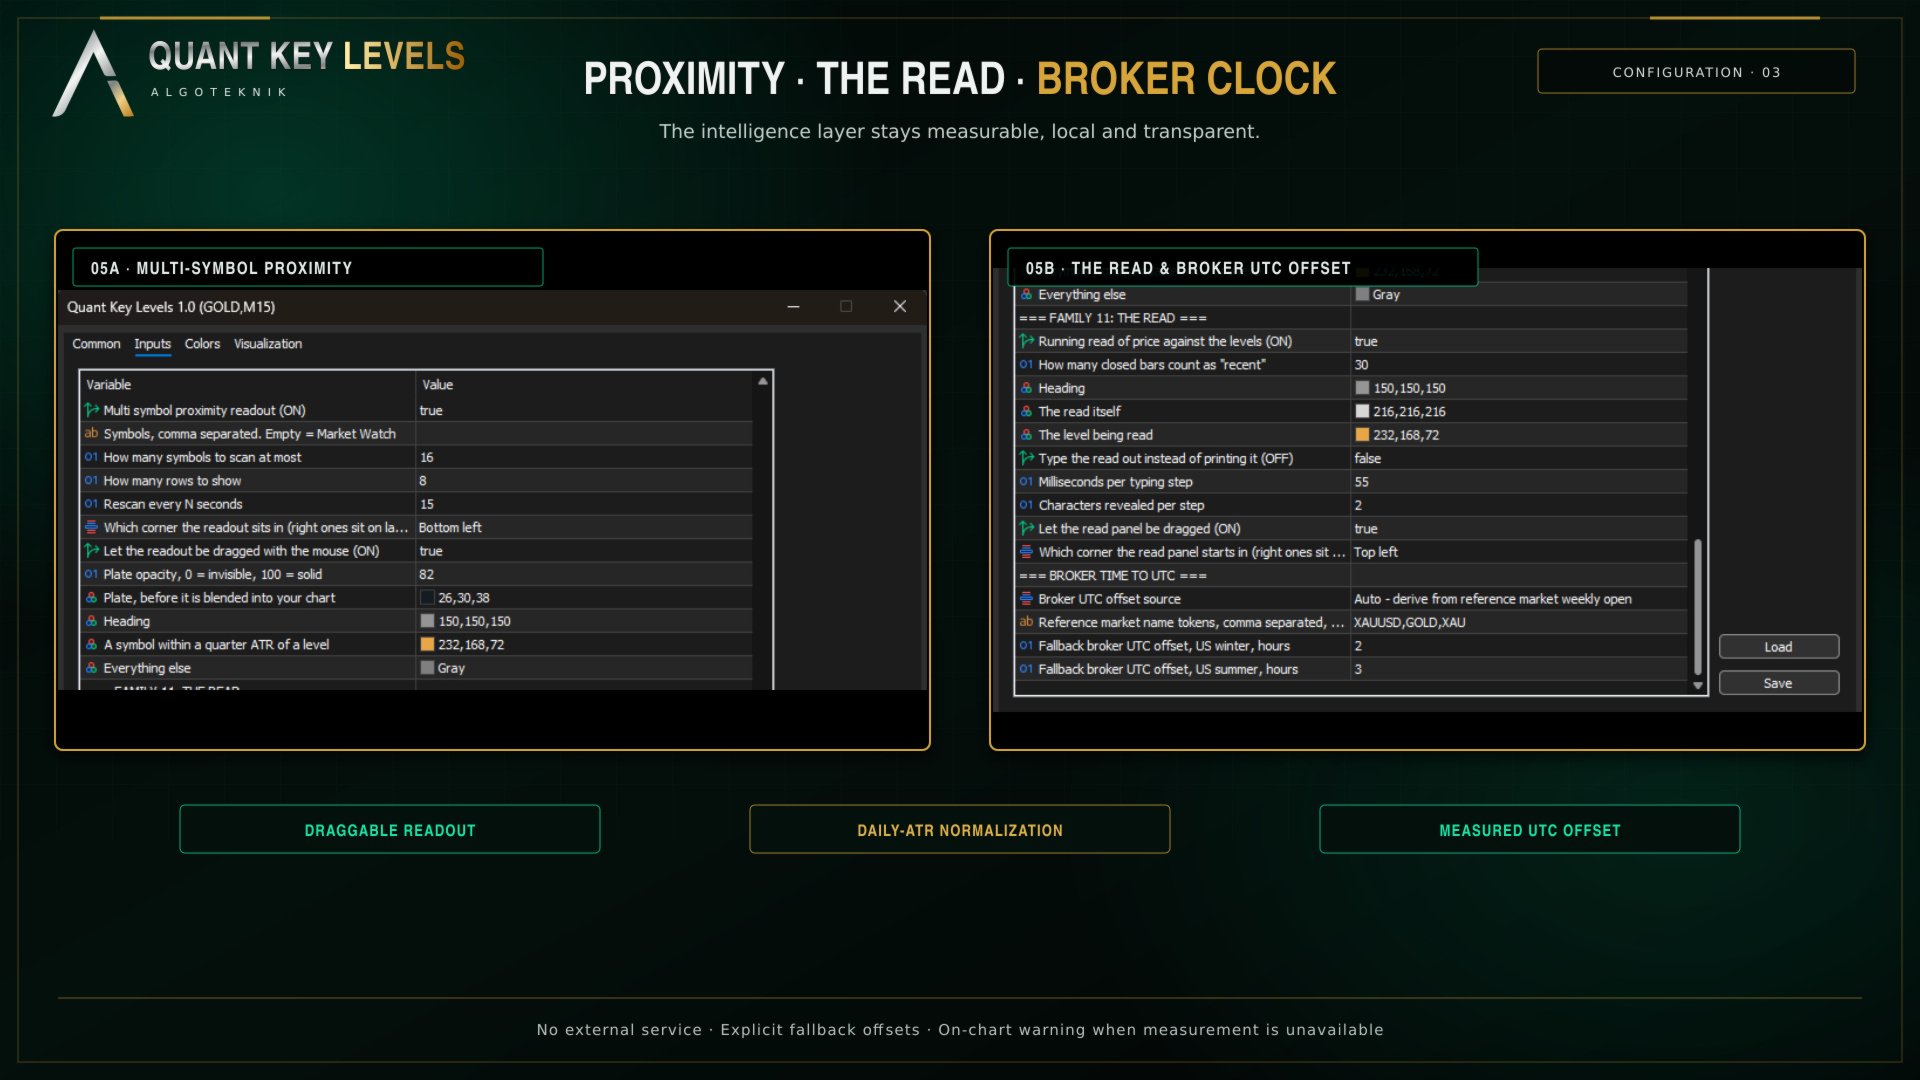
The broker clock is measured, not typed in

Three families are built on one number. The true New York midnight open, the six session levels and both daylight saving calendars all run off the broker's distance from UTC. Most level indicators ask you for it, or take it from the server offset, and either way it is wrong twice a year and wrong again when you change broker.

Here it is solved from data. The indicator reads the weekly opening bar of a reference market out of your own terminal and finds the single whole hour offset that puts that opening on Sunday at its known UTC time. There is no internet request, no external service and no library to install. The chart's own symbol is deliberately not used as the anchor: many brokers trim foreign exchange to broker midnight, and that silently produces an offset one hour wrong, so a continuously traded instrument is used and gold is the default. The name tokens searched for are an input.

The answer is reported in the journal at start-up and can be shown on the chart. When it cannot be measured a warning appears that cannot be switched off, because a wrong offset puts those levels on wrong prices while the chart still looks entirely reasonable. In the Strategy Tester, where only the tested symbol is loaded and the reference is usually missing, it says that too, and falls back to manual winter and summer offsets you can set.

Real exchange hours, and two daylight saving calendars

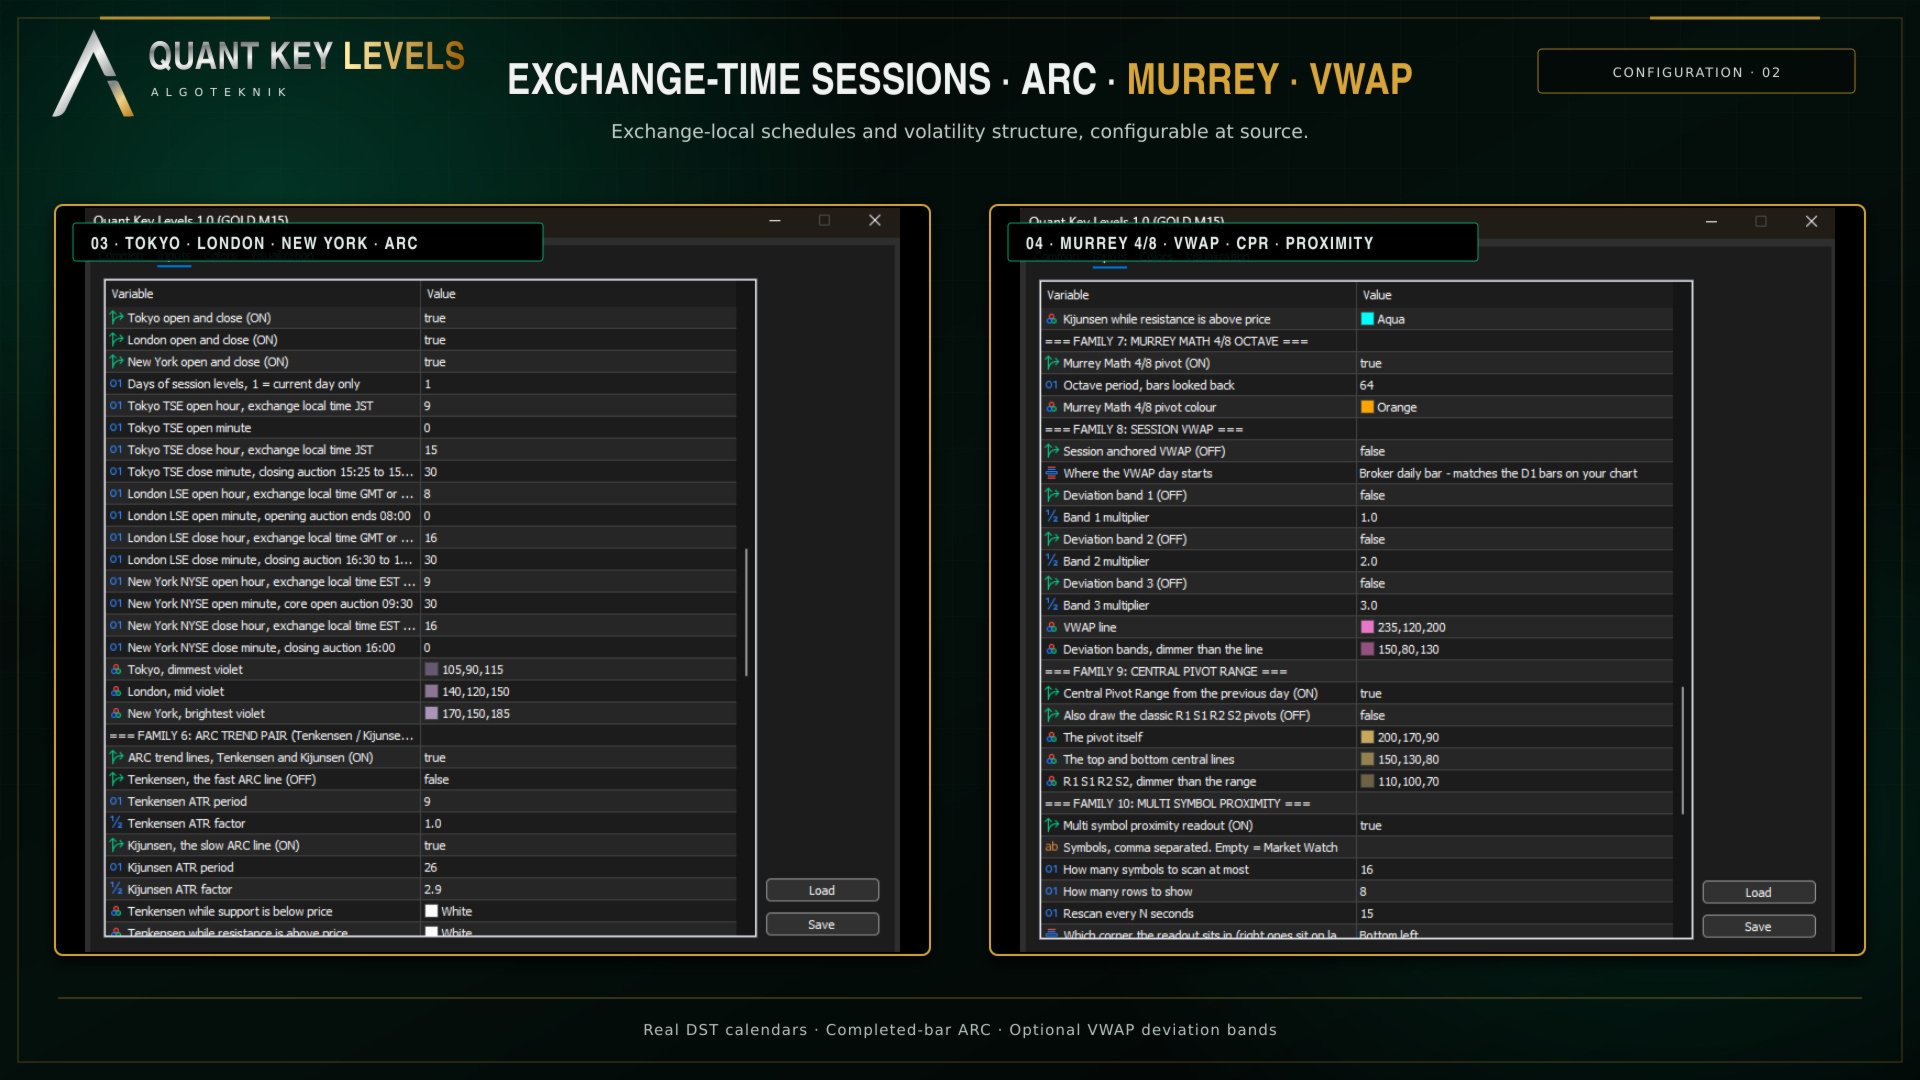
Six price levels, not shaded ranges: the open and the close of Tokyo, London and New York. These are not the rounded 08:00 to 17:00 blocks most session tools draw. They are the published trading hours of the three exchanges, to the minute. Tokyo runs 09:00 to 15:30 JST, with a closing auction from 15:25 that sets the official close, a 15:30 close that has been in force since November 2024, and no daylight saving anywhere in Japan, so it is 00:00 to 06:30 UTC every day of the year. London runs 08:00 to 16:30 London, with an opening auction ending at 08:00 and a closing auction from 16:30, which is 07:00 to 15:30 UTC on British Summer Time and 08:00 to 16:30 UTC on Greenwich Mean Time. New York runs 09:30 to 16:00 Eastern, the core open auction at 09:30 rather than 09:00, which is 13:30 to 20:00 UTC on Eastern Daylight Time and 14:30 to 21:00 UTC on Eastern Standard Time.

Every one of those times is entered as the exchange's own local time, hour and minute, exactly as that exchange publishes it. You never type a UTC number and you never type a summer variant and a winter variant: the conversion and the changeover are done for you, so nothing has to be re-entered twice a year. Change the local times if your working definition of a session differs and the UTC placement and the daylight saving shift stay correct on their own. Each level's tooltip shows both clocks, the UTC instant and the exchange local time with the zone in force that day, so you can check the placement without doing the arithmetic.

The two zones do not switch on the same weekend. In late October the United Kingdom has already fallen back while the United States has not, and for that week London and New York shift on different days. Each zone follows its own calendar here, so that week is handled correctly rather than smoothed over with one shared offset. Open is drawn solid and close dash dot in one violet family, so you can tell an open from a close by pattern alone. A boundary that has not happened yet draws nothing at all, and the close level appears only once the session has actually closed.

One unit: the symbol's own daily ATR

Distance in points does not travel. Forty points is nothing on gold and most of a day on EURUSD, so a number that is supposed to tell you how close price is to a level has to be normalised before it means anything. Everything in this product that reports a distance reports it in that symbol's own daily average true range, and that one decision is what lets a gold row and a EURUSD row sit in the same table and be read against each other.

The same unit measures the Central Pivot Range. P, TC and BC come from yesterday's daily bar, and the reading is the width between TC and BC rather than the lines themselves: narrow says yesterday closed near its own midpoint and the market did not decide, wide says it trended. That width is written on the label as a number, as in “TC 0.42 ATR wide”, so a narrow day is a measurement rather than an impression. TC is not always above BC. When yesterday closed below its own midpoint the pair inverts, and that flip is information, so both are drawn where they fall rather than sorted into a fixed order. The classic R1 S1 R2 S2 ride on the same pivot and ship off, because this family exists for the range.

A running read of the chart, in the language a desk would use

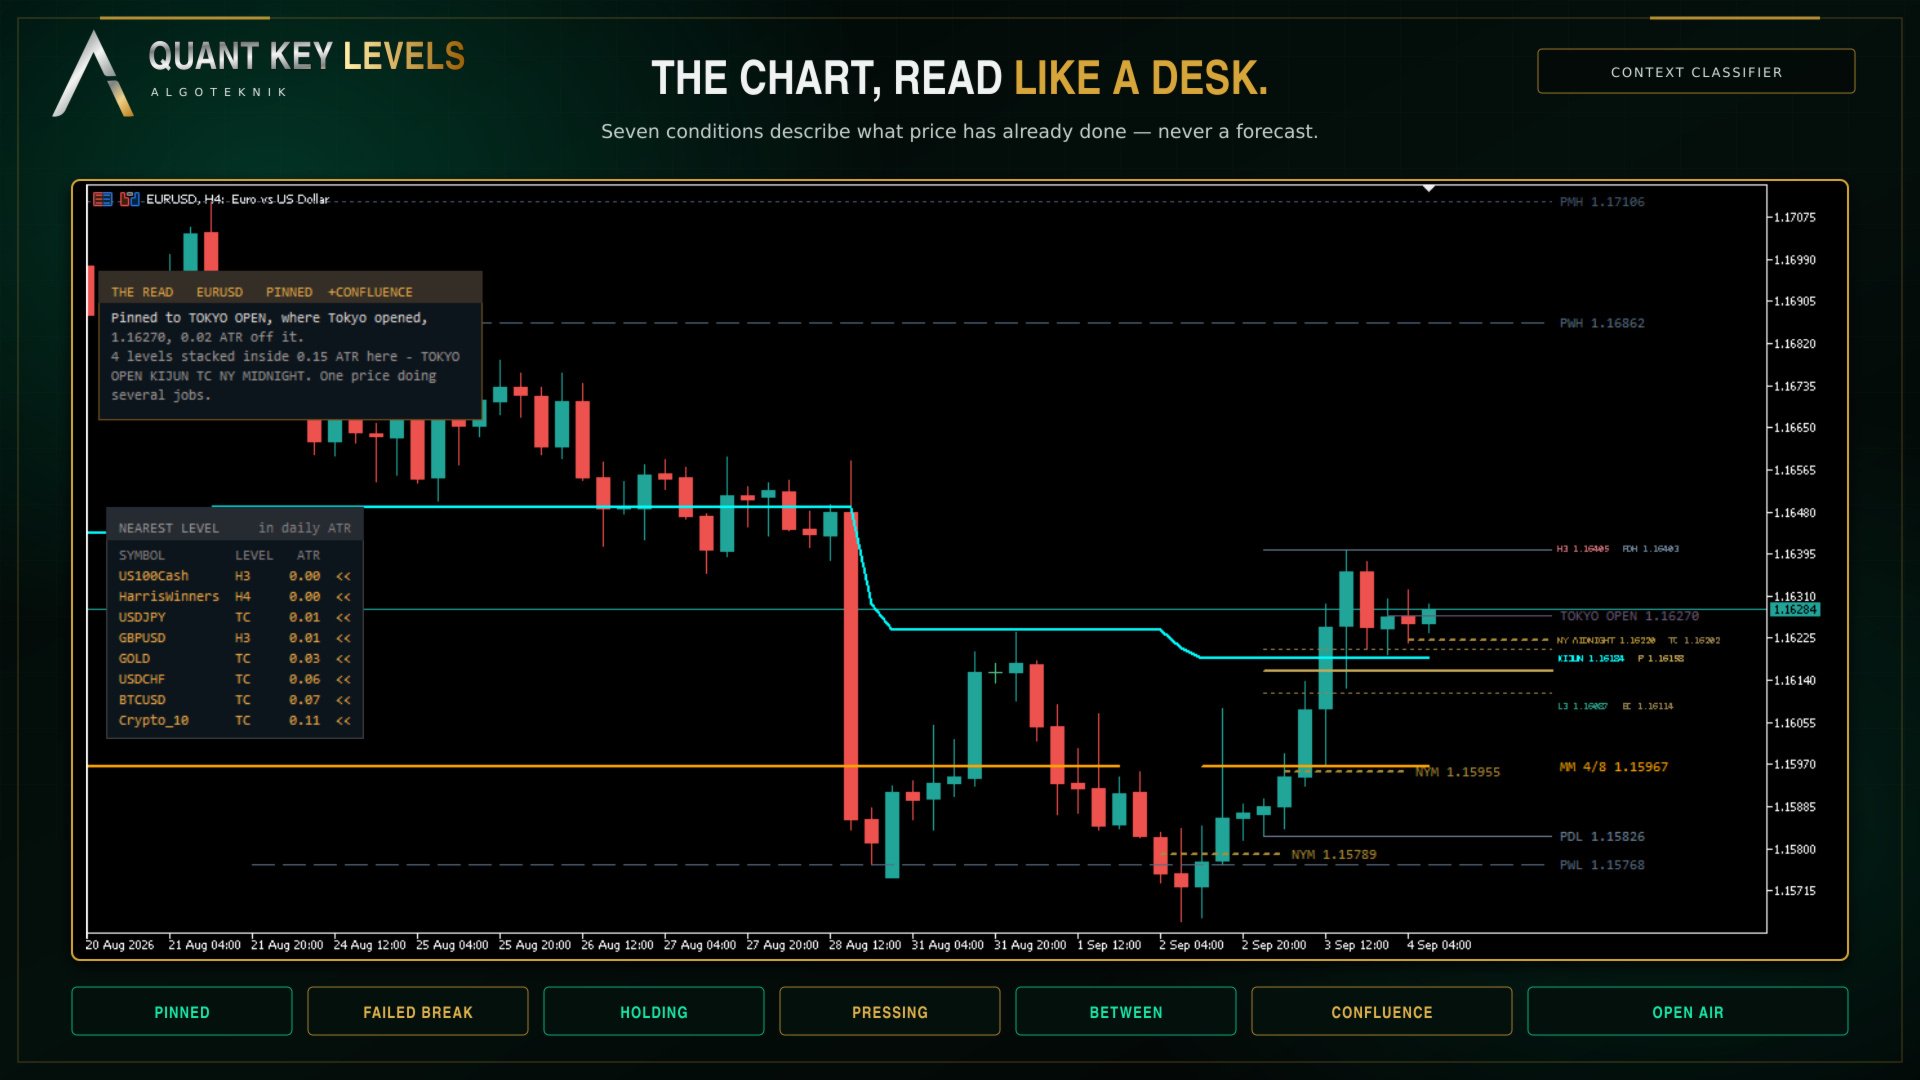
“Pinned to L3 4412.80, 0.04 ATR off it. Four touches in the last thirty bars and no close through.” The read measures the distance from price to every level on the chart in daily ATR, decides which of seven situations that is — pinned, failed break, holding, pressing, between, confluence, open air — and prints the sentence for it with the real numbers in. The panel holds eight lines; on the rare read that fills them the last line ends in three dots, which is the panel saying it ran out of room rather than the read stopping there.

It is a classifier, not a crystal ball, and the distinction is the point: there is no model, no forecast and no network anywhere in this product. Nothing on that panel says where price is going or what to do about it. Every sentence is a statement about what has already happened, which is the only thing a chart can honestly tell you. The same inputs produce the same sentence every time, and it holds its level through the small moves that would otherwise make it flicker between two neighbours.

The question a single chart cannot answer

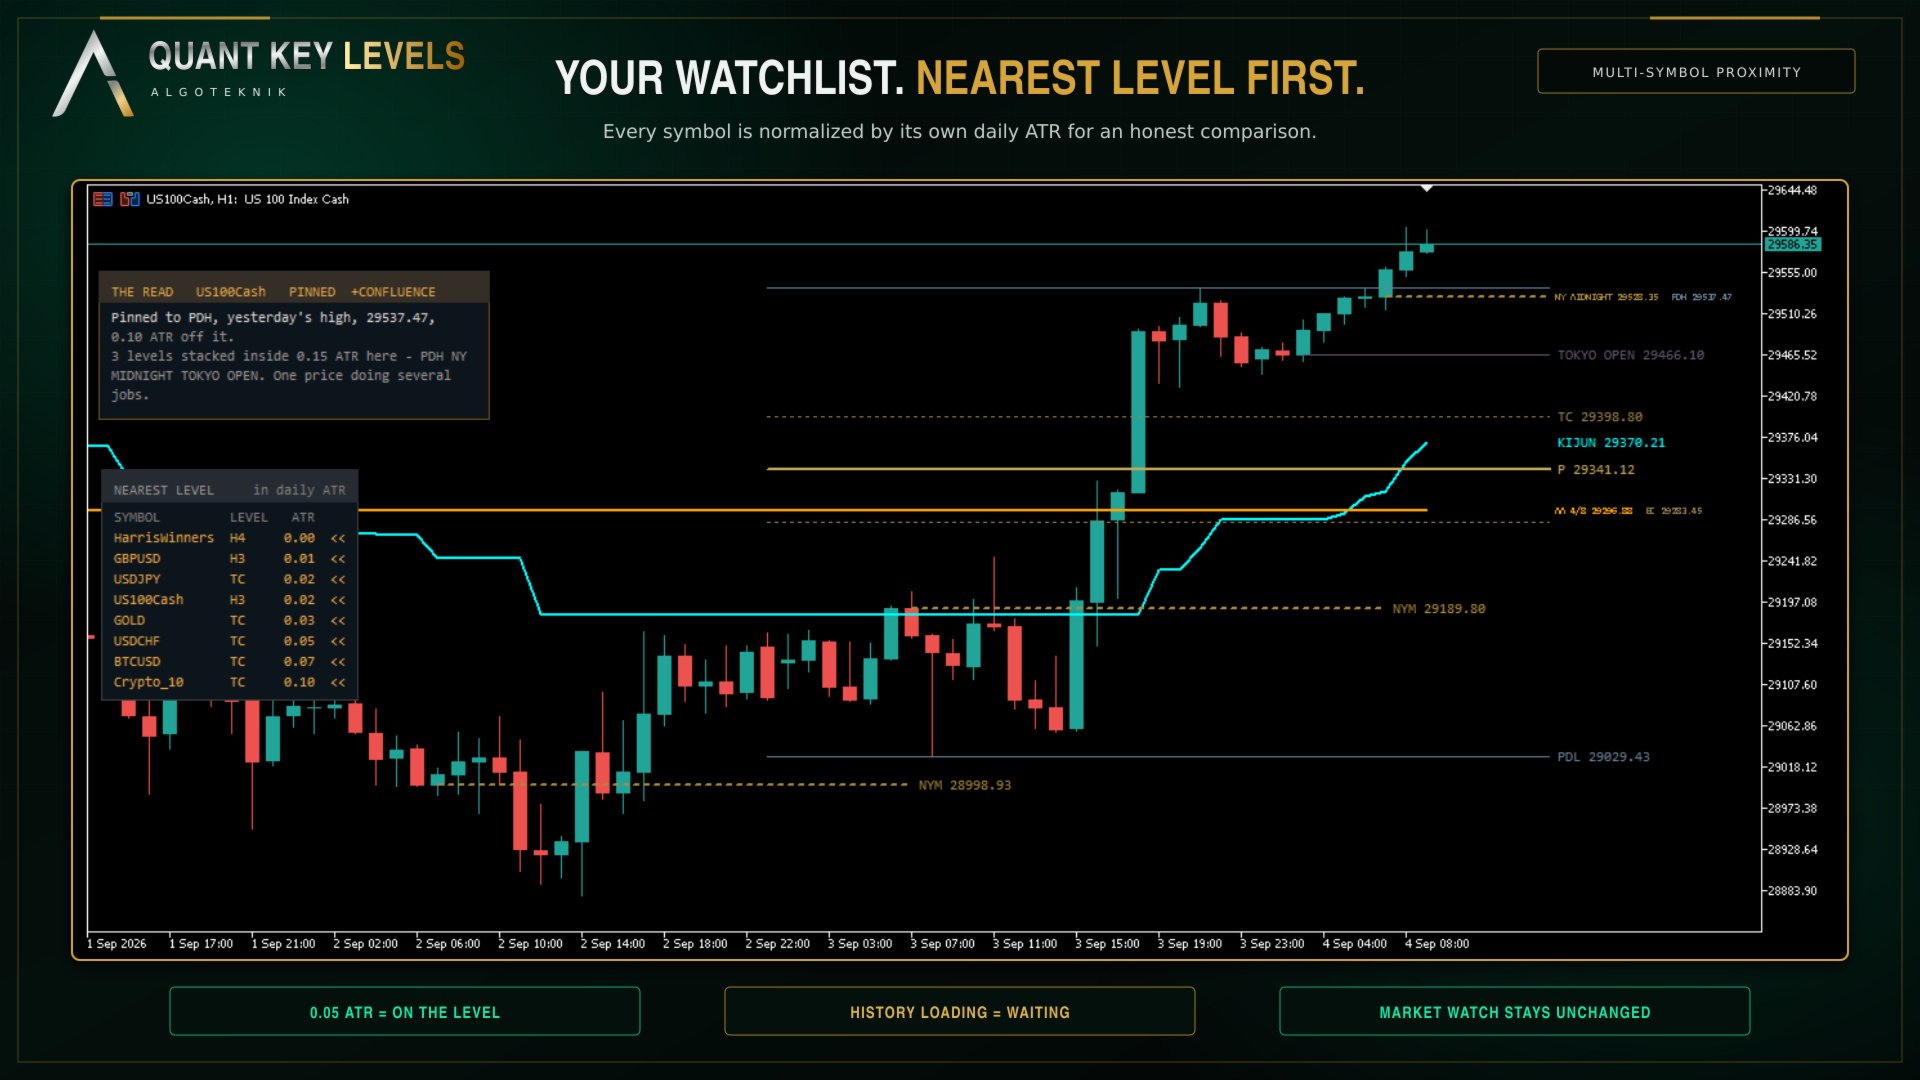
Which of the things you trade is on a level right now. The multi symbol proximity readout scans your Market Watch, or a list you give it, and reports each symbol's distance to its nearest key level in that symbol's own daily ATR. 0.05 means price is on the level; 1.00 means a full average day away; anything inside a quarter of an ATR is called out. Nine levels per symbol, all from its previous completed daily bar. It never adds anything to Market Watch to fill the list out, and a symbol still downloading its history is shown as waiting rather than reported as a zero. In the Strategy Tester only the tested symbol is loaded, so the readout shows one row there and says so on the plate; that is the tester, not the product. When a symbol has no live quote, because the market is closed or it has not ticked since the terminal opened, its last daily close stands in for the price.

Nothing repaints, and the one thing that moves says so

Every level here is defined from a period that has already closed. The daily average true range that the read, the proximity readout and the pivot range width are measured in is built from closed daily bars only and never touches today's forming bar, so those numbers do not drift through the session. The Murrey octave is computed from the bars before the current one, so it is fixed the moment its bar opens. The ARC pair draws the level as it stood after the previous bar closed. The VWAP value on a closed bar was measured against its own recomputation and never changed afterwards. The single exception is today's running high and low, which is a live range by definition and carries a tilde in its name so it can never be mistaken for a settled level.

Levels that stay readable

A level that is flat for a day and jumps at the boundary is two shelves, not one sloping line. Drawing it as a single continuous line paints a vertical through prices that were never a level, and that is what turns a pivot chart into a staircase. Every family here that steps — the Camarilla set, the Murrey octave, the ARC pair at a side change — is drawn as separate flats with the joining bar left blank.

With everything switched on, eleven families put their levels on the chart and their labels all want the same strip of screen at the right edge. Rather than let them print on top of each other, the labels go into one queue and a single pass lays out the whole column at once. Labels that land within one text height of each other belong to one row, and a shared row is written side by side: they are not merged and nothing is thrown away, so each label keeps its own text, its own price and its own colour. A shared row is set 25 percent smaller than a label that has its row to itself, which is what buys the horizontal space back, and the widths are measured with the real font metrics rather than guessed from a character count. Grouping runs in order of importance and the rows come out correctly spaced on their own, so no label is nudged off its own price and none is hidden. A row holds at most six labels by default; past that the last one carries a “+N” so the count stays honest. Crowding is measured in pixels, so the column is recomputed as you zoom.

The two panels are drawn as framed plates whose colour is blended with your chart background rather than painted over it, so the candles behind them stay readable. Both can be dragged anywhere and both remember where you put them, per symbol.

The eleven families

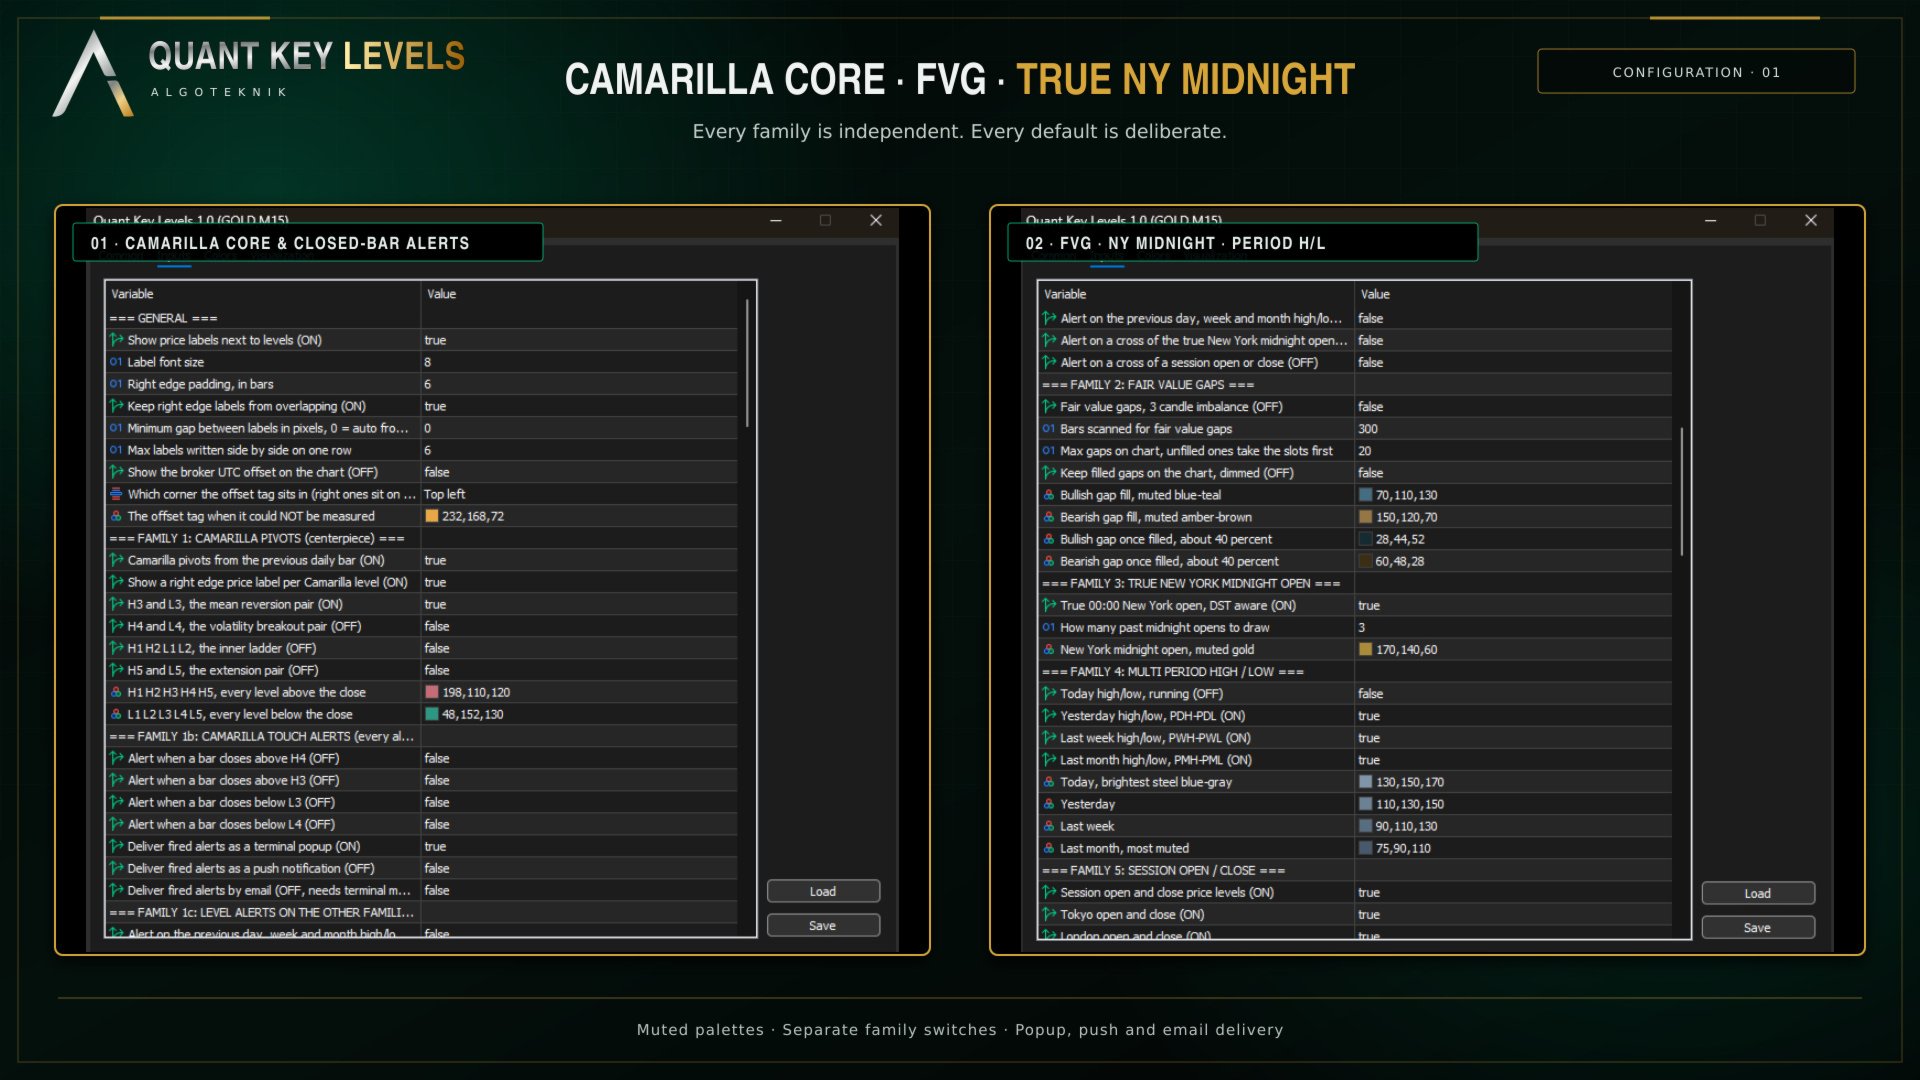
Camarilla pivots. Calculated from the previous completed daily bar, with R as the previous high minus the previous low. H4 and L4 sit at Close plus or minus R times 1.1 divided by 2, H3 and L3 at 1.1 divided by 4, H2 and L2 at 1.1 divided by 6, H1 and L1 at 1.1 divided by 12. H5 is the previous high divided by the previous low, multiplied by Close, and L5 is H5 mirrored around Close. This is the Camarilla Channel that ships with MetaTrader 5, drawn the way it draws it: all ten lines on every bar, solid, with H3 and L3 heavy and the other eight thin. The colours are this product's own, rose above the close and teal below it, measured for contrast rather than picked by eye. Switch all four pairs on, put the stock Camarilla Channel on the same chart, and every value sits exactly on top of its own. That is the only kind of proof worth offering.

What ships on is the mean reversion pair alone, H3 and L3. Ten lines at once is a wall and those are the two a trader actually works from. The other three pairs are one switch each, because a level and its mirror are read together, and turning a pair off removes its line, its right edge label and its touch alert together. The arithmetic is untouched: every level is still computed, so turning a pair back on shows the numbers that were always there.

What this module adds to the stock version is correctness, never a different picture. The stock indicator builds its object prefix from the clock, so it changes on every restart and leftover labels can never be swept away; here the prefix is fixed and a sweep runs before anything is drawn. The stock indicator can stall permanently when the previous daily bar is missing, and not only for that bar but for the whole rest of the chart; here the history is actively requested, the affected bar is left blank and the levels repair themselves when the data arrives. The stock indicator divides by the previous Low without checking it; here H5 and L5 are left out rather than invented when that division is not safe. The stock indicator refuses to start at all above D1; here Camarilla simply stops drawing above D1 while the other families carry on. Several vendors publish different H5 and L5 conventions; the one used here is the MetaQuotes published extension, and it is written on the tooltip of the level itself, so a number that differs from another package is a convention difference rather than an error.

Fair value gaps. The classic three candle imbalance, scanned over the last 300 bars by default and drawn as a shaded block extended to the right for as long as the gap stays open. A gap counts as filled the moment price trades through its far edge, the bottom of a bullish gap or the top of a bearish one, because reaching that edge means the whole imbalance has been traded back through. The box is cut at the candle that fills it and is never drawn past that candle. A filled gap is not deleted: it is dimmed and its right edge is frozen there, so the record of where imbalance was resolved stays on the chart. At most twenty gaps are kept, open ones claim the slots first, and the first thing dropped is always the oldest already resolved gap.

True New York midnight open. The daily open at midnight New York time, which is 05:00 UTC in winter and 04:00 UTC in summer, switching on the real United States daylight saving dates rather than on a broker server offset that someone typed in once. It is placed with the measured clock described above.

Multi period high and low. Four periods, each with its own switch. Yesterday, last week and last month ship on; today running ships off because it is the one level that moves all day. Every value is read from a completed daily, weekly or monthly bar rather than assembled by scanning intraday bars across a boundary, which is what makes weekend and holiday gaps a non issue. On a Monday the previous day is simply the previous daily bar, which is Friday. Style carries recency rather than colour: all four use one steel blue family, and you read the age of a level from how it is drawn.

  • Today, solid and brightest
  • Yesterday, solid and slightly muted
  • Last week, dashed
  • Last month, dotted and most muted

Session open and close. The six exchange levels described above, drawn from the published hours of Tokyo, London and New York on their own daylight saving calendars.

ARC trend pair. ARC stands for Average Range times Constant, from Welles Wilder Jr, 1978. A constant times the Average True Range is measured off price to give a level that trails the market, and the rule is short: if close minus factor times ATR is above the level the level moves up to it, if close plus factor times ATR is below the level it moves down to it, and otherwise the level does not move at all. The level is therefore dragged along only when price gets further than one ARC away from it. Inside that band nothing happens, which is why the line sits on long flat shelves and why price can cross it without moving it a single tick. The ATR used is the plain average of true range, not Wilder smoothing.

Two lines are drawn, used the way an Ichimoku uses its two fast lines but built from Average True Range instead of fixed period highs and lows: the Tenkensen on a nine period ATR with factor one, drawn thin, and the Kijunsen on a twenty six period ATR with factor 2.9, drawn heavy. Both period and factor are inputs. Each line has two colour inputs, one for while it sits below price and one for while it sits above, on separate plots so the handover at a side change is flat rather than a jump. They ship set to the same value per line, white for the Tenkensen and aqua for the Kijunsen, so each line reads as one colour unless you choose to have the side called out. The value drawn on a bar is the level as it stood after the previous bar closed, so nothing on the current bar can change it.

Murrey Math 4/8. Murrey Math takes the range of the last sixty four bars by default, snaps it onto a base eight octave grid and cuts that octave into eight equal eighths. The 4/8 line is the middle one, the main pivot, where price is treated as being in balance. Only the 4/8 is drawn here: the other twelve lines of a full Murrey set would turn the chart into a grid, and the 4/8 is the one that behaves like a key level. The calculation is a line for line port of the Murrey Math indicator that is already in the terminal, quirks included rather than tidied up, so the two agree to the last digit and can be checked against each other on the same chart.

Session VWAP. The volume weighted average price, accumulated from the start of the session: each bar contributes its typical price weighted by that bar's activity, and the line is the running average of the two. By default the session starts at the open of the broker's own daily bar, the same boundary the Camarilla levels use and the same one your daily chart draws, so the two never disagree about where the day began; the alternative anchor is true midnight New York.

Where the feed supplies real traded volume it is used. No retail foreign exchange or CFD feed does, so on those instruments the weight is the tick count, the number of price changes in the bar. That was measured rather than assumed, and so was what it tracks: tick count correlates 0.74 with the bar's range, which means it follows activity and volatility rather than traded size, while its shape through the day does match the real liquidity curve. On foreign exchange this line is honestly a volatility weighted mean price, and knowing that is worth more than a footnote. It is timeframe dependent, and so is every other VWAP: each bar contributes a single typical price, so a coarser chart folds more of the movement inside each bar into one number. Three optional band pairs sit at plus and minus a multiple of the weighted standard deviation of price around the line, using the same weights; all three ship switched off, because six lines that move together crowd out everything else.

Central Pivot Range, described above with its width tag. Multi symbol proximity and the read are the tenth and eleventh, and both are panels rather than lines; both ship on, because a feature nobody finds is a feature nobody bought.

Alerts

Camarilla H3, H4, L3 and L4 raise a close alert; so do the previous day, week and month highs and lows, the true New York midnight open, and the session opens and closes. Every one of them judges the last closed bar and never the forming one, none fires for the history that was already on the chart when the indicator loaded, and each level fires at most once a day. Direction is per family: a previous high is broken upward and a previous low downward, so those fire on a close past the level, while a midnight open or a session open has no side to break and fires on a cross in either direction. Delivery is popup, push notification or email, each on its own switch. Every alert ships off.

The Data Window

Every level that is drawn as a chart object is also published to the Data Window under its own name: previous day, week and month high and low, today's running high and low, the New York midnight open, the pivot range, and the six session levels. Hover a bar and read the exact number instead of taking it off a label that shortens when the right edge is crowded. A level is only reported from the bar that defined it onward, so hovering last month does not report today's previous day high, and a family you switch off leaves the Data Window rather than freezing its last value there.

Colours, settings and the full reference

A small set of muted hue families, each distinguished inside itself by line style and weight rather than by adding more colours. Nothing is neon and nothing is a pure red or green, and the shipped values are chosen to stay readable across a long session on a dark chart. Every colour is an input, so the whole palette can be retuned to your own theme without losing the structure.

Colour, line style and width come from the Inputs tab and are re-applied every time the indicator starts, so edits made in the Colors tab do not stick. That is deliberate. A chart stores the plot settings of every indicator attached to it and pushes them back over what the indicator asks for, so a chart that once held a different version of this tool can force that version's settings onto this one, and when the two disagree about how a line is drawn the line does not appear at all. Rather than let a stale chart setting silently blank out a level, the indicator puts its own definition back.

The complete input reference, including every default, every allowed range and the behaviour that has no switch, is in the Manual.txt file, published on the channel linked at the foot of this page. A Market product carries one file, so the manual is not packed with the EX5.

Questions, bug reports and feature requests are welcome on the TrendTower channel: https://www.mql5.com/en/channels/trendtower

This is an indicator for analysis and decision support. It does not place trades. Always test thoroughly before using any tool in live trading. Trading involves risk.

algoteknik

Support, updates and every other product: mql5.com/en/users/bugraky123
Product channel: mql5.com/en/channels/trendtower

Quant Key Levels version 1.0
Рекомендуем также
Apex Trend Zone — Product Description Apex Trend Zone is a trend-following signal indicator designed to capture the market's primary direction and help you stay in a position throughout the trend. By tracking price momentum, it marks potential reversal and continuation points on the chart using clean arrow markers and an adaptive trailing line. The indicator uses a dynamic zone logic that adjusts itself to market volatility. As the trend strengthens, the trailing area widens, aiming to reduce ea
Grid MA: Institutional Risk Edition by Hello Quant is an advanced, fully-automated mean-reversion grid framework engineered for stringent capital preservation and extreme volatility management. Unlike traditional grid systems that hold stranded losing positions while scraping small individual profits, Grid MA V1.71 utilizes a proprietary Directional Basket Profit Realization engine. It calculates the net equity of your entire directional exposure (including swaps and commissions) and executes a
Оцените структуру и ликвидность. Читайте торговый план прямо на графике. Pusula объединяет рыночную структуру, ликвидность и SMC-сетапы в одном рабочем пространстве для MetaTrader 5. BOS и CHoCH, снятия ликвидности, FVG и зоны ордер-блоков наносятся на график. Карточка чтения графика простыми словами объясняет, что сделал рынок и какого условия ждёт сетап. Когда выполнены условия одной из трёх стратегий, вход, стоп, цели и размер лота с учётом вашего риска появляются в одном плане; контрольный с
Supply and Demand Indicator + FREE Currency Strength Meter ADD-ON Looking for a powerful tool that can help you identify the most reactive zones in the forex market? Our supply and demand indicator for MetaTrader 4 and 5 is exactly what you need. With its advanced algorithms and real-time analysis, this indicator helps traders of all experience levels make informed trading decisions. The supply and demand indicator is a cutting-edge tool that helps traders identify areas where buyers and sellers
ASI fractals with DPO filter - is the manual trend-following system. ASI fractals are the base of every trend. System plots an arrow when fractal pattern appears on ASI indcator and DPO direction is same as incomming signal. System has several ways of usage : simply indicator, indicator with suggested arrows, arrows with single targets and arrows with common profit targets. User can simply switch indicator's modes directly from chart. Main Indicator's Features Signals are not repaint,non-late or
This product is designed for the MT5 platform and offers two key features: VWAP (Volume Weighted Average Price) calculation and Volume Profile analysis. Advantages: VWAP Calculation: The product calculates the VWAP, which is a popular indicator used by traders to determine the average price of a security based on its trading volume. It helps identify potential buying or selling opportunities by comparing the current price to the average price weighted by volume. Volume Profile Analysis: The prod
Smart Volatility Squeeze MT5 Smart Volatility Squeeze MT5 is a volatility compression and momentum expansion indicator for MetaTrader 5. It builds on John Carter's Volatility Squeeze framework and extends the usual single-tier squeeze into three compression tiers, so you can see not only whether the market is compressed but how tightly it is compressed before it expands. The indicator opens in a separate window and draws two elements: a linear regression momentum histogram and a row of coloured
Inspired investing.com Technical Indicators, this indicator provides a comprehensive view of the symbol by synthesizing indicators including: RSI, StochRSI : have 3 level oversold - red, midle (aqua when upper, pink when lower), overbuy – blue Stoch: oversold – red, overbuy- blue, aqua when main line < signal line, pink when main line > signal line MACD: aqua when main line < signal line, pink when main line > signal line ADX:   aqua when line plus > line minus, pink when line plus < line minus
Visual Heatmap Book Analyser This indicator monitors the market liquidity and generates colors based on order patterns, quantities, and renewal activities in the book. This allows you to visualize the order flow and identify areas of high and low liquidity and activity. The indicator uses machine learning techniques to analyze the order behavior in the book, enabling it to detect patterns and trends in orders, allowing you to make informed decisions about your trading operations. The color pale
KS Master Tool 12 in 1 Trade with Me — это пользовательский индикатор для MetaTrader 5 (MT5), представляющий собой единый файл, который объединяет множество торговых инструментов в рамках одного графического наложения. Индикатор спроектирован таким образом, что каждый модуль можно полностью включить или отключить с помощью главных переключателей. При отключении модуля все связанные с ним вычисления, отрисовка графических элементов, работа таймеров и обработка событий графика полностью прекращаю
Volume Trio Multi is a three-layer market-structure tool for MetaTrader 5: session Volume Profile (POC, VAH/VAL, Value Area), a CVD volume-pressure histogram with a strict Regular divergence engine, and anchored VWAP with standard-deviation bands — extended with a watchlist scanner that runs all three across the symbols in your Market Watch. This is the Pro edition of my free indicator, Volume Trio. The base engine is identical, so this page describes only what Pro adds. For the three layers the
CHoCH + BOS + Профиль объёма — индикатор умной рыночной структуры Gerçek hayattaki en iyi sosyal ağ sitelerinden biri olan Торгуйте с ясным пониманием структуры ve Çok iyi bir analiz. Индикатор автоматически определяет сигналы CHoCH (смена характера) ve BOS (пробой структуры) как на свинг-, так ve на внутренней структуре, отмечает ордер-блоки, равные максимумы/minimumы ve сборы ликвидности, а также отображает Merhaba, ancak, artık alışveriş ve ürün aktivitelerinizi gerçekleştiremezsiniz. Aşağıd
Alexander The Great EA is a premium Expert Advisor developed exclusively for MetaTrader 5. It is designed to automate disciplined trend-following strategies using intelligent market analysis, advanced risk management, and professional trade execution. Unlike traditional Expert Advisors that rely on basic indicator crossovers, Alexander The Great EA combines trend confirmation, execution filters, and structured money management into a reliable automated trading solution. Every component has been
Техническое описание индикатора – Delta Profile для MetaTrader 5 Delta Profile – это индикатор, разработанный для MetaTrader 5, предназначенный для детального анализа потока объёмов в пределах заданного диапазона свечей. Он структурирует и отображает информацию о дисбалансе положительных объёмов (связанных с движением вверх) и отрицательных объёмов (связанных с движением вниз) на различных ценовых уровнях. В результате пользователь получает чёткое представление о тех участках графика, где сосред
Master Edition — это профессиональный аналитический инструмент, предназначенный для визуализации структуры рынка через призму объема и денежного потока. В отличие от стандартных индикаторов объема, этот инструмент отображает Daily Volume Profile (Дневной Профиль Объема) прямо на вашем графике, позволяя видеть, где именно происходило открытие цены и где позиционируются «умные деньги». Эта версия Master Edition разработана для ясности и скорости, оснащенная уникальной системой Auto-Theme Sync, кот
Reverse Strike
Antonio Gutemberg Frota
Reverse Strike – Professional Gold Reversal Indicator for MetaTrader 5 EXPERT:  Reverse Strike expert Reverse Strike is a professional MetaTrader 5 indicator designed to identify high-probability reversal opportunities on XAUUSD and other trading symbols. Built with ATR trailing stop logic, linear regression analysis, and multi-timeframe confirmation, it helps traders detect potential market turning points with clarity and precision. Instead of simply following the existing trend, Reverse Stri
VPDemandSupply
Xavier Gregory Yvon Remy Boussougant
Cet indicateur combine plusieurs outils d'analyse technique avancée sur un seul graphique. Il est conçu pour identifier les zones clés de prix, les niveaux de liquidité et les retracements potentiels. Double ZigZag Deux ZigZag superposés avec des sensibilités différentes. Le ZZ1 (argent, rapide) détecte la structure de marché à court terme, tandis que le ZZ2 (or, lent) identifie la tendance principale . Ensemble ils permettent de lire le marché sur deux niveaux simultanément. Zones Supply & Dem
https://www.mql5.com/tr/users/bilisimprofesoru/seller ProTrader Toolbox EA  Multi-Asset • Multi-Strategy Trading Toolkit ProTrader Toolbox EA is a flexible MetaTrader 5 Expert Advisor designed for traders who want to build and manage different trading approaches from a single system. With more than 100 configurable inputs, the EA combines entry timing, grid management, trend filters, risk controls, multiple take-profit methods, manual trade takeover, market analysis, mobile notifications, and l
Nspikes Sniper R2 Premium Edition for MT5 Nspikes Sniper R2 Premium Edition is a technical indicator designed for Boom 1000/500/900/600 and Crash 1000/500/900/600 indices. It integrates liquidity zone detection, session filters, and a 3-step recovery entry visual layout directly on MetaTrader 5 charts. Key Features: - Automatic Instrument Detection: Identifies whether the current chart is Boom or Crash and applies the corresponding logic. - Timeframe Optimization: Formatted for M1 and M5 time
HTF FVG Scanner – Индикатор Fair Value Gap для MT5 Отображает Fair Value Gaps со старших таймфреймов — H1, H4, D1, Weekly — прямо на вашем графике M5 или M15. Без переключения между окнами и без ручной разметки. Большинство FVG-индикаторов сканируют только текущий таймфрейм. Этот работает иначе. Он считывает разрывы с выбранного старшего таймфрейма и наносит их на ваш текущий график в реальном времени. H4-гэпы на M15-графике. D1-гэпы на H1. Weekly-гэпы на H4. Зоны остаются на месте при скролле,
No Chase Entry Filter
Mohamed Amr Mohamed Osama Abdelwahab
No Chase Entry Filter - Входы, которые не опаздывают Многие убыточные сделки не ошибаются в направлении. Они опаздывают. Идея была здравой, вход случился после того, как движение уже произошло, и стоп сработал на обычном откате, который лучшая цена пережила бы. No Chase Entry Filter отмечает входы на покупку и продажу по структуре рынка и отклоняет те, что берутся по плохой цене. Зелёная точка означает: покупать отсюда. Красная точка означает: продавать отсюда. Цветной уровень отмечает место
Floating DD Tracker — Free Risk Monitoring Indicator for MT5 Floating DD Tracker is a lightweight and professional MetaTrader 5 indicator designed to help traders monitor real-time floating drawdown directly on the chart. The indicator continuously tracks your current floating drawdown, records the highest drawdown reached, and displays the historical maximum DD with the exact date and time it occurred. Its compact neon-style dashboard is optimized for all chart sizes and provides instant visual
FREE
Apex Signal Engine Продвинутый мультисигнальный индикатор с трендовым облаком, управлением рисками и мультитаймфреймовой панелью Поиск надежных точек входа в условиях постоянно меняющегося рынка требует большего, чем один индикатор. Большинство трейдеров накладывают множество инструментов на график, пытаясь интерпретировать противоречивые сигналы, пока возможности ускользают. Apex Signal Engine решает эту проблему, объединяя определение тренда, многотипную генерацию сигналов, входы на откатах, д
Optimized Trend Tracker OTT is an indicator that provides traders to find an existing trend or in another words to ser which side of the current trend we are on. We are under the effect of the uptrend in cases where the prices are above OTT , under the influence of a downward trend, when prices are below OTT it is possible to say that we are. The first parameter in the OTT indicator set by the two parameters is the period/length. OTT will be much sensitive to trend movements if it is sma
Вот перевод описания вашего продукта Apex Heikin Ashi Pro MT5 на русский язык, адаптированный для пользователей MQL5 Market: Apex Heikin Ashi Pro V1.0 от г-на Бриджеша Джайсуала (Brijesh Jaiswal) — это премиальный трендовый индикатор Heikin Ashi для MT5 с неподвижными (non-repaint) стрелками покупки/продажи, подтверждением SuperTrend, «королевской» цветовой схемой свечей, темной стилизацией графика, системой оповещений и профессиональной панелью управления для быстрого анализа тренда. Apex Heiki
Market Projection Pro — MT5 Хотите видеть на графике сценарий продолжения ценовых циклов? Market Projection Pro анализирует выбранный вами исторический участок, выделяет циклические компоненты и строит составную проекцию вправо от окна анализа. Вы сами выбираете исходный участок и горизонт, чтобы сопоставлять сценарий с текущей структурой цены и возможными зонами поворота. Что вы увидите на графике Интерактивные границы позволяют выбрать исторический участок прямо на графике. Расчёт циклических
Eng Gold
Ely Alkrar Xshkaky
ENG-GOLD Scalper It is an auxiliary indicator that identifies potential targets and determines the place of entry with a stop loss that works on Heiken Ashi candles  The green lines are usually the targets, the red lines are the stop loss, and the yellow lines are the entry location.  This file is recognized on small and medium frames, usually less than the watch frame I highly recommend using XAUUSD Nasdaq100 Dow30 USOIL 
Take your Forex chart analysis to the next level with FOREX ROUND LEVELS PRO — a professional indicator designed exclusively for currency pairs. Identify important psychological round-number levels automatically and visualize Main, Intermediate, and Minor levels directly on your MT5 chart. KEY FEATURES Automatic Level Detection — automatically adapts the level system to the currency pair you are trading. Main Psychological Levels — highlights major round-number areas with strong visual emphasis.
Sinal IFR
Aurenice Barros De Abreu Carvalho
Sinal com base no indicador RSI, que indica compra marcando com uma seta verde quando o preco sai da região de sobrevendido, e sinaliza venda quando o preco sai da regiao de sobrecomprado. A sinalizacão é  feita com uma seta verde para compra e seta rosa para venda. Permite configurar o nível de sobrecompra e de sobrevenda, além do período do RSI. Funciona em qualquer período gráfico.
С этим продуктом покупают
Trend Sniper X
Sarvarbek Abduvoxobov
4.9 (42)
Trend Sniper X — это трендовый индикатор для MetaTrader 5, работающий на нескольких таймфреймах, который помогает трейдерам точно и ясно определять направление тренда и потенциальные точки разворота. для MT4: https://www.mql5.com/en/market/product/193245 Информация о цене: Текущая цена является промо-ценой и может измениться по мере выхода предстоящих обновлений и новых функций. Бонусное предложение: Чтобы получить БЕСПЛАТНЫЙ авто-трейд советник Assistant EA для этого индикатора, пожалуйста, на
M1 SNIPER   — это простая в использовании торговая система. Это стрелочный индикатор, разработанный для тайм фрейма M1. Индикатор можно использовать как отдельную систему для скальпинга на тайм фрейме M1, а также как часть вашей существующей торговой системы. Хотя эта торговая система была разработана специально для торговли на M1, ее можно использовать и с другими тайм фреймами. Первоначально я разработал этот метод для торговли XAUUSD и BTCUSD. Но я считаю этот метод полезным и для торговли на
Boba Analysis Suite Boba Analysis Suite — аналитический индикатор для MetaTrader 5. Он объединяет структуру рынка, значимые ценовые зоны и общий рыночный контекст в одном представлении на графике. Индикатор разработан на основе практического опыта трейдера и наставника по трейдингу. Он помогает выстроить последовательный процесс анализа: оценивать направление рынка, определять важные уровни и рассматривать несколько таймфреймов в совокупности. Анализ с учётом контекста Значение отдельных сигнало
Entry Points Pro — топ-1 индикатор по количеству отзывов (600 отзывов и 31 000 скачиваний обеих версий). Индикатор даёт самые перспективные точки входа в сделки без перерисовки на любых инструментах. Индикатор покажет заранее стрелкой точку входа в сделку, укажет цену входа и нарисует на графике уровень входа и стопа, а так же рассчитает рабочий лот под твой депозит и риск, а панель статистики поможет выбрать самый перспективный инструмент и таймфрейм .  Тебе остаётся поставить отложенный ордер
Auto Optimized SpeedAngle — это система векторизации импульса институционального уровня, которая исключает подгонку под исторические данные (curve-fitting) за счет непрерывной форвард-оптимизации (Walk-Forward Optimization, WFO). Вместо того чтобы полагаться на статические входные параметры, которые теряют эффективность при смене рыночных режимов, индикатор динамически перекалибрует свои настройки, используя валидацию на вневыборочных данных (Out-of-Sample, OOS). Это гарантирует, что отображаемы
Neuro Poseidon - новый индикатор от Дарьи Резуевой. Он сочетает точные торговые сигналы с адаптивными уровнями TP/SL , в результате создавая максимально выгодные сделки! TO SWITCH TO   ENG   PLEASE CHOOSE IT IN THE UPPER-RIGHT CORNER OF THE WEBSITE Напишите мне и получите  Neuro Poseidon Assistant  в подарок для автоматизации вашей торговли! Что отличает его от других индикаторов? 1. Доказанная прибыльность на всех активах и таймфреймах 2. На графике присутствуют только подтвержденные сигналы н
ARIPoint
Temirlan Kdyrkhan
1 (4)
ARIBot is a powerful trading companion designed to generate high-probability entry signals with dynamic TP/SL/DP levels based on volatility. Built-in performance tracking shows win/loss stats, PP1/PP2 hits, and success rates — all updated live. Key Features: Buy/Sell signals with adaptive volatility bands Real-time TP/SL/DP levels based on ATR Built-in MA Filter with optional ATR/StdDev volatility Performance stats panel (Success, Profit/Loss, PP1/PP2) Alerts via popup, sound, push, or email Cus
Adaptive Price Action Engine Купи индикатор — получи советник (EA) к нему бесплатно Самооптимизирующийся мульти-таймфреймовый анализ тренда и свечных моделей Рынок постоянно меняется — и не каждая модель Price Action имеет одинаковую ценность в разных рыночных режимах. Adaptive Price Action Engine создан для адаптации к изменяющимся рыночным условиям, объединяя трендовую структуру, мульти-таймфреймовый анализ, свечные модели и статистическую оптимизацию в единой аналитической системе. Два адапти
Gann Made Easy   - это профессиональная, но при этом очень простая в применении Форекс система, основанная на лучших принципах торговли по методам господина У.Д. Ганна. Индикатор дает точные BUY/SELL сигналы, включающие в себя уровни Stop Loss и Take Profit. ПОЖАЛУЙСТА, СВЯЖИТЕСЬ СО МНОЙ ПОСЛЕ ПОКУПКИ, ЧТОБЫ ПОЛУЧИТЬ ТОРГОВЫЕ ИНСТРУКЦИИ И ОТЛИЧНЫЕ ДОПОЛНИТЕЛЬНЫЕ ИНДИКАТОРЫ БЕСПЛАТНО! Вероятно вы уже не раз слышали о торговли по методам Ганна. Как правило теория Ганна отпугивает от себя не только
Scalper Vault — это мощная, полноценная торговая система, созданная для трейдеров, которые стремятся к стабильным результатам в внутридневной торговле. Этот высокоточный индикатор представляет собой комплексное, самостоятельное торговое решение, обеспечивающее аналитику профессионального (институционального) уровня как для торговли на рынке Forex, так и для работы с бинарными опционами. Пожалуйста, свяжитесь со мной после покупки, чтобы получить мои торговые советы, а также отличный бонус! Исклю
Каждый покупатель этого индикатора получает дополнительно Бесплатно: Авторскую утилиту "Bomber Utility", которая автоматически сопровождает каждю торговую операцию, устанавливает уровни Стоп Лосс и Тейк профит и закрывает сделки согласно правилам этой стратегии, Сет-файлы для настройки этого индикатора на различных активах, Сет-файлы для настройки Bomber Utility в режимы: "Минимум Риска", "Взвешенный Риск" и "Стратегия Выжидания", Пошаговый видео-мануал, который поможет вам быстро установить, н
PainX GainX Blue Spike Fusion AI Advanced Synthetic Index Spike Detection Indicator for MetaTrader 5 Discover potential spike setups with a clear, organized, and professional trading interface. PainX GainX Blue Spike Fusion AI is a specialized indicator designed for traders who monitor synthetic indices and want a structured way to observe potential price spike opportunities. The indicator combines signal monitoring, market-condition analysis, visual alerts, and event tracking in one convenient
Quantum TrendPulse
Bogdan Ion Puscasu
5 (26)
Представляем   Quantum TrendPulse   , совершенный торговый инструмент, который объединяет мощь   SuperTrend   ,   RSI   и   Stochastic   в один комплексный индикатор, чтобы максимизировать ваш торговый потенциал. Разработанный для трейдеров, которые ищут точность и эффективность, этот индикатор помогает вам уверенно определять рыночные тренды, сдвиги импульса и оптимальные точки входа и выхода. Основные характеристики: Интеграция SuperTrend:   легко следуйте преобладающим рыночным тенденциям и п
Этот индикатор является уникальным, качественным и доступным инструментом для торговли, включающим в себя наши собственные разработки и новую формулу. В обновленной версии появилась возможность отображать зоны двух таймфреймов. Это означает, что вам будут доступны зоны не только на старшем ТФ, а сразу с двух таймфреймов - таймфрейма графика и старшего: отображение вложенных зон. Обновление обязательно понравится всем трейдерам, торгующим по зонам спроса и предложения. Важная информация Для макс
Btmm state engine pro
Garry James Goodchild
5 (4)
BTMM State Engine Pro by G-Labs — Beat The Market Maker indicator for MetaTrader 5. Asian session range, London and New York kill zones, level progression (L1/L2/L3), peak formation detection (PFH/PFL), entry signals, and a multi-pair scanner from one chart. Stop scanning charts one pair at a time. The State Engine tracks the BTMM daily cycle automatically — Asian box, room boundaries, level blocks, peak formations, and filtered entries — while the scanner dashboard shows level, peak status, d
Сложно найти и дефицит по частоте, дивергенции являются одним из самых надежных торговых сценариев. Этот индикатор автоматически находит и сканирует регулярные и скрытые расхождения, используя ваш любимый осциллятор. [ Руководство по установке | Руководство по обновлению | Устранение неполадок | FAQ | Все продукты ] Легко торговать Находит регулярные и скрытые расхождения Поддерживает много известных генераторов Реализует торговые сигналы на основе прорывов Отображает подходящие уровни стоп-
Gartley Hunter Multi - Индикатор для поиска гармонических моделей одовременно на десятках торговых инструментов и на всех возможных ценовых диапазонах. Инструкция/Мануал ( Обязательно читайте перед приобретением ) | Версия для МТ4 Преимущества 1. Паттерны: Гартли, Бабочка, Акула, Краб. Летучая мышь, Альтернативная летучая мышь, Глубокий краб, Cypher 2. Одновременный поиск паттернов на десятках торговых инструментов и на всех возможных таймфреймах 3. Поиск паттернов всех возможных размеров. От са
Volatility Master for MetaTrader is a real-time dashboard tool that scans up to  50 symbols  to identify high-volatility , trending markets instantly. With bullish/bearish signals, customizable alerts, and a user-friendly interface, it helps you avoid range-bound conditions and focus on high-probability trades. Clarity leads to confidence. Trade confidently and protect your capital effectively with this powerful dashboard. We don't offer free or bonus indicators in exchange of reviews from you.
Лучшее решение для новичка или трейдера-эксперта! Этот индикатор является уникальным, высококачественным и доступным торговым инструментом, поскольку мы включили в него ряд собственных функций и новую формулу. С помощью всего лишь ОДНОГО графика вы можете определить силу валюты для 28 пар Форекс! Представьте, как улучшится ваша торговля, потому что вы сможете точно определить точку запуска нового тренда или возможность скальпирования? Руководство пользователя:   нажмите здесь Это первый, ори
Лучшее решение для новичка или трейдера-эксперта! Этот индикатор является уникальным, высококачественным и доступным торговым инструментом, поскольку мы включили в него ряд собственных функций и секретную формулу. Всего на ОДНОМ графике он выдает алерты по всем 28 валютным парам. Представьте, как улучшится ваша торговля, ведь вы сможете точно определить точку запуска нового тренда или возможность скальпирования! Построенный на новых базовых алгоритмах, он позволяет еще проще определять и подт
TREND LINES PRO   помогает понять, где рынок действительно меняет направление. Индикатор показывает реальные развороты тренда и места, где крупные участники входят повторно. Вы видите   BOS-линии   смены тренда и ключевые уровни старших таймфреймов — без сложных настроек и лишнего шума. Сигналы не перерисовываются и остаются на графике после закрытия бара. VERSION MT 4     -     Раскрывает свой максимальный потенциал в связке с индикатором  RFI LEVELS PRO Что показывает индикатор: Реальные смен
Naked Forex Big Shadow Indicator Big Shadow Indicator is a pattern recognition indicator for Forex, Stocks, Indices, Futures, Commodities and Cryptos. When you have a Big Shadow on your chart then this is a strong signal meaning that you might be ahead of a reversal. You can take other elements (momentum, trend, volatility, price action, fundamentals) to build a complete strategy and confirm your entries. Beware that you might not make money just following the arrows generated by the pattern re
Currency Strength Wizard   — очень мощный индикатор, предоставляющий вам комплексное решение для успешной торговли. Индикатор рассчитывает силу той или иной форекс-пары, используя данные всех валют на нескольких тайм фреймах. Эти данные представлены в виде простых в использовании индексов валют и линий силы валют, которые вы можете использовать, чтобы увидеть силу той или иной валюты. Все, что вам нужно, это прикрепить индикатор к графику, на котором вы хотите торговать, и индикатор покажет вам
ICT PO3 (Power of 3) AMD Protocol Framework Indicator True Time & Structure Integration   |  Non-Repainting | Real-Time  | Multi-Asset  | MT4 Version Available Full Setup Guide & Strategy Playbook: https://www.mql5.com/en/blogs/post/768683 The ICT Power of Three (PO3): The Complete Guide to Accumulation, Manipulation, and Distribution https://www.mql5.com/en/blogs/post/771729 MT4 Version: https://www.mql5.com/en/market/product/171742 Indicator Overview The ICT PO3 AMD Protocol Framework i
Хватит действовать наугад. Знайте, когда входить, где выходить и в какую сторону склоняется рынок, всё на одном графике. RelicusRoad Pro собирает почти двадцать инструментов в один индикатор, а вы включаете те, которые подходят вашему стилю торговли. Чёткие входы. Чёткие выходы. План на каждом графике. Знакомо? Вы покупаете, а через минуту цена разворачивается против вас. Вы закрываете сделку слишком рано, а потом смотрите, как движение продолжается без вас. Пять индикаторов на графике, пять раз
CGE Trading Suite
Carl Gustav Johan Ekstrom
5 (2)
Institutional-Grade Analytics for MT5 The full analytical edge of a professional trading desk, built into your MT5 chart. Standard retail platforms lack the depth required for professional market analysis. The CGE Trading Suite bridges this gap, transforming MetaTrader 5 into a comprehensive workspace. By integrating 22 proprietary modules into a single, unified chart interface, the suite eliminates fragmented analysis. It provides definitive clarity across market structure, timing, momentum,
Bill Williams Advanced предназначен для автоматического анализа графика по системе " Profitunity " Билла Уильямса. Индикатор анализирует сразу четыре таймфрейма. Инструкция/Мануал ( Обязательно читайте перед приобретением ) Преимущества 1. Анализирует график по системе "Profitunity" Билла Уильямса. Сигналы помещает в таблицу в углу экрана и на график цены. 2. Находит все известные сигналы АО и АС, а также сигналы зон. Оснащён трендовым фильтром по Аллигатору. 3. Находит "Дивергентный бар", а та
Привет, трейдер! Большинство розничных трейдеров полагаются на запаздывающие веб-скрипты. Для торговли с истинным преимуществом необходима институциональная архитектура. Индикатор Astro AI — это не стандартное наложение графика. Это скомпилированная нейронная сеть с двумя агентами, работающая непосредственно на вашем терминале. Вот точная технология, лежащая в основе системы: 1. Агент 1: Аналитик (Графовые нейронные сети — GNN) Рынки — это не просто изолированные ценовые бары; это взаимосвяз
Superhero
Ihor Otkydach
5 (3)
SUPERHERO индикатор - это мультивалютная торговая система, которая создана по принципу "Все включено". Индикатор самостоятельно анализирует рынок и дает сигналы когда открывать и когда закрывать сделки. Используются ордера Стоп Лосс и Тейк профит. Соотношение R:R = 1:1 Эта система может присылать на смартфон PUSH-уведомления, так что вы сможете делать сделки "на ходу" без привязки к ПК. Отлично подходит для Проп Фирм трейдинга. БОНУС ДЛЯ КАЖДОГО ПОКУПАТЕЛЯ: Каждый покупатель этого индикатора пол
Инструмент для торговли на Форекс нового поколения. Dynamic Forex28 Navigator – это эволюция наших давних, популярных индикаторов, объединяющая силу трёх продуктов в одном: Advanced Currency Strength28 Indicator (700 отзывов) Advanced Currency IMPULSE with ALERT (530 отзывов) CS28 Combo Signals (недавний бонус) Теперь полностью переработан для MetaTrader 5 – быстрее, плавнее и создан для использования нативной мульти-символьной архитектуры MT5. Руководство пользователя: https://www.mql5.com/en/b
Другие продукты этого автора
Smart Chandelier Exit EA Smart Chandelier Exit EA is the Expert Advisor for the Smart Chandelier Exit indicator. It runs the indicator's chandelier engine by itself, with the same formula, the same default settings and the same fake-flip confirmation, and turns the confirmed flips into trades. A flip is traded only when it agrees with the higher timeframe, and every position carries a stop on the broker's server that follows the chandelier line and is never loosened. By default there is no fixed
Smart Chandelier Exit  Smart Chandelier Exit is an adaptive trailing-stop and trend-direction indicator. It plots a multi-layer ratchet stop line that follows price: green below price in an uptrend, red above price in a downtrend. The line only ever ratchets in the trend's favor, never against it, so it doubles as a mechanical trailing stop and a clear trend-state signal. What makes it smart is the built-in Pearson R trend-quality filter. A raw stop line tells you where the stop is; the Pearson
FREE
Donchian Trend Engine  Donchian Trend Engine is an institutional-grade dual-clock trend-following and channel breakout suite engineered for MetaTrader 5, combining Richard Donchian's breakthrough channels with the complete tactical rules of the legendary Turtle Trading experiment . The Two-Clock Architecture Unlike standard Donchian channel indicators that merely compute static highest highs and lowest lows, Donchian Trend Engine is built on a mathematically rigorous two-clock foundation : The P
FREE
MetaTrader's built-in Force Index is not the formula Dr. Alexander Elder published. It multiplies the volume of a bar by the change of a 13-bar moving average of price. Elder defined the force of a bar as its volume times the change of its close, and smoothed that with an exponential moving average. Measured on gold over the last year, the two disagree about which side of zero the market is on roughly one bar in six (M15, H1 and H4). Elder Force Zones computes Elder's own definition and builds h
FREE
Refine OBV  Refine OBV measures cumulative volume flow read against its own adaptive signal line with a color-coded spread and non-repainting divergence detection. Raw On Balance Volume answers one question: is volume being credited to the buyers or the sellers? While useful, raw OBV is a single wandering line with no reference point. Refine OBV adds an adaptive EMA of the flow itself as a reference line. The distance between the flow and its signal line (the spread) is rendered as a color-coded
FREE
Smart Exit EA
Bugra Kaan Yildirim
Smart Exit EA — Ride the Trend, Skip the Chop Smart Exit EA follows a trend with an adaptive ATR trailing line and stays in the move until the trend really turns. It is built for two problems every trend trader knows: getting shaken out of a good trade too early, and getting chopped up in a sideways market. Release notes, chart examples and new product announcements are posted on the TrendTower channel:   https://www.mql5.com/en/channels/trendtower What It Does Rides trends longer.   The trailin
FREE
Quant Trend Cloud A cloud that is a regime, not a thread: the band between two slow adaptive lines. No arrows and no dots - the colour says which way the regime stands, and the brightness says whether the candle and the fast line stand clear of the band on that bar. Version 1.0. Release notes, chart examples and new product announcements are posted on the TrendTower channel: https://www.mql5.com/en/channels/trendtower What It Is The cloud is the band between Kaufman's adaptive average and VIDYA.
FREE
Trix Trend algoteknik · MetaTrader 5 Indicator Manual Overview Trix Trend is a momentum oscillator based on TRIX — the rate of change of a triple-smoothed exponential moving average of price. Triple smoothing removes most of the short-term noise, so the oscillator reacts to the underlying momentum of the move rather than to every small wiggle, while staying more responsive than a simple long moving average. The indicator draws a slope-colored TRIX line, a weighted signal line, a zero line, and t
FREE
SVS Assistant
Bugra Kaan Yildirim
SVS Assistant SVS Assistant is the execution half of Smart Volatility Squeeze MT5. It carries out the orders you request from that indicator's 1-Click Trading Desk, applies your risk rules to them, and manages the resulting positions. It is published free of charge. Please read this before downloading: it does not analyse the market and it produces no signals of its own. Without the Smart Volatility Squeeze indicator running on the same chart there is nothing for it to listen to, and it will do
FREE
Smart Volatility Squeeze MT5 Smart Volatility Squeeze MT5 is a volatility compression and momentum expansion indicator for MetaTrader 5. It builds on John Carter's Volatility Squeeze framework and extends the usual single-tier squeeze into three compression tiers, so you can see not only whether the market is compressed but how tightly it is compressed before it expands. The indicator opens in a separate window and draws two elements: a linear regression momentum histogram and a row of coloured
Quant Desk Pro
Bugra Kaan Yildirim
Quant Desk Pro An R-native trade manager for MetaTrader 5.   It manages the trades you have already opened: it measures what each one is really risking, protects it, scales out of it on a plan you set, trails what is left, and stops the whole book when the day has gone far enough wrong. Read this first.   Quant Desk Pro does not open trades and has no signal. And it ships in   VIEW ONLY : it will not send a single order until you set   I understand the risks   to true in the inputs. Until you do
Trend Regime Line Version 1.1 · algoteknik What This Indicator Is Trend Regime Line reads the trend through a triad: three Larry Williams tools that each answer their own question, and one line on the price chart that is coloured only when the answers fit together. Williams %R says which side price is thrusting to, the Ultimate Oscillator whether momentum confirms that side, and Williams Accumulation/Distribution whether buying or selling pressure still backs it. Green means the triad agrees on
Фильтр:
Нет отзывов
Ответ на отзыв