Volume Profile Multi Period Profile MT5
- Индикаторы
- Версия: 1.1
- Активации: 5

Volume Profile
Stop guessing where the real money traded. See it.
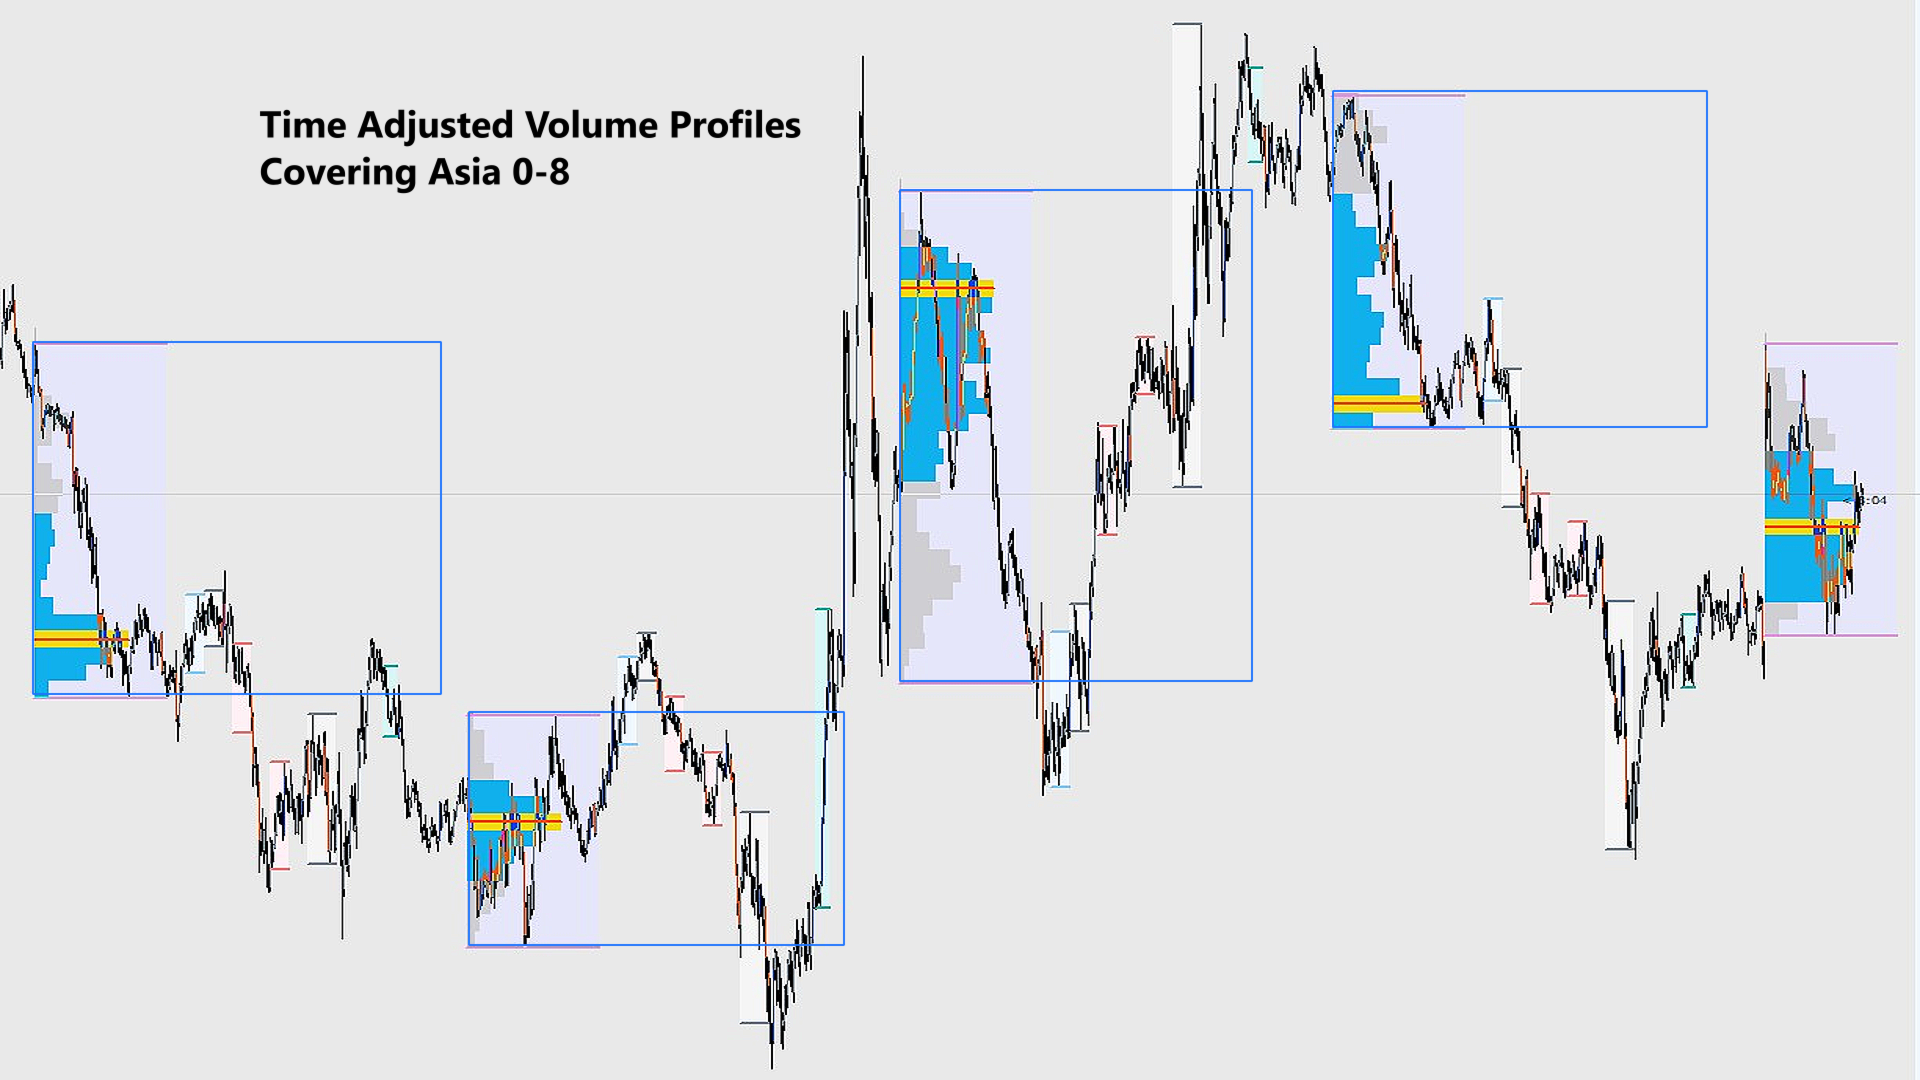
Volume Profile — multi-mode, multi-profile, with POC / Value Area / Peaks & Valleys drawn directly on your chart.
Most volume tools dump a histogram at the bottom of your screen and make you guess which price level actually carried the volume. Volume Profile puts the volume where the price is — on the chart, at the price levels where money actually changed hands. You see the value area, the control point, the rejection tails, and the accumulation zones. No guessing, no eyeballing.
What you see
- POC (Point of Control) line — the single price level with the most traded volume in the profile. The market's own fair price for that range.
- Value Area (VAH / VAL) — the price band where 70% of the volume traded (configurable — 70%, 80%, any %). Outside the value area = price extremes where volume was thin and reversals are likely.
- Profile bars — horizontal volume bars drawn at each price level, so you instantly see where money clustered and where it didn't.
- Peaks & Valleys (toggleable) — local maxima and minima of the volume curve, marked as support/resistance shelf levels. The levels the market often bounces off.
- Profile outline (toggleable) — clean outer envelope around the profile for traders who prefer minimal visuals.
- Up to 10 simultaneous profiles on the same chart — see how volume shifted across the last 10 days, weeks, or custom windows.
7 profile modes — one indicator, every workflow
| Mode | What it does | Use case |
|---|---|---|
| Visible Range | Profiles exactly the bars you see on screen | Quick read of the current price action |
| Start Date → Now | Profiles from a chosen date to the current bar | Track accumulation since an earnings/news event |
| Date → Date | Profiles a fixed historical window | Backtest volume behavior around past events |
| Bar Count | Profiles the last N bars | Fixed-window analysis without date math |
| Trading Session | Profiles only bars inside your session hours | Day traders — exclude overnight noise |
| Multi-Profile (Fixed) | Up to 10 profiles, Daily / Weekly / Monthly / Quarterly / Yearly | See volume migration across periods |
| Multi-Profile (Time Range) | Up to 10 profiles, each on a custom time range | Custom session windows,.daily or weekly intraday study |
Why this pays for itself?
- Find the fair price the market agreed on. POC is where most volume changed hands — that's the level institutions defend. Price reacts at POC, and now you know where it is before the reaction, not after.
- Spot rejection before it confirms. Price spikes outside the Value Area (VAH/VAL)? That move usually reverts. The Value Area bands make the rejection visible at a glance.
- Trade with the shelves. Peaks and valleys in the volume curve act as price shelves — support below, resistance above. Same logic institutions use, on your MT5 chart.
- Compare volume across periods. With up to 10 profiles on the same chart, you see whether the buyers are actually committing further or just defending yesterday's level. That's the difference between a trend and a trap.
- Stop guessing with bottom-panel histograms. A histogram tells you "a lot traded." Volume Profile tells you "a lot traded at this exact price." That's the difference.
Inputs you control
Profile mode & window:Profile mode (7 modes), lookback days, bar count, start date, end date, session hours, multi-profile time window (HH:MM to HH:MM)
Multi-profile:Interval (Daily/Weekly/Monthly/Quarterly/Yearly), max profiles shown (up to 10)
Calculation:Price step (tick size), Value Area % (default 70), bin width, max price levels, minimum volume % threshold
Display — position & color:Profile side (left/right), width, max history bars loaded, profile color, Value Area color, POC bar color, POC line color, peak color, valley color
Display — lines:Show POC line (on/off), show outer outline (on/off), outline minimum volume %, show peaks & valleys (on/off), line width
Setup time: 90 seconds
- Attach to chart
- Pick profile mode (defaults to Visible Range — works immediately)
- Set price step to match your symbol (one-time per symbol: forex ~0.0001, indices ~0.1)
- Set Value Area % (default 70 — leave it unless you have a reason)
- Read the chart — POC line, Value Area, peaks/valleys all on by default
No DLL. No external files. Drop the .ex5 in your indicators folder and run.
Why this Volume Profile, not the free ones on Market
Free MT5 volume profile indicators usually give you one mode (visible range only), one profile at a time, no peaks/valleys, no session filtering, no multi-period. You're left doing the date math, the session math, the "where did the volume migrate" math — all in your head.
This one gives you:
| Feature | Free MT5 Volume Profiles | This Volume Profile |
|---|---|---|
| Visible Range profile | Sometimes | ✓ |
| Start-Date → Now | Rare | ✓ |
| Date → Date backtest | Rare | ✓ |
| Bar Count | Rare | ✓ |
| Session-only filter | Rare | ✓ |
| Multi-profile (up to 10) | Almost never | ✓ |
| Multi-period (D/W/M/Q/Y) | Never | ✓ |
| Custom multi-profile time range | Never | ✓ |
| POC line + Value Area bands | Sometimes | ✓ |
| Peaks & valleys as S/R shelves | Never | ✓ |
| Profile outline | Rare | ✓ |
| No DLL crash risk | ✓ | ✓ |
Compatibility
MetaTrader 5 only · All timeframes · All symbols (forex, indices, crypto, equities, commodities)
Limitations (so you know before you buy)
- Price step must match your symbol's tick size or profile bars won't align to real prices. One-time setup per symbol.
- Up to 10 concurrent profiles in multi-profile modes — enough for almost any workflow, but if you need 50 micro-profiles on one chart, this isn't the tool.
- POC / VAH / VAL / peaks / valleys drawn as chart objects (lines and bars). For traders who want only a single bottom-panel histogram, this is more visual — not less.
- Doesn't draw a VWAP line — POC is shown explicitly, but VWAP is not rendered as a separate line. If you want VWAP on the same chart, see my VWAP indicator (sold separately) — they pair cleanly.