Box Volume Profile
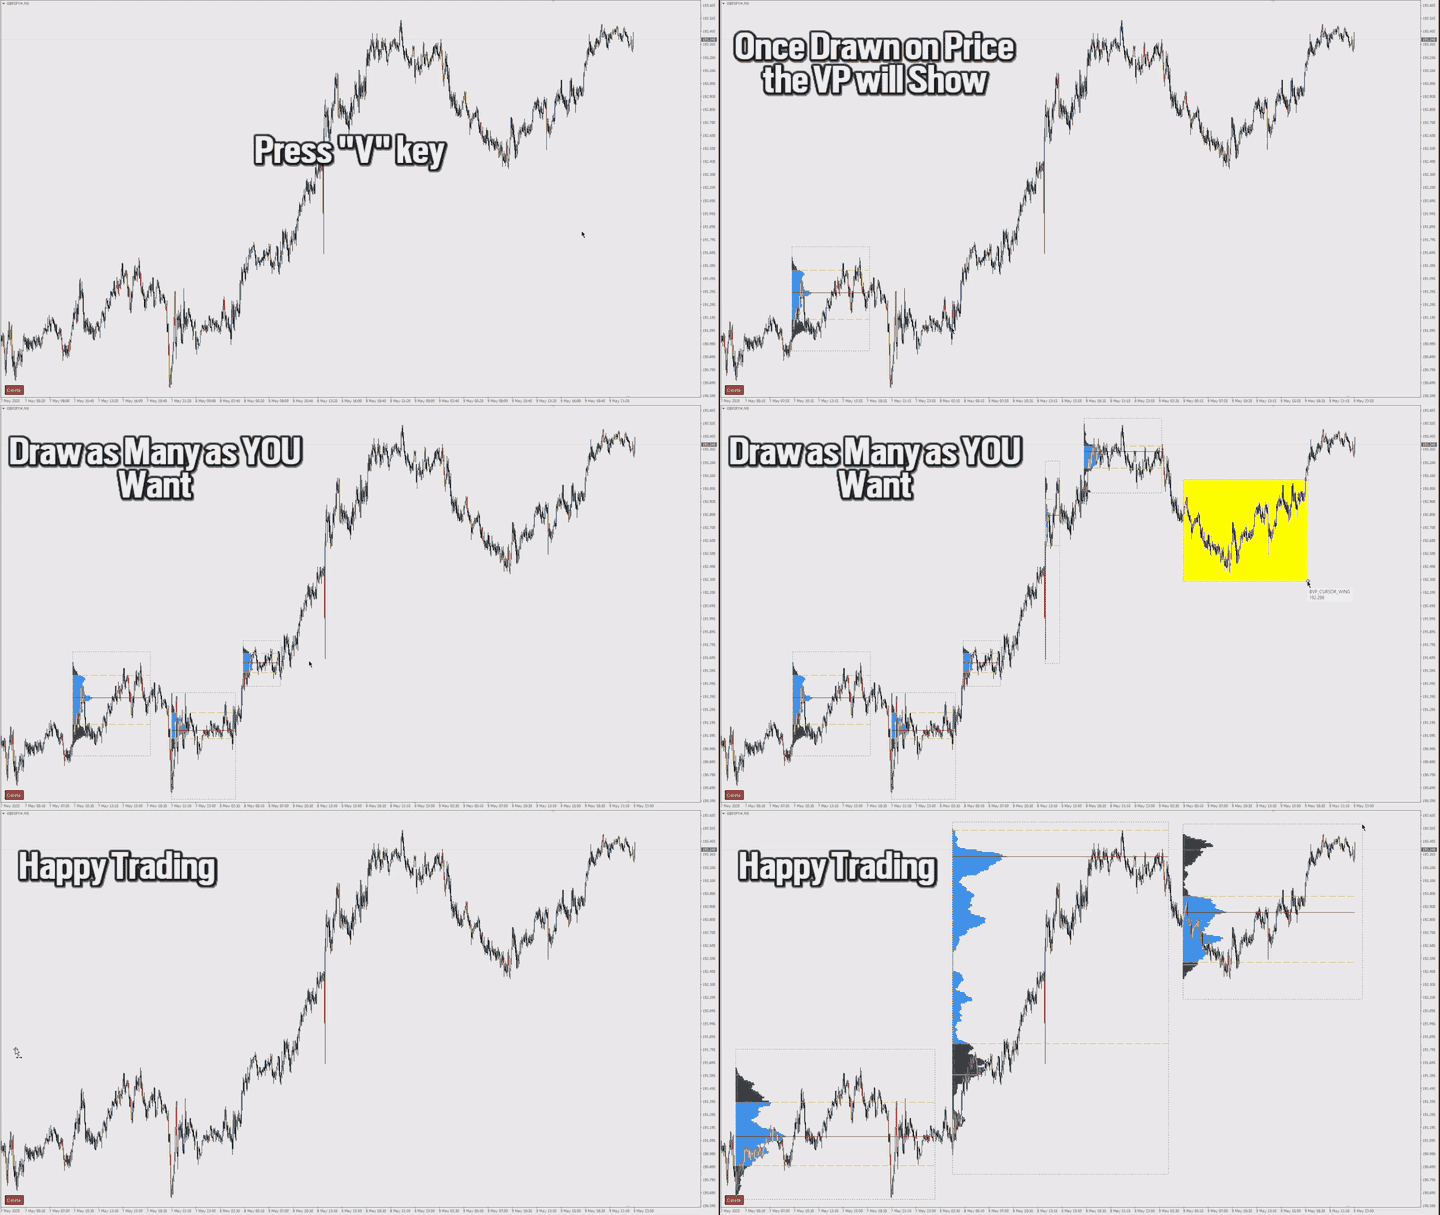
Box Volume Profile draws a volume histogram inside any rectangle you place on the chart. Choose a time window and a price range, and the indicator shows how much volume was traded at each price level inside that zone. It also plots the Point of Control (POC) and the Value Area boundaries (VAH and VAL).
How to use
Press the draw hotkey (the letter V by default) and drag a rectangle anywhere on the chart. The volume profile appears immediately inside the box. Move or resize the box at any time and the profile, POC and Value Area lines update on the fly. New bars that fall inside the box are added to the profile automatically.
What the profile shows
- A volume histogram with rows aligned to a fixed price step, so rows have the same height on every box.
- The POC line marking the price level with the highest traded volume inside the box.
- The Value Area (VAH and VAL) containing the percentage of volume you select, expanded from the POC in both directions.
- Each bar's volume is distributed evenly across its high-to-low range, so the profile follows the actual price action inside the box.
Features
- Place unlimited boxes on one chart, each with its own independent profile.
- Live recalculation when a box is moved, resized, or when new bars arrive.
- A one-click Clear button removes all boxes and their drawings. Boxes deleted by hand are cleaned up automatically, with no leftover objects.
- Works on any symbol and any timeframe.
Settings
Profile calculation:
- Price Step — the price height of one histogram row.
- Ticks Per Row — how many price steps form one row.
- Value Area % — percentage of volume inside the Value Area, 70 percent by default.
Appearance:
- Colors for the profile bars, Value Area bars, POC, VAH and VAL lines, the box and its frame.
Interface:
- Draw Hotkey — the key that starts box placement.
- Profile Width % — maximum histogram width as a percentage of the box width.
- Box Name Prefix — name prefix for placed boxes.
- Show Clear Button — show or hide the Clear button.
Notes
The profile is built from tick volume, which is the volume data MetaTrader 4 provides. On symbols and timeframes with low activity, increase Ticks Per Row to get fewer, wider rows. All settings apply to every box on the chart, and each profile is recalculated from the chart history when the indicator reloads.