MT5 trendlines breaks
- Индикаторы
-
Yan Zhen Du
 With over 13 years of experience in live trading and developing algorithmic strategies, we are proud to offer some of the most powerful and reliable Expert Advisors (EAs) for MetaTrader 4 and 5. Our tools are carefully designed to analyze real-time market movements, adapt seamlessly to changing
 - Версия: 1.0
- Активации: 5
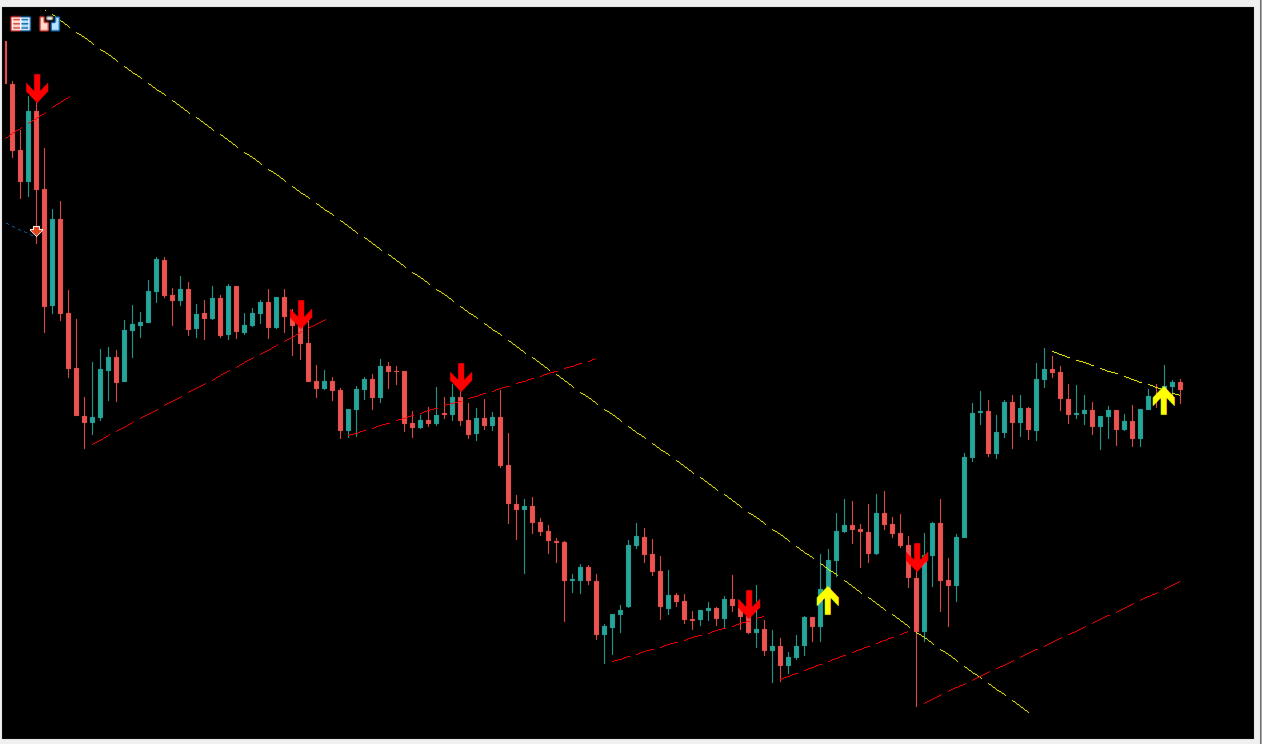
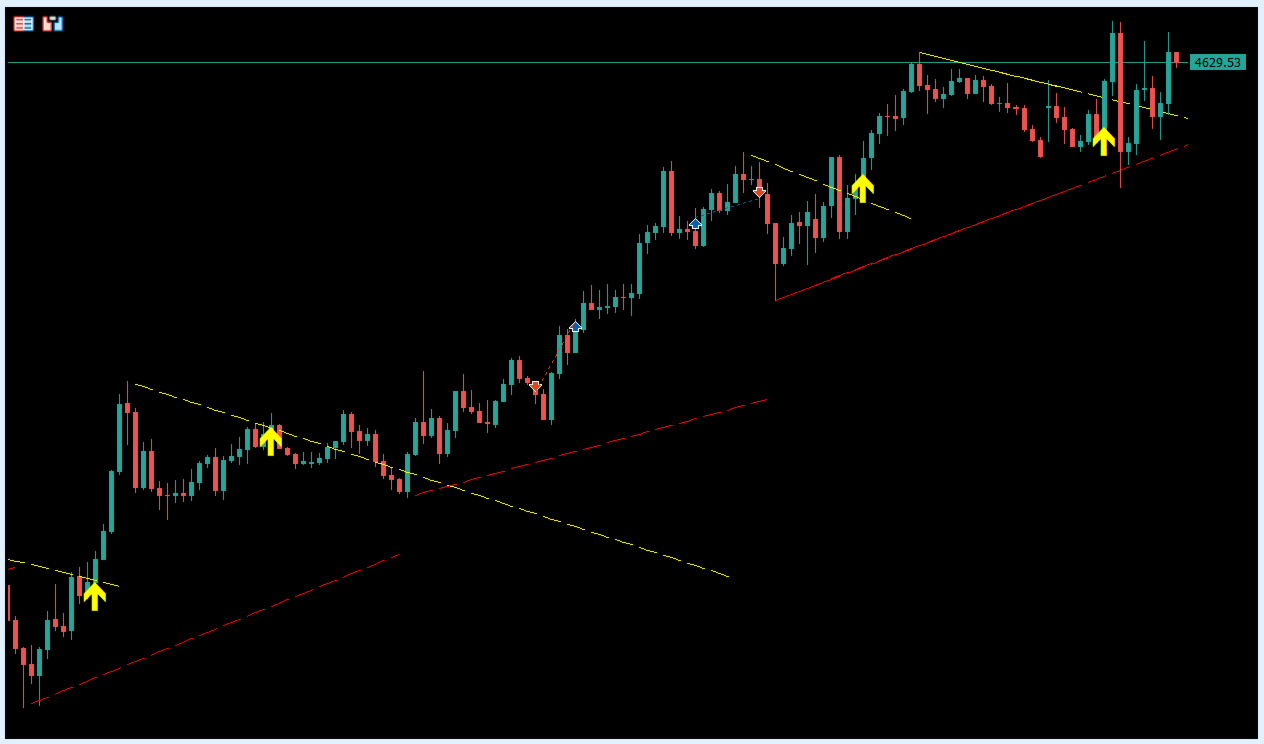
Trendlines Breaks is a MetaTrader 5 indicator designed to automatically detect dynamic trendlines and identify potential price breaks. The indicator analyzes pivot points, calculates trendline slopes, and displays breakout signals when price moves beyond detected trendline levels.
The indicator helps traders analyze market structure by displaying upper and lower trendlines together with breakout markers. It supports different slope calculation methods, including ATR-based, standard deviation-based, and linear regression-based calculations.
There are even better indicators—get them here.
https://www.mql5.com/en/users/aa996a/sellerMain Features
Automatic Trendline Detection
The indicator identifies important pivot highs and pivot lows from price data and uses them to create dynamic trendlines.
Trendline Break Detection
When price breaks above a downward trendline or below an upward trendline, the indicator generates breakout signals using arrow markers on the chart.
Multiple Slope Calculation Methods
Usage
Trendlines Breaks can be used on different symbols and timeframes for analyzing trend direction, support and resistance areas created by trendlines, and possible breakout movements.
The indicator is suitable for traders who use trendline analysis, price action methods, and breakout strategies.