Squeeze Breakout AF
- Индикаторы
-
Alexandre Favero
 My Journey in the Financial Market
I began my journey in the financial market in 2006, at a time when access to complete and well-structured educational materials on the subject was scarce. Faced with this gap, my learning came largely through self-directed study and hands-on experience. - Версия: 1.0
- Активации: 5
Price Compression Indicator Based on Financial Volume Levels
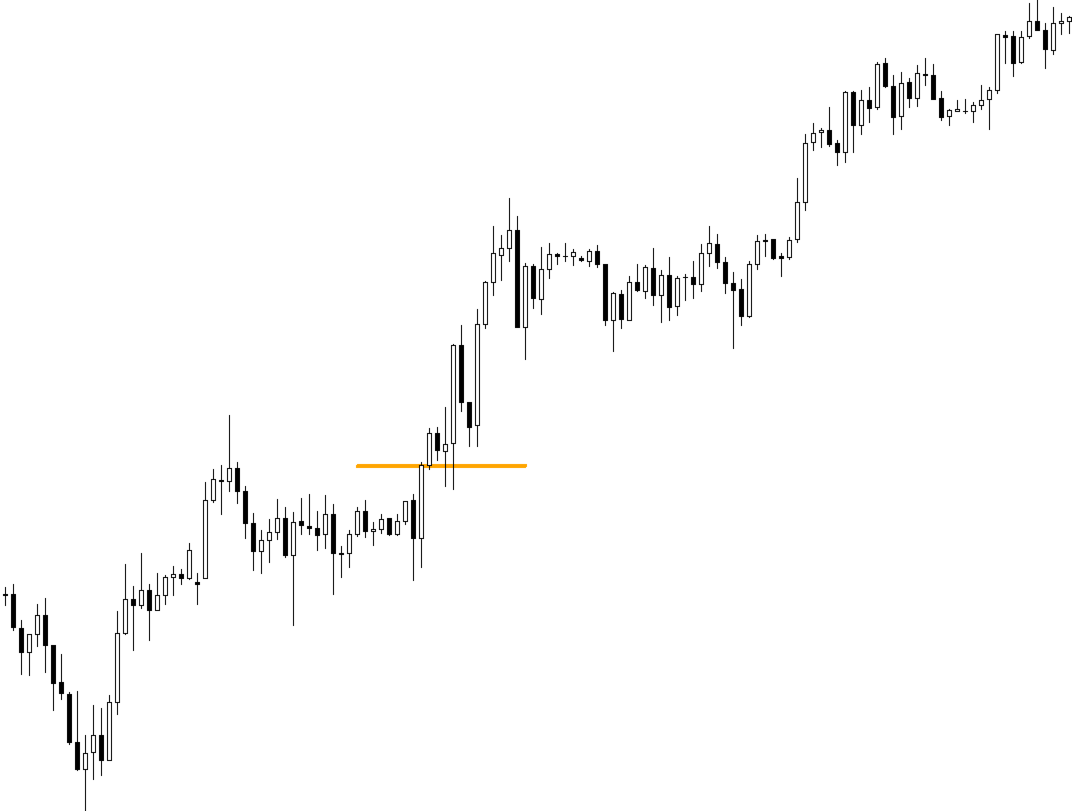
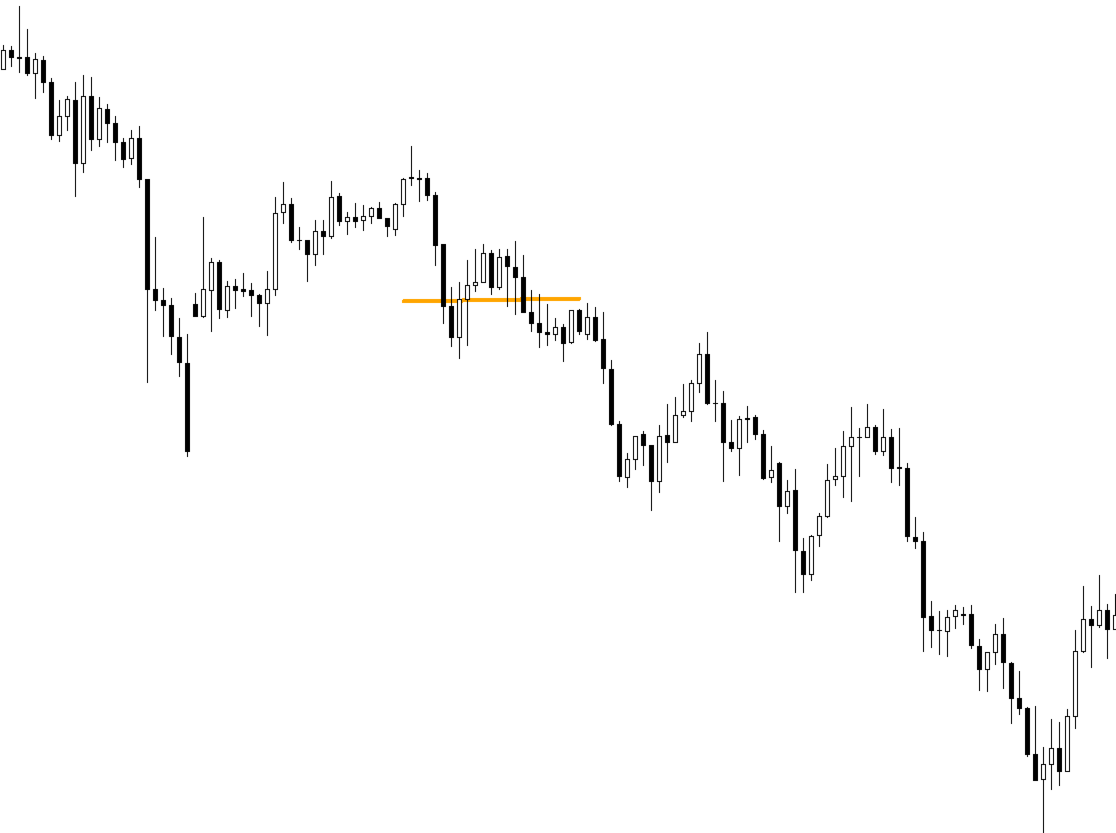
This indicator was developed to identify price compression regions associated with relevant financial volume levels, using horizontal lines on the chart to highlight areas that may present greater market interest.
The system monitors price behavior within these regions, considering different possibilities such as continuation, breakouts, rejections, and potential false breakouts. Therefore, the horizontal lines represent areas for study and monitoring, rather than automatic entry or exit signals.
The interpretation of the indicator should always consider the market context. A compression region may act as an area where the market accumulates strength before continuing its movement, or as a zone where a breakout attempt loses strength and results in a false breakout.
Use as a Study Tool
The horizontal lines displayed on the chart can be used to:
-
Identify areas of price concentration and compression.
-
Observe potential trend continuation zones.
-
Monitor potential breakouts of identified levels.
-
Evaluate false breakouts and price rejections.
-
Compare price behavior with financial volume.
-
Search for confluences with other technical analysis tools.
The purpose is not to use an individual line as an entry trigger, but to study market behavior when price approaches, tests, breaks, or rejects these regions.
Confluence with Technical Analysis
Because this is an indicator, its use should be integrated with a technical analysis framework defined by each individual user. The identified regions can be combined with tools such as support and resistance, trend analysis, moving averages, volume, Fibonacci levels, price action, volatility, and other indicators according to the user's methodology.
Each user has the freedom to develop their own analytical approach, using this indicator as an additional layer of information and confluence.
Important
The indicator identifies potential areas of interest based on probability and price behavior. It does not determine with certainty whether the market will continue, reverse, or produce a false breakout.
Therefore, each participant should validate the system through their own studies, analytical criteria, risk management, and trading methodology.
The primary purpose of this indicator is to provide a visual tool for analyzing areas where the market may experience price compression, expansion, continuation, or failed breakouts, allowing users to combine these observations with their own technical analysis system.