Absorption AF
- Индикаторы
-
Alexandre Favero
 My Journey in the Financial Market
I began my journey in the financial market in 2006, at a time when access to complete and well-structured educational materials on the subject was scarce. Faced with this gap, my learning came largely through self-directed study and hands-on experience. - Версия: 3.20
- Активации: 5
Indicator Description
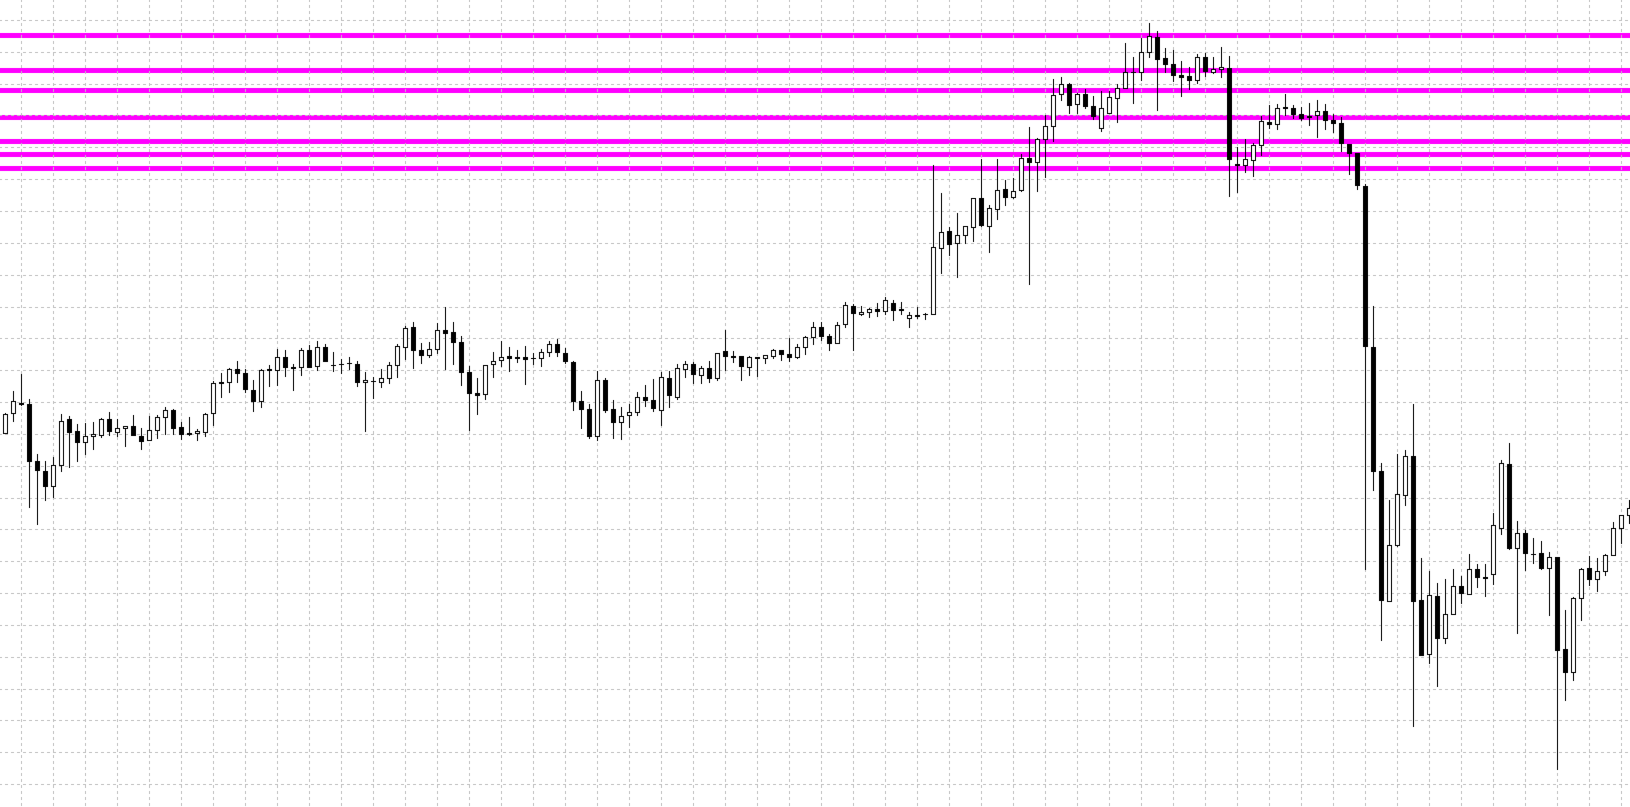
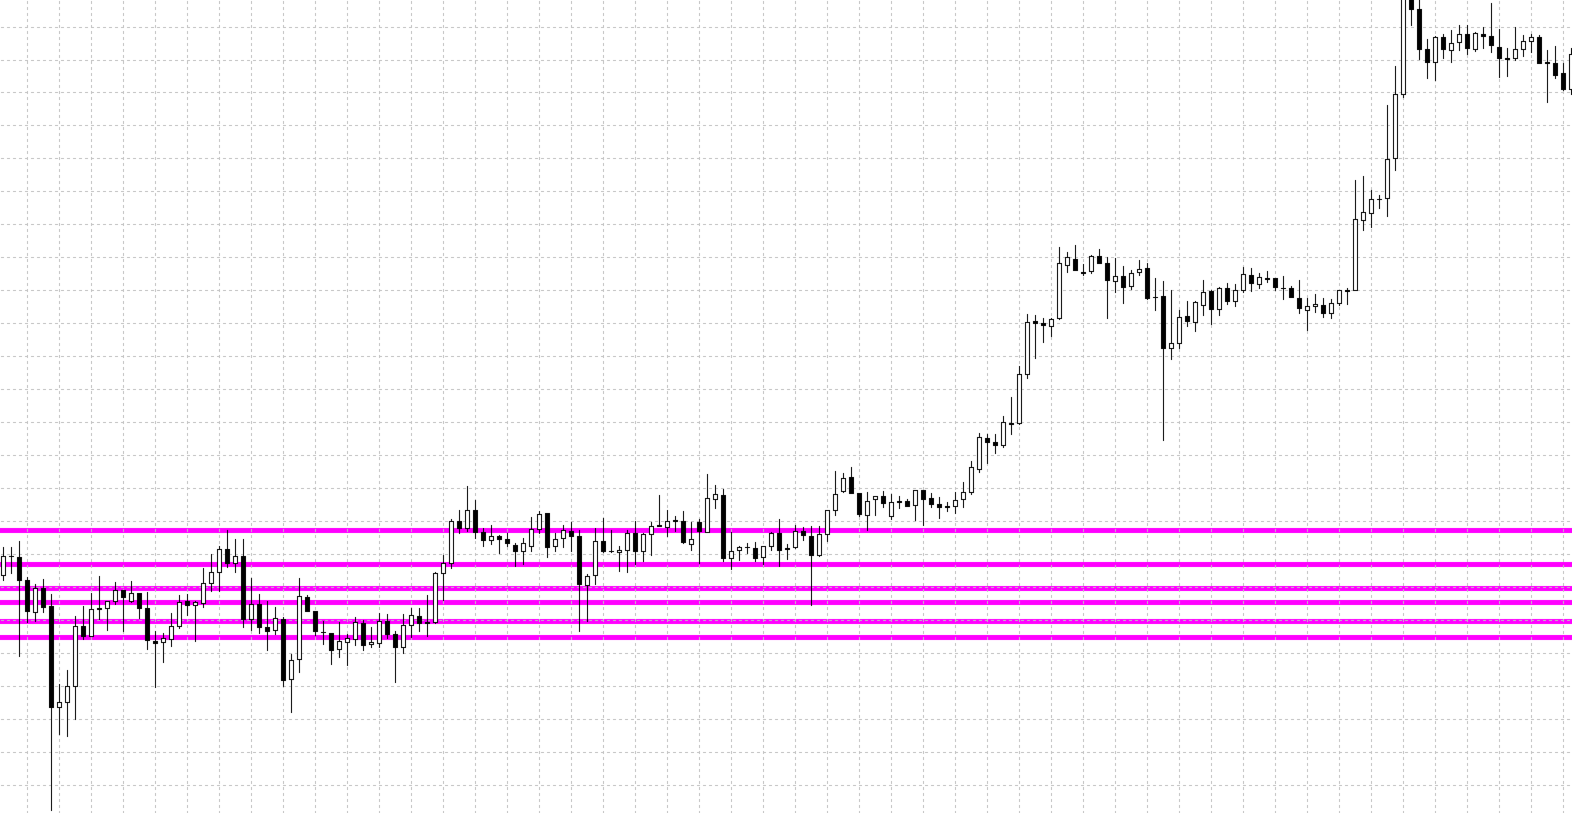
This indicator was developed with the purpose of combining the structure of highs and lows from higher timeframes with confluences generated by different technical indicators.
Through the use of multiple horizontal lines, the system highlights relevant market regions that can be used for study, monitoring, and analysis of price behavior.
The lines are designed to assist in identifying:
-
Market areas of interest;
-
High and low structures from higher timeframes;
-
Areas where price may continue the prevailing trend;
-
Regions where price may show reactions, weakening, or changes in behavior;
-
Potential areas of trend continuation or changes in the directional movement of prices;
-
Confluences between different technical signals and indicators;
-
Areas where price behavior deserves greater attention and monitoring.
The purpose is to use these regions as areas for study and monitoring, allowing traders to observe how price reacts when reaching relevant technical levels.
The indicator does not attempt to determine in advance whether the market will continue or change its trend. Instead, it seeks to highlight regions where this market decision may become more relevant, allowing the user to monitor price action and evaluate whether additional confirmations are present.
Each participant can use these regions together with their own analysis system, technical indicators, volume analysis, market structure, moving averages, Fibonacci levels, price patterns, or any other criteria that are part of their individual methodology.
Indicator Objective
The main objective is to provide a visual framework for technical confluence, making it easier to identify important market regions and monitor potential movements of trend continuation, correction, or directional change.
The horizontal lines serve as references for analysis, rather than definitive predictions of future price behavior.
Important: The lines and regions identified by the indicator should not be used alone as automatic entry or exit triggers. They represent areas for study and monitoring that may have greater technical relevance and should be evaluated together with other market factors and confirmations.
In this way, the indicator is designed to function as a complementary analysis and confluence tool, providing greater visual organization for studying market structure while allowing each user to apply their own trading methodology to the identified regions.