Squeeze Breakout AF

Price Compression Indicator Based on Financial Volume Levels

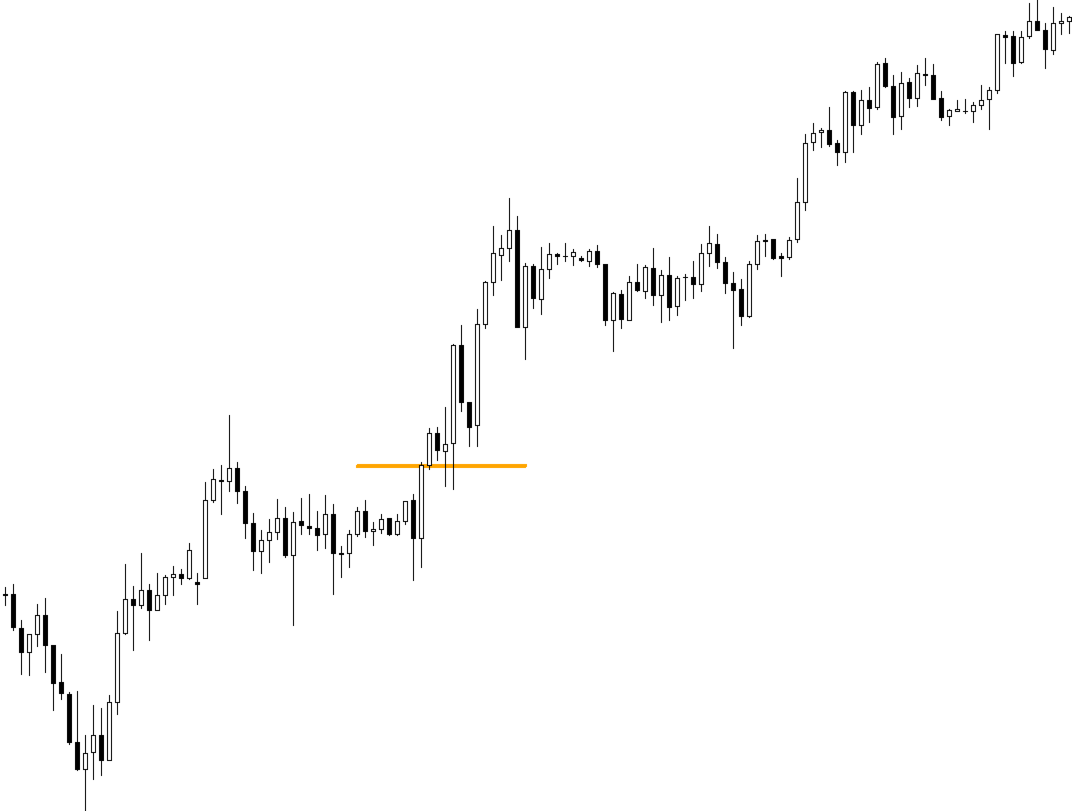
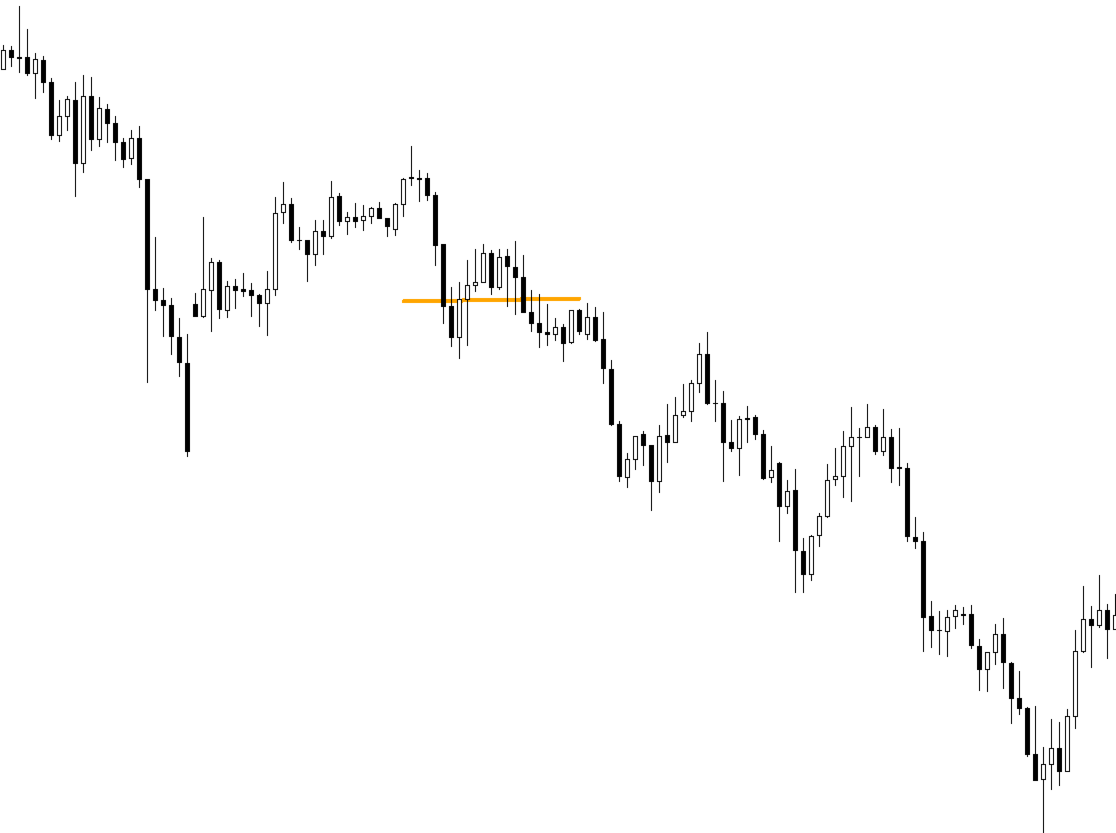
This indicator was developed to identify price compression regions associated with relevant financial volume levels, using horizontal lines on the chart to highlight areas that may present greater market interest.

The system monitors price behavior within these regions, considering different possibilities such as continuation, breakouts, rejections, and potential false breakouts. Therefore, the horizontal lines represent areas for study and monitoring, rather than automatic entry or exit signals.

The interpretation of the indicator should always consider the market context. A compression region may act as an area where the market accumulates strength before continuing its movement, or as a zone where a breakout attempt loses strength and results in a false breakout.

Use as a Study Tool

The horizontal lines displayed on the chart can be used to:

  • Identify areas of price concentration and compression.

  • Observe potential trend continuation zones.

  • Monitor potential breakouts of identified levels.

  • Evaluate false breakouts and price rejections.

  • Compare price behavior with financial volume.

  • Search for confluences with other technical analysis tools.

The purpose is not to use an individual line as an entry trigger, but to study market behavior when price approaches, tests, breaks, or rejects these regions.

Confluence with Technical Analysis

Because this is an indicator, its use should be integrated with a technical analysis framework defined by each individual user. The identified regions can be combined with tools such as support and resistance, trend analysis, moving averages, volume, Fibonacci levels, price action, volatility, and other indicators according to the user's methodology.

Each user has the freedom to develop their own analytical approach, using this indicator as an additional layer of information and confluence.

Important

The indicator identifies potential areas of interest based on probability and price behavior. It does not determine with certainty whether the market will continue, reverse, or produce a false breakout.

Therefore, each participant should validate the system through their own studies, analytical criteria, risk management, and trading methodology.

The primary purpose of this indicator is to provide a visual tool for analyzing areas where the market may experience price compression, expansion, continuation, or failed breakouts, allowing users to combine these observations with their own technical analysis system.
おすすめのプロダクト
Dynamic Trend Channel Ultimate for MT5 (M30) Professional Trend-Following & Smart Signal System Dynamic Trend Channel  is an advanced trend-following indicator designed specifically for the M30 timeframe on MetaTrader 5. It combines dynamic trend channels, adaptive volatility calculations, smart trend detection, trailing stop technology, and real-time signal generation to help traders identify high-probability market opportunities with greater confidence. Built around a dynamic EMA-based channel
Fibonacci Auto Levels Pro MT5 – リトレースメント、エクステンション、ピボットポイント Fibonacci Auto Levels Pro MT5 は、市場のスイングポイントを自動的に検出し、完全なフィボナッチ・リトレースメント、エクステンション、およびピボットポイントの構造をチャート上に描画する高度なテクニカル分析ツールです。 このインジケーターは、いくつかの独立したシステムを統合された単一の分析ツールに組み合わせています。 ピボットポイント (フィボナッチモード) ピボットポイントは、前期間の値幅に基づいて、潜在的なサポートおよびレジスタンスゾーンを特定するために使用されます。 このインジケーターは、前回の高値 (High)、安値 (Low)、終値 (Close) にフィボナッチ比率を適用して計算される フィボナッチ・ピボットポイント を使用します。 ピボットポイントの時間足は、手動で設定することも、以下のロジックを使用して自動で設定することもできます。 日中取引 ≤ 5 分 → 4 時間足 5–45 分 → 日足 45 分–4 時間 → 週足 日足
Top indicator   for MT5   providing alert and notification for symbols if any price freezes! Guys, try to buy at least one month version for testing purposes! This indicator displays the current time for multiple Forex pairs and alerts when there's a disconnection between broker and PC time. It'll be very help full for trading platforms administrator who are monitoring hundreds of symbols in a time.
RSImaxmin
Carlos Andrés Moya Erazo
4.5 (10)
The indicator shows when there are overprice and divergences on the RSI. In addition, it has configurable alerts, dynamic overprice levels and a special “RSI cleaner” function. The indicator that automatically calculates the premium rates! RSImaxmin is an indicator based on the Relative Strength Index (RSI) oscillator that effectively identifies changes in price trends as it reflects the relative strength of bullish movements compared to bearish movements. It is widely used by traders to measur
PatternGuard VWAP Trader — A uthor's  Smart Trading Advisor for VWAP Breakout and Pattern-Based Entries PatternGuard VWAP Trader is a professional Expert Advisor for MetaTrader 5 designed to identify trading opportunities after price exits a dynamic NO TRADE zone based on VWAP and volatility bands. The main idea of the system is simple and effective: avoid trading inside uncertain, low-quality market zones and look for entries only when price breaks out of consolidation, confirms direction with
Fibonacci Pips MT5 Instant Fibonacci Levels, Prices and Pip Distances Fibonacci Pips MT5 is a practical Fibonacci measurement tool for MetaTrader 5. It displays each Fibonacci level together with its exact price and pip distance, helping traders plan pullbacks, profit targets and stop-loss levels without manual calculations. Instead of seeing only percentages such as 38.2%, 50.0% or 61.8%, traders can immediately understand: The Fibonacci level The exact market price The pip distance from the re
Fimoku
Michel Henriques
Pode ser usado Fimathe sem Ichimoku.                                   "Parâmetros Expert" Magic Number Ativar Negociacao Periodo Hora de Inicio de Abertura de Posicoes Minuto de Inicio de Abertura de Posicoes Hora de Encerramento de Abertura de Posicoes Minuto de Encerramento de Abertura de Posicoes Carregar Indicador no Grafico Ativar Notificacoes                                                   "Ordem" Desvio em Pontos Preenchimento da Ordem Tipo de Ordem Inverter Tipo de Ordem Ordens co
Boleta do Bruxo
Marcio De Medeiros Vieira
GUIA RÁPIDO: BOLETA BRUXO MAPRIS ️ Configuração Inicial Obrigatória Ao arrastar a boleta para o gráfico, antes de clicar em OK, atente-se a dois detalhes: Permitir o Robô Operar: Na aba Comum , marque a caixa "Permitir Trading Algorítmico" . Certifique-se também de que o botão Trading Algorítmico no topo do seu MetaTrader 5 esteja verde . Múltiplos Gráficos (Magic Number): Na aba Parâmetros de Entrada , altere o valor de InpMagicNumber se for abrir mais de um gráfico. Exemplo: Gráfico 1 (Í
This indicator reads price movement data based on the selected timeframe,it automatically retrieves data from Bloomberg and,to some extent,Investing.com. Instructions on how to use it will also be provided to ensure proper operation. Thank you. It is extremely easy to use and perfectly suited for everyone—from those just starting out in trading to experienced traders. We have spent a considerable amount of time preparing everything; if you are interested in subscribing, please contact our operat
Prop Firm Challenge Tracker Prop Firm Challenge Tracker は、プロップファーム(資金提供会社)の評価ルールを、ご自身の MetaTrader 5 アカウントに適用するためのユーティリティツールです。利益目標、1日のドローダウン、最大ドローダウンをリアルタイムで監視し、現在の評価状況をチャート上に直接表示します。 このツールは、実際のプロップファームチャレンジに参加する前に、合格に必要な取引規律を練習したいトレーダー向けに設計されています。 このツールは、自動的に注文を出したり、既存の注文を変更したり、独自に取引シグナルを生成したりすることはありません。アカウント上ですでに実行されている取引活動(手動取引または別の Expert Advisor による取引)を監視し、設定されたルールを適用するだけです。 また、チャートに適用した銘柄だけではなく、アカウント上で取引されているすべてのシンボルを監視します。 動作方法 任意のチャートにツールを適用します。その時点の口座残高を評価開始時の基準値として記録します。 その後、現在の Equity
GoldEdge US30 — Dedicated Indices Edition for US30, DE40 / GER40 and FRA40 / F40 , powered by the GE ATR Price Border system, dual-layer hedging, ATR volatility control and per-symbol cut loss protection. GoldEdge US30 is a next-generation MT5 Expert Advisor built specifically for major index markets. It uses structured grid-style entries and adaptive position scaling, guided by ATR Ratio, GE ATR Price Border levels, spread control, and mechanical direction logic. Instead of adding positions bl
Ultimate Double Top & Bottom (Pro Volume Matrix) Stop trading retail breakouts. Start trading Institutional Traps. The   Ultimate Double Top & Bottom   is not a standard, lagging pattern scanner. It is a highly advanced, non-repainting structural engine equipped with a proprietary   3-Leg Volume Matrix . Designed exclusively for Smart Money Concepts (SMC) and order flow traders, this indicator mathematically dissects the tick volume inside M and W patterns to reveal true institutional intent:  
Guardian Trader は、トレンド市場において最も早い段階での押し目機会を捉えるように設計された、高度なトレンドフォロー系エキスパートアドバイザーです。 プロフェッショナル級の資金管理システムを核として構築されており、持続可能な成長、一貫した結果、そしてお客様のトレード資本の強固な保護を実現します。 精密なトレンドエントリー Guardian Traderは市場のトレンドを識別し、最も最適なプルバックポイントでのみ取引を実行します。これにより精度を最大化し、不必要なエクスポージャーを最小限に抑えます。 簡単セットアップ 設定が必要な主要パラメータは1つだけ:取引あたりのリスクパーセンテージ。 その他すべての設定は、安定した、プロフェッショナルで安全なパフォーマンスのためにロックされ最適化されています。 自動リスクコントロール 推奨しきい値以上のリスクを入力してしまいましたか?Guardian Traderは自動的に新しい取引をブロックし、お客様の口座を過剰なレバレッジや危険なドローダウンから守ります。 完全な自立性と信頼性 API、サーバー、または第三者サービスは一切不要で
Volume Zone Analyzer — VSA-Based Volume, Delta & Spread Reader Turn any price zone into a Volume Spread Analysis. Drop two draggable lines on your chart to mark a Zone Start and Zone End , and Volume Zone Analyzer instantly breaks down what happened inside that zone: Total Volume for the selected range Buy / Sell Delta — estimated from where each candle closes within its own high-low range Delta % with a visual buy/sell ratio bar Average Spread , plus a count of wide vs. narrow-spread candles (t
FREE
ユーザーマニュアル:ハーモニックパターン OSW MT5 1. 概要と目的 ハーモニックパターン OSW は、フィボナッチレベルに基づいて幾何学的な価格構造を自動検出するように設計された高度なアルゴリズム分析ツールです。このインジケーターは、ジグザグアルゴリズムにリンクされた検索エンジンを使用して市場のノイズをフィルタリングし、価格が反転する可能性が高い領域を特定します。ガートレー、バット、バタフライ、クラブ、シャークなどのパターンを識別し、トレーダーが専門的な精度で市場の反転を予測できるようにします。 2. パラメーターガイド(エントリーメニュー) パターン選択(ハーモニックを表示) 未定義を表示:従来のカテゴリには当てはまらないものの、手動分析に適したフィボナッチ幾何学構造を維持するテクニカル構造を表示します。 ガートレー / バット / バタフライ / クラブ / シャークを表示:戦略に応じて、各パターンの検索を有効または無効にするトグルを個別に切り替えます。 アラートシステム (ALERTS) シグナルオンローソク足:通知のタイミングを定義します。Candle_0 はレ
Indicador Para Opções Binarias. Indicator for Binary Options Usa dois gales. Instalar em mt5 Esse indicador é para ser usado no tempo de vela de 5 minutos e em M5. Este também funciona em M1, porém é mais eficiente em M5. Só descompactar e copiar os arquivos na pasta de dados do seu MT5. Arquivos indicator na pasta MQL5 - Indicator. Baixe também a Media Movel totalmente gratis: https://www.mql5.com/pt/market/product/50400 Esse Indicador é para a próxima vela. Apareceu a seta, só aguardar a próx
The indicator is designed to close positions on the market in time. For example: to take profits ahead of schedule if the price has not reached TakeProfit, and the market is turning around. The indicator analyzes the momentum, not the trend. He does not give any information about the trend. The indicator is well suited for finding divergence. The Ershov 38 Parrots indicator dynamically adjusts to the market and detects price movement impulses of medium and high amplitude. It almost does not rea
SMC Liquidity Core MT5 Professional Smart Money Concepts Expert Advisor for MetaTrader 5 SMC Liquidity Core MT5 is a professional fully automated Expert Advisor designed for traders who want to trade XAUUSD (Gold) using institutional Smart Money Concepts (SMC) . The EA has been carefully developed to identify Liquidity Sweeps , validate Change of Character (CHoCH) , and execute trades only after market structure confirms a potential reversal. Instead of relying on traditional lagging indicators,
ARIPoint is a powerful trading tool designed to generate high-probability entry signals with dynamic TP/SL/DP levels based on price volatility. The integrated performance tracking function displays win/loss statistics, number of PP1/PP2 hits, and success rate, all updated in real time. Key Features: Buy/sell signals with adaptive volatility range Real-time TP/SL/DP levels based on ATR Integrated MA filter with ATR/StdDev volatility option. Performance statistics table (Success, Profit/Loss,
市場のモメンタムを正確に可視化 MultiMA_ICHIMOKU_STO_Color は、3つの強力なインジケーターを1つのスマートなシステムに統合することで、明確な市場シグナルを提供するように設計された包括的なテクニカル分析ツールです。 このインジケーターは、3つのカスタマイズ可能な移動平均線(MA)、一目均衡表の主要要素、およびストキャスティクス・オシレーターを統合しています。そのユニークな特徴は、市場の状況を瞬時に明らかにするインテリジェントなローソク足の色分けシステムです:     強気 (青): 価格が3つのMAすべてを上回り、かつストキャスティクスが50を超えている場合。強い上昇モメンタムを示します。     弱気 (赤): 価格が3つのMAすべてを下回り、かつストキャスティクスが50を超えている場合。強い下降モメンタムを示します。     中立 (グレー): 状況が混在している、またはモメンタムが弱い場合(ストキャスティクスが50未満)。 利点:     チャートの乱雑さを解消し、複数のインジケーターを切り替える必要がなくなります。     確率の高い取引機会を一目で特定
一目で分析を強化! このインジケーターは、価格が最近反発または突破した重要なレベルを自動的に描画し、手動でラインを引くことなくサポートとレジスタンスのゾーンを表示します。チャートに適用するだけで、各期間の過去の高値・安値ラインが表示されます。 各ラインの意味 Previous Month High ‣ 前月高値:前の月の期間内で記録された最高価格。 Previous Month Low ‣ 前月安値:前の月の期間内で記録された最安価格。 Previous Week High ‣ 前週高値:前の週の期間内で記録された最高価格。 Previous Week Low ‣ 前週安値:前の週の期間内で記録された最安価格。 Previous Day High ‣ 前日高値:直前の取引日の最高価格。 Previous Day Low ‣ 前日安値:直前の取引日の最安価格。 なぜ使うのか? グラフを開いた瞬間に 反発 と 突破 を検出。 実績あるゾーンで 利確 と 損切り を設定。 SMC や ICT 戦略に必須、市場構造をベースにエントリーと決済を最適化。 スキャルピング 、 スイング
Trade Summary is a professional on-chart dashboard for MetaTrader 4 & 5 that provides a clear, real-time overview of your open trades. Monitor floating profit/loss, entry price, lot size, account risk, distance to stop loss, stop loss and take profit values, balance, and equity—all from one compact panel. Designed for traders who value speed and effective risk management, Trade Summary eliminates manual calculations and keeps essential information visible at a glance. It also includes a privacy
High frequency arbitrage brushing orders! Attention! Attention! Attention!: Low cost and low point platforms are necessary for brushing orders. Please review first and then simulate trading. Do not directly conduct actual trading and test suitable trading varieties A set of arbitrage brushing strategies developed after years of research and development Suggested variety of gold
TradeForge Pass Prop Firm – AI搭載のProp Firmチャレンジ対応EA TradeForge Pass Prop Firm は、 Prop Firmの評価ステージ合格 と資金提供アカウントの運用に特化した高性能MT5 EAです。 AI技術 と高度なリスク管理を融合し、正確なトレード管理を実現します。 AIエンジン搭載 過去のProp Firmデータとリアルタイム市場を学習したAIによって: プライスアクションとボラティリティを分析 市場変化に柔軟に対応 多層ロジックで最適なエントリーとイグジットを判断 重要ニュース回避によるリスク低減 AIが スマートなトレード選択 を可能にし、合格率を高めます。 Prop Firm 規約対応設計 FTMO、MyForexFunds、True Forex Funds等の規約に対応: 1日最大ドローダウン制御 総ドローダウン監視 ソフト/ハードストップ条件設定 リスク%ベースの固定または可変ロットサイズ マーチンゲールやグリッドなし — 純粋なロジック取引 目標とリスク上限の設定後、EAが安全に運用を実施
Litoral Trading の LT Renko は、Renko チャート生成機能と高度なビジュアル取引パネルを統合した、完全なプロフェッショナル向けソリューションです。時間足チャート(従来のローソク足)に含まれるノイズを排除したいトレーダー向けに設計されており、価格の動きだけに基づく正確性と、高性能なプロ仕様の取引パネルによる高速執行を組み合わせています。 2つの統合された動作モードにより、LT Renko は最大限の精度でカスタムチャートを生成し、その生成されたチャート上で、クリック執行、キーボードショートカット(ホットキー)、注文の視覚的な配置、リスク管理を直接行うことができます。 実際の動作 Renko ジェネレーターモード(オフライン): ベース銘柄の M1 バー履歴、または実際のティックデータをカスタムオフラインチャートに変換します。チャートはシステムによって自動的に作成・表示され、ティックごとのリアルタイム更 新を維持しながら、形成中のボックス、ヒゲ、そして任意のギャップ補完(ゴーストボックス / ghost boxes)を表示します。 取引モード(トレーデ
MetaTrader 5 用 SuperTrend AI Clustering エキスパートアドバイザー SuperTrend AI Clustering は、変化するマーケット環境に合わせて自動調整されるトレンドフォロー型の MetaTrader 5 用エキスパートアドバイザーです。固定の SuperTrend 乗数を 1 つだけ使うのではなく、複数の係数を同時に評価し、それぞれの直近の成績を測定し、K-Means クラスタリングを適用したうえで、現在もっともパフォーマンスが良い係数グループを選択します。これにより、ボラティリティの regime や相場構造の変化に対応できるダイナミックな SuperTrend モデルが構築され、頻繁な手動再設定なしで環境に順応することができます。 本システムは、適応性・体系的なリスク管理・チャート上の透明な情報表示を重視しながら、トレンドフォローを自動化したいトレーダー向けに設計されています。FX 通貨ペア、貴金属、株価指数、暗号資産、商品など、MetaTrader 5 上で利用可能なシンボルに対応しています。エキスパートアドバイザーは複数の時間足
このソフトウェア ツールは、カスタマイズ可能な 5 色の選択で水平トレンド ラインと長方形を作成するプロセスを合理化するように設計されています。 MT5 で正確な水平トレンド ラインを描くのは難しい場合がありますが、このインジケーターを使用すると、好みに合った色で簡単に作成できます。 さらに、私たちのツールは、あなたが引いた水平線に関連する価格レベルを明確に表示します。 私たちは皆様からのフィードバックを大切にしており、このツールがお客様の取引ニーズにとって貴重な資産となることを願っています。 ぜひご意見をお聞かせください。 ........................................................
ToTheMoon MT5
Daniel Moraes Da Silva
5 (6)
ONE OF THE FEW ROBOTS WITH A SIGNAL HISTORY OF MORE THAN 3 YEARS AND AMONG THE TOP 10.   LINK TO MY ROBOTS AND SIGNAL PRESETS: In my profile there is a link to download the PRESETS that I use in my SIGNALS, you can download and Backtest for free, there are explanations in the my WebSite. https://www.mql5.com/en/users/tec_daniel   LINK TO OTHER ROBOT VERSIONS: MT4:  https://www.mql5.com/en/market/product/97963 MT5:  https://www.mql5.com/en/market/product/97962   SOME EXAMPLES OF SIGNALS ON “mql5.
Gold Liquidity EA – Gold EA for XAUUSD Scalping on MT5 Gold Liquidity EA is a high-performance Gold EA and XAUUSD EA developed for precision trading on the MetaTrader 5 platform. This advanced Scalping EA is specifically designed for traders who want a reliable Gold Scalper focused on the 1-minute timeframe. As a powerful MT5 EA, Gold Liquidity EA combines liquidity-based trading concepts with fast execution to capture short-term movements in the gold market. This Gold EA is optimized for XAUUSD
SuperAgent v7.0 Diamond Pro - 定量的スコアリングとダイナミックリスク 説明: SuperAgent v7.0 Diamond Proは、高度なPython金融アルゴリズムをMT5用に忠実に移植したプロフェッショナルなエキスパートアドバイザー(EA)です。 定量的スコアリングエンジン と ダイナミックリスク管理 を組み合わせ、機関投資家レベルのポートフォリオ管理を実現します。 主な特徴: 多層決定エンジン:   「低遅延シグナル処理」「トレンドバイアス確認」「モメンタムスコアリング」の3つの次元で市場を評価します。 Auto-Lot(ダイナミックリスク):   余剰証拠金に対するリスクの割合に基づいてロット数を自動計算し、「資金不足」エラーを防止します。 StopLevel Guard:   ブローカーの「ストップレベル」と「フリーズレベル」をリアルタイムで監視。SLおよびTPを自動的に正規化し、ブローカーの制限を遵守します。 プロアクティブ・マージンチェック:   注文実行前に必要証拠金を計算し、残高不足の場合はログを汚さずにトレードをスキップします。
このプロダクトを購入した人は以下も購入しています
ARICoin is a powerful trading companion designed to generate high-probability entry signals with dynamic TP/SL/DP levels based on volatility. Built-in performance tracking shows win/loss stats, PP1/PP2 hits, and success rates all updated live. Key Features: Buy/Sell signals with adaptive volatility bands Real-time TP/SL/DP levels based on ATR Built-in MA Filter with optional ATR/StdDev volatility Performance stats panel (Success, Profit/Loss, PP1/PP2) Alerts via popup, sound, push, or email Cust
PrimeScalping is a powerful trading companion designed to generate high-probability entry signals with dynamic TP/SL/DP levels based on volatility. Built-in performance tracking shows win/loss stats, PP1/PP2 hits, and success rates — all updated live. Key Features: Buy/Sell signals with adaptive volatility bands Real-time TP/SL/DP levels based on ATR Built-in MA Filter with optional ATR/StdDev volatility Performance stats panel (Success, Profit/Loss, PP1/PP2) Alerts via popup, sound, push, or e
note: this indicator is for METATRADER4, if you want the version for METATRADER5 this is the link:  https://www.mql5.com/it/market/product/108106 TRENDMAESTRO ver 2.5 TRENDMAESTRO recognizes a new TREND from the start, he never makes mistakes. The certainty of identifying a new TREND is priceless. DESCRIPTION TRENDMAESTRO identifies a new TREND in the bud, this indicator examines the volatility, volumes and momentum to identify the moment in which there is an explosion of one or more of these da
SmartScalping is a powerful trading companion designed to generate high-probability entry signals with dynamic TP/SL/DP levels based on volatility. Built-in performance tracking shows win/loss stats, PP1/PP2 hits, and success rates — all updated live. Key Features: Buy/Sell signals with adaptive volatility bands Real-time TP/SL/DP levels based on ATR Built-in MA Filter with optional ATR/StdDev volatility Performance stats panel (Success, Profit/Loss, PP1/PP2) Alerts via popup, sound, push, or e
ScalpPoint is a powerful trading companion designed to generate high-probability entry signals with dynamic TP/SL/DP levels based on volatility. Built-in performance tracking shows win/loss stats, PP1/PP2 hits, and success rates — all updated live. Key Features: Buy/Sell signals with adaptive volatility bands Real-time TP/SL/DP levels based on ATR Built-in MA Filter with optional ATR/StdDev volatility Performance stats panel (Success, Profit/Loss, PP1/PP2) Alerts via popup, sound, push, or emai
MasterTrend Indicator for MT5 A powerful trend-following and signal-evaluation tool MasterTrend   is a custom MT5 indicator that combines Moving Averages and ATR-based risk/reward logic to generate clear buy/sell signals. It visualizes dynamic SL/TP levels, evaluates past trade outcomes, and displays win/loss statistics in a clean on-chart panel. Key features include: Buy/Sell signals based on MA crossovers ATR-based SL/TP1/TP2/TP3 levels with visual lines and labels Signal outcome tracking wit
ARIPoint
Temirlan Kdyrkhan
1 (1)
ARIPoint is a powerful trading companion designed to generate high-probability entry signals with dynamic TP/SL/DP levels based on volatility. Built-in performance tracking shows win/loss stats, PP1/PP2 hits, and success rates all updated live. Key Features: Buy/Sell signals with adaptive volatility bands Real-time TP/SL/DP levels based on ATR Built-in MA Filter with optional ATR/StdDev volatility Performance stats panel (Success, Profit/Loss, PP1/PP2) Alerts via popup, sound, push, or email Cu
MasterTrend Indicator for MT5 A powerful trend-following and signal-evaluation tool MasterTrend   is a custom MT5 indicator that combines Moving Averages and ATR-based risk/reward logic to generate clear buy/sell signals. It visualizes dynamic SL/TP levels, evaluates past trade outcomes, and displays win/loss statistics in a clean on-chart panel. Key features include: Buy/Sell signals based on MA crossovers ATR-based SL/TP1/TP2/TP3 levels with visual lines and labels Signal outcome tracking wit
AriX
Temirlan Kdyrkhan
1 (4)
AriX Indicator for MT5 A powerful trend-following and signal-evaluation tool AriX is a custom MT5 indicator that combines Moving Averages and ATR-based risk/reward logic to generate clear buy/sell signals. It visualizes dynamic SL/TP levels, evaluates past trade outcomes, and displays win/loss statistics in a clean on-chart panel. Key features include: Buy/Sell signals based on MA crossovers ATR-based SL/TP1/TP2/TP3 levels with visual lines and labels Signal outcome tracking with real-time stat
相場が本当は何をしているのかを見抜く。   3つの市場フェーズ(収縮・拡張・トレンド)を目の前でライブに捉え、トレンド・フェーズの初期段階でより優れたエントリーを取りましょう   。      当て推量はもう終わり。機関投資家やスマートマネーのように相場を読み始めましょう。   Apex Market Structure Pro(MT5版)は、ノイズを取り除き、あらゆるローソク足の下にある真の構造を見せる高精度のスマートマネー分析ツ   ールです。流動性、構造転換、蓄積ゾーン、トレンドバイアスを、ひとつのクリーンでプロフェッショナルなオーバーレイに集約します。遅行   指標に見切りをつけ、明晰さをもってトレードする準備のできた本気のトレーダーのために作られました。   重要:本インジケーターは Heikin Ashi(平均足)ローソク足での動作を前提に設計されています。使用前にチャートを Heikin Ashi   に設定し、その真価を解き放ってください。分析のすべては Heikin Ashi の価格の流れを軸に構築されています。Apex Market Structure Pr
Euro Escalper — Puro no Kikan Toshi Sukyarupingu Injikeeta Euro Escalper wa, subete no entori de kikan toshi reberu no seido wo motomeru toreedaa no tame ni sekkei sareta kooseinou torihiki injikeeta desu. Gousei Shisuu (Deriv), Forex, oyobi MetaTrader 5 de riyou kanou na subete no shisan de kinoushimasu. Fibonacci beisu no ryuudousei zoon, naizou SuperTrend enjin, oyobi riaru taimu no purofesshonaru dasshubooddo wo kumiawasemasu. Shuyo na Riten Sai Egaki Nashi: Shingou yajirushi wa rousoku ashi
CGE Trading Suite
Carl Gustav Johan Ekstrom
5 (2)
Institutional-Grade Analytics for MT5 The full analytical edge of a professional trading desk, built into your MT5 chart. CGE Trading Suite is an indicator system of 20 integrated modules covering market structure, timing, momentum, volume and capital flow, combined into a single chart-based workspace. Why CGE Trading Suite? The suite empowers traders with structure, confidence, and consistent performance across all markets and time frames. Hover over any signal or tool on the chart to instant
MERAVITH SCANNERは、MetaTrader 5用のプロフェッショナルな金融市場インジケーターで、複数の分析ツールを一つの統合システムにまとめています。独自の出来高加重平均価格(VWAP)手法を使用してすべての計算を自動で行い、主観的な解釈を完全に排除します。 このインジケーターは、すべての資産クラス(FX、株式、指数、商品、暗号通貨)およびM1から月足までのすべての時間軸で動作します。基本原理は「価格は出来高に従う」というものです。MERAVITHは機関投資家の出来高が集中するポイントを特定し、その集中から数学的に正確な価格レベルを導き出します。予測や投機は行わず、計算のみを行います。 MERAVITH SCANNERを使用すると、28の主要FX通貨ペアをすべての時間軸でわずか2~3分でスキャンできます。また、任意の市場をスキャンすることも可能です。例えば、約100銘柄の株式を約10分でスキャンできます。 インジケーターは、消耗レベル、均衡線、偏差、統計レベル、およびターゲット予測を算出します。 チャート要素 Origin Point :すべての計算が始まる起点です。イン
The Expert Advisor and the video are attached in the Discussion tab . The robot applies only one order and strictly follows the signals to evaluate the indicator efficiency. Pan PrizMA CD Phase is an option based on the Pan PrizMA indicator. Details (in Russian). Averaging by a quadric-quartic polynomial increases the smoothness of lines, adds momentum and rhythm. Extrapolation by the sinusoid function near a constant allows adjusting the delay or lead of signals. The value of the phase - wave s
Классификатор силы тренда. Показания на истории не меняет. Изменяется классификация только незакрытого бара. По идее подобен полной системе ASCTrend, сигнальный модуль которой, точнее его аппроксимация в несколько "урезанном" виде, есть в свободном доступе, а также в терминале как сигнальный индикатор SilverTrend . Точной копией системы ASCTrend не является. Работает на всех инструментах и всех временных диапазонах. Индикатор использует несколько некоррелируемых между собой алгоритмов для класси
FFx Universal Strength Meter PRO is more than a basic strength meter. Instead of limiting the calculation to price, it can be based on any of the 19 integrated strength modes + 9 timeframes. With the FFx USM, you are able to define any period for any combination of timeframes. For example, you can set the dashboard for the last 10 candles for M15-H1-H4… Full flexibility! Very easy to interpret... It gives a great idea about which currency is weak and which is strong, so you can find the best pai
The FFx Universal MTF alerter shows on a single chart all the timeframes (M1 to Monthly) with their own status for the chosen indicator. 9 indicators mode (MACD-RSI-Stochastic-MA-ADX-Ichimoku-Candles-CCI-PSAR). Each can be applied multiple times on the same chart with different settings. Very easy to interpret. Confirm your BUY entries when most of the timeframes are showing green color. And confirm your SELL entries when most of the timeframes are showing red color. 2 Alert Options : input to s
The FFx Watcher PRO is a dashboard displaying on a single chart the current direction of up to 15 standard indicators and up to 21 timeframes. It has 2 different modes: Watcher mode: Multi Indicators User is able to select up to 15 indicators to be displayed User is able to select up to 21 timeframes to be displayed Watcher mode: Multi Pairs User is able to select any number of pairs/symbols User is able to select up to 21 timeframes to be displayed This mode uses one of the standard indicators
FFx Patterns Alerter gives trade suggestions with Entry, Target 1, Target 2 and StopLoss .... for any of the selected patterns (PinBar, Engulfing, InsideBar, OutsideBar) Below are the different options available: Multiple instances can be applied on the same chart to monitor different patterns Entry suggestion - pips to be added over the break for the entry 3 different options to calculate the SL - by pips, by ATR multiplier or at the pattern High/Low 3 different options to calculate the 2 TPs -
MetaTrader 4 version available here : https://www.mql5.com/en/market/product/24881 FFx Basket Scanner is a global tool scanning all pairs and all timeframes over up to five indicators among the 16 available. You will clearly see which currencies to avoid trading and which ones to focus on. Once a currency goes into an extreme zone (e.g. 20/80%), you can trade the whole basket with great confidence. Another way to use it is to look at two currencies (weak vs strong) to find the best single pairs
MetaTrader 4 version available here: https://www.mql5.com/en/market/product/25793 FFx Pivot SR Suite PRO is a complete suite for support and resistance levels. Support and Resistance are the most used levels in all kinds of trading. Can be used to find reversal trend, to set targets and stop, etc. The indicator is fully flexible directly from the chart 4 periods to choose for the calculation: 4Hours, Daily, Weekly and Monthly 4 formulas to choose for the calculation: Classic, Camarilla, Fibonac
ClassicSBA
Umri Azkia Zulkarnaen
this indicator very simple and easy if you understand and agree with setup and rule basic teknical sba you can cek in link : please cek my youtube channel for detail chanel : an for detail info  contact me  basicly setup buy (long) for this indicator is Magenta- blue and green candle or magenta - green  and green candlestik and for setup sell (short) is Black - yellow - and red candle or black - red  and red candlestik
Indicador en base a la pendiente de la linea de precio, dibuja una línea de color cuando sube a base de los precios que previamente has sido procesados o linealizados, y cuando baja la pendiente la linea linealizada toma otro color. En este caso se a considerado 6 lineas de diferentes procesos desde pendientes largas hacia las cortas, observándose que cuando coincidan las pendientes se produce un máximo o mínimo, lo que a simple vista nos permitirá hacer una COMPRA O VENTA.
A scalping indicator based on mathematical patterns, which on average gives signals with relatively small SL, and also occasionally helps to catch big moves in the markets (more information in the video) This indicator has three main types of notifications: The first type warns of a possible/upcoming signal on the next bar The second type indicates the presence of a ready signal to enter the market/open a position The third type is for SL and TP levels - you will be notified every time price re
Fibonacci Múltiple 12, utiliza la serie fibonacci plasmado en el indicador fibonacci, aumentadolo 12 veces según su secuencia. El indicador fibonacci normalmente muestra una vez, el presente indicador se mostrara 12 veces empezando el numero que le indique siguiendo la secuencia. Se puede utilizar para ver la tendencia en periodos cortos y largos, de minutos a meses, solo aumentado el numero MULTIPLICA.
Recommended TimeFrame >= H1. 100% Non Repainted at any moment.  Use it carefully, only with Trend Direction. Trading Usage: 2 Variants: as Range System or as BreakOut System (Both Only With Trend Direction)::: (Always use StopLoss for minimise Risk); [1] as Range System: (Recommended) in UP TREND:  - BUY in Blue Line , then if price goes down by 50 points (on H1) open Second BUY.   Close in any Profit you wish: TrailingStop(45 points) or Close when Price touches upper Gold Line. in DOWN TREND
En base a cálculos matemáticos de determino una linea Horizontal que cruza a todas las señales de trading, mostrando los máximos y mínimos. La linea horizontal parte en dos las subidas y bajadas de las señales de trading, de tan manera que es fácil identificar los máximos y mínimos, y es inteligente por que es sensible a las subidas y bajadas, afín de no quedarse en un solo lado por siempre, trabaja excelentemente con otros indicadores suavizadores ya que les garantiza que en un intervalo de tie
this indicator is a Spike detector indicator, it is specially designed to trade Boom 1000, Boom 500, Crash 1000 and Crash 500 We recommend using it on Deriv Boom and Crash indices only Its setting is intuitive, familiar, easy to use it has notification functions; audible notifications and push notifications. this tool is simple to use, easy to handle This update is based on different strategies for spikes
Limitless MT5 is a universal indicator suitable for every beginner and experienced trader. works on all currency pairs, cryptocurrencies, raw stocks Limitless MT5 - already configured and does not require additional configuration And now the main thing Why Limitless MT5? 1 complete lack of redrawing 2 two years of testing by the best specialists in trading 3 the accuracy of correct signals exceeds 80% 4 performed well in trading during news releases Trading rules 1 buy signal - the ap
Indicador en MQL5, recibe la información del precio SUAVIZADO, lo procesa anulando los picos inteligentemente, y el resultado lo envía al desarrollo de la escalera que iniciara y subirá o bajara según el peldaño o INTERVALO ingresado Ingreso PERIODO = 50 (variar segun uso) Ingreso MULTIPLICA AL PERIODO = 1 (variar segun uso) Segun la configuración la escalera puede pegarse o separarse de los precios,, Se aplica toda la linea de tiempo, y a todas las divisas, etc.  
作者のその他のプロダクト
FAVERO RETURN SYSTEM Reversal Probability System The system was developed to identify market regions where price shows signs of potential exhaustion , combining overbought and oversold conditions with support and resistance levels from higher timeframes . The objective is not to claim that a reversal will necessarily occur, but rather to identify areas where the probability of a change in market direction may be increasing . How It Works The indicator primarily analyzes the following timefra
Indicator Description Opportunity Identification Indicator — Smart Money This indicator was developed to assist in identifying moments when prices may be reaching areas of greater interest , seeking possible signals in market behavior associated with the concept of “smart money” (Smart Money) , widely discussed in financial literature and market studies. The proposal is to create a bridge between technical analysis and fundamental analysis . The indicator uses technical analysis and price behavi
CONFLUENCE AND PROBABILITY INDICATOR Volume • Fibonacci • Pullback • Technical Analysis This indicator was developed with an approach focused on identifying areas of interest in the market , combining different concepts widely used in technical analysis and trading studies. Its purpose is to assist traders in interpreting price behavior through the confluence of information , allowing each user to integrate the indicator into their own analysis system and personal strategies. KEY CONCEPTS ANALYZ
Horizontal lines on the chart alternate between solid and dashed styles, representing areas of interest based on significant highs and lows from different timeframes, creating potential confluence between market structures. The indicator is designed to assist each participant in their own market studies, giving users the flexibility to combine the indicator with their personal trading system and analysis methods . The lines should not be used as standalone entry triggers . Instead, they are inte
Indicator Description This indicator was developed with the purpose of combining the structure of highs and lows from higher timeframes with confluences generated by different technical indicators . Through the use of multiple horizontal lines , the system highlights relevant market regions that can be used for study, monitoring, and analysis of price behavior . The lines are designed to assist in identifying: Market areas of interest; High and low structures from higher timeframes; Areas where
Indicator Description This indicator monitors overbought and oversold levels , combining technical indicator signals with financial volume analysis in the regions marked on the chart. The system was primarily developed to support Swing Trading and Position Trading , using the H1 timeframe as its main reference. It is designed to help traders analyze areas where price may show changes in behavior, continuation, or loss of momentum. The marked regions should be used as areas for study and monitori
フィルタ:
レビューなし
レビューに返信