Squeeze Momentum Clarity
- Утилиты
-
Hoai Nam Trinh
 💎 НАЧНИТЕ ЗДЕСЬ - КАРТА ИНСТРУМЕНТОВ GOLD ALGO LAB
Не уверены, какой инструмент MT5 лучше всего подходит для вашего процесса торговли XAUUSD? - Версия: 1.20
- Обновлено: 22 сентября 2026
| After downloading, message me via MQL5 inbox to receive your FREE User Kit - setup guide, practical checklist, and workflow resources built specifically for XAUUSD traders. |
Gold can look ready when it is not.
That is one of the harder lessons on XAUUSD. Price starts to move fast, the histogram expands, the chart feels like a breakout is forming - and then it reverses, or chops sideways for the next twenty candles. The move looked real. The compression had not actually released.
After spending years watching this pattern repeat on gold, I built Squeeze Momentum Clarity to solve one specific problem: knowing whether the market is still coiled, or whether the pressure has genuinely started to come out.
It does not try to predict direction. It does not give buy or sell arrows. It gives you a cleaner read of what the market is actually doing right now - compressed, releasing, or losing momentum - before you make a decision you can not undo.
What This Indicator Does
Squeeze Momentum Clarity Free combines two ideas that work better together than either does alone.
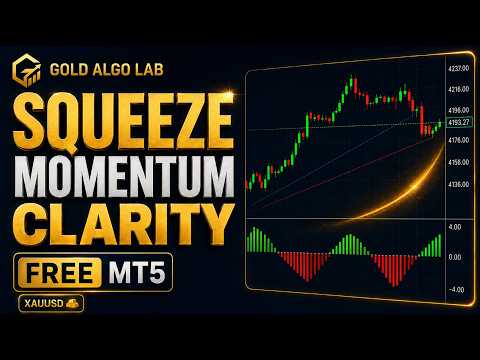
The first is squeeze detection using Bollinger Bands and Keltner Channels. When the Bollinger Band sits inside the Keltner Channel, the market is in a compression phase - price volatility has contracted and the range is tight. When the Bollinger Band expands back outside, that squeeze is releasing. The dot row at the zero line shows this clearly: dark dots for squeeze on, lighter dots for squeeze off, blue dots for neutral.
The second is a linear-regression momentum histogram. Most momentum tools show you whether price went up or down. This one shows you the shape of that movement - whether momentum is rising, fading, accelerating or weakening. A green bar does not automatically mean enter. A green bar that is getting shorter after a run means momentum is fading, and the smart move might be to wait.
Together, these two reads give you context that a raw price chart does not show you.
The Four Histogram States
Bright green - Bullish and still building. Momentum is expanding to the upside.
Dark green - Bullish but fading. The move may be running out of energy.
Bright red - Bearish and accelerating. Downside pressure is increasing.
Dark red - Bearish but weakening. Selling momentum is starting to lose force.
Reading the color shift - not just the color - is where the edge comes from.
The Panel
A small information panel sits on the chart and gives you a three-line read at a glance:
Squeeze: ON/OFF/Neutral Momentum: Bullish/Bearish/Neutral State: Compression/Release/Active/Neutral
This matters most when the histogram says one thing and the squeeze says another. Bullish momentum inside a compression phase is not the same situation as bullish momentum after a fresh squeeze release. The panel keeps that distinction visible without you having to reconstruct it mentally every time you look at the chart.
The panel updates on closed-bar data only, which means it does not flicker mid-candle on fast-moving charts.
Where This Works Best
XAUUSD M5 and M15 are the primary use cases. Gold moves fast, liquidity sweeps are common, and false breakouts happen regularly. Understanding whether a move is backed by a genuine squeeze release - or whether price is just poking around inside a range - changes how you think about an entry.
The indicator also works on forex pairs, indices and any other symbols your broker supports. The BB and KC math is standard and the logic transfers cleanly across instruments.
Version 1.2 - What Changed
The core calculation was rebuilt with incremental OnCalculate logic. On active charts, especially M1 and M5, the previous full-recalc approach on every tick was unnecessary processing. Version 1.2 recalculates only what needs to be updated, which keeps the indicator lean on live charts.
Internal array handling was cleaned up and the lookback window calculation was corrected for better stability when BB and KC settings are adjusted. The panel now uses closed-bar safety mode and a dirty-flag update system to prevent mid-bar flicker.
Hidden Signal Buffers for EA and iCustom Users
Three additional buffers are included and accessible through EA or iCustom workflows:
Buffer 8 - Squeeze State (0 = None, 1 = On, 2 = Off) Buffer 9 - Momentum Class (1 = Bullish Rising, 2 = Bullish Fading, -1 = Bearish Accelerating, -2 = Bearish Fading) Buffer 10 - Fresh Release Signal (1 = first bar of squeeze release, else 0)
These are read-only data outputs. The indicator does not open, close or manage any trades.
Inputs
BB Length - Bollinger Band lookback period. Default 20.
BB Multiplier - Standard deviation width. Default 2.0.
KC Length - Keltner Channel lookback period. Default 20.
KC Multiplier - Range multiplier for Keltner Channel. Default 1.5.
Use True Range - Controls whether TR or High-Low range is used for KC. Default true.
Show Panel - Enable or disable the information panel. Default true.
Compact Mode - Reduces panel height if you prefer a smaller footprint. Default false.
Closed Bar Mode - Panel updates on bar close only. Default true.
Instance ID - Unique identifier for running multiple copies on the same chart.
What This Tool Is Not
This is not a signal system. It does not tell you when to enter or exit.
It does not fire buy or sell arrows. It does not use Martingale, Grid or any position-sizing logic. It does not guarantee outcomes of any kind.
What it does is give you a better picture of market structure - specifically the compression and momentum behavior that often precedes meaningful moves. How you act on that is entirely your decision.
For a full walkthrough of how to read squeeze and momentum context on gold charts: https://www.mql5.com/en/blogs/post/769009
Important Notes
Squeeze behavior, momentum coloring and panel readings are based on the BB/KC parameters you set. Different settings produce different sensitivity. Test on your preferred timeframe and instrument before drawing conclusions.
Broker spread, execution quality, symbol specification and chart timeframe all affect how price behaves relative to what this indicator shows. Results in demo and live environments can differ.
Not sure where this tool fits in your trading process?
Each Gold Algo Lab tool is built to solve one specific part of the trading workflow. The Gold Algo Lab Tool Map shows how our MT5 tools connect across 6 practical stages for XAUUSD traders: market context, setup selection, risk planning, trade execution, position management and account protection.
→ Gold Algo Lab Tool Map: Where to Actually Start With MT5 Tools for XAUUSD
https://www.mql5.com/en/blogs/post/771930
You do not need every tool. Start with the stage where your process breaks down most often, then build your workflow one layer at a time.
Risk Disclaimer
Trading financial markets involves significant risk of loss. Squeeze Momentum Clarity Free provides visual and technical information only. It is not financial advice and should not be treated as a standalone trading strategy.
Test this indicator on a demo account first. Make sure you understand how squeeze and momentum behavior works before applying it in a live trading environment. Never risk capital you cannot afford to lose.
Gold Algo Lab builds practical, risk-first MT5 tools for serious XAUUSD traders, shaped by 8 years of developing and trading real systems to help traders identify clearer setups, manage risk with greater confidence and execute with more discipline.