Intra Candle Structure
- Индикаторы
- Версия: 1.15
- Обновлено: 24 апреля 2026
Intra Candle Structure helps you see how price is developing inside a higher-timeframe candle while that candle is still forming.
Instead of waiting for a candle to close and then guessing what happened inside it, the indicator builds a rolling structure line from live intra-candle segments and projects that structure clearly on the chart. This makes it much easier to read momentum shifts, pauses, continuation, and break behavior as they happen.
It is especially useful in fast and volatile markets, where the raw candle alone often hides important internal movement. Even if your broker or platform setup does not provide second-based timeframes, the indicator still lets you observe lower-timeframe-style structure from the higher timeframe candle itself.
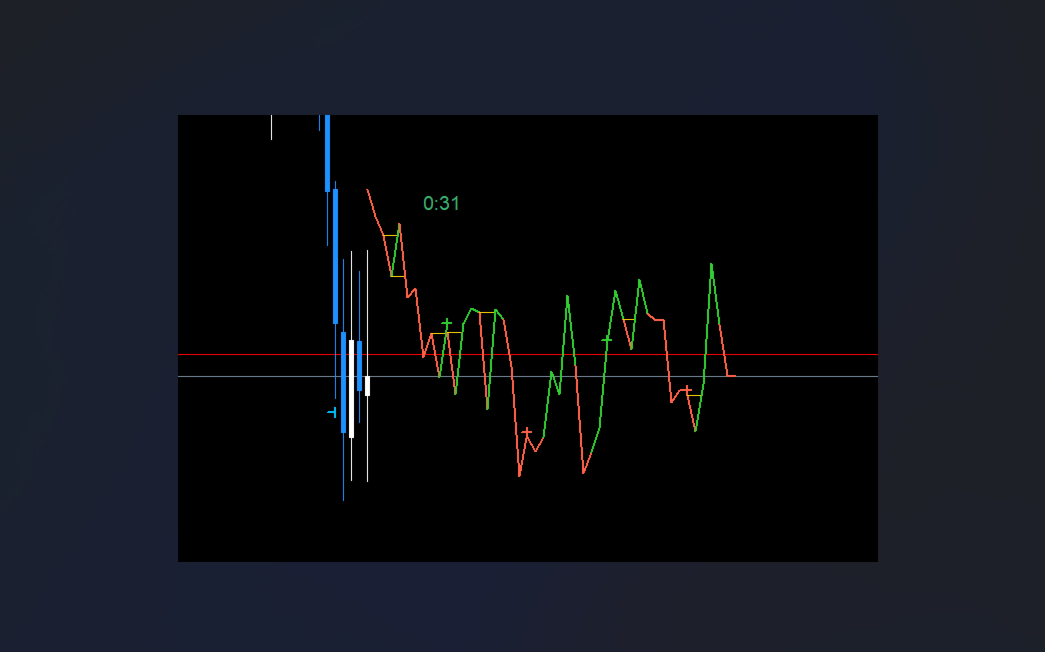
As shown in the screenshots, the structure line reveals the internal flow of price much more clearly than standard candles alone. Bullish and bearish sections are separated visually, marker points make turning areas easier to read, and retained recent candles let you compare the newest structure with what just happened before it.
This can help with:
- reading momentum inside a live candle
- spotting cleaner internal reversals and continuation
- understanding volatile moves without needing separate seconds charts
- making higher-timeframe candles feel more predictable and informative
Key features
- Builds a live intra-candle structure line from the selected reference timeframe
- Lets you view lower-timeframe-style movement from higher timeframe candles
- Useful when second charts are unavailable
- Optional marker display for candle closes or structure points
- Trend-colored structure sections for easier reading
- Optional horizontal break lines
- Historical structure retention with fade-out control
- Crash-safe cleanup and preserved recent history on reload