Prime Trend Pro MT5
- Индикаторы
-
Artem Koliada
 MQL4/MQL5 Developer 💻 | Turning trading strategies into profitable code. Expert Advisors (EA) & Custom Indicators for MT4/MT5. Let's automate your trading
 - Версия: 2.7
- Обновлено: 12 июля 2026
- Активации: 8
PrimeTrend Pro — это индикатор. Он не открывает, не изменяет и не закрывает сделки. Он отображает сигналы и предоставляет аналитику, но решения о торговле вы принимаете самостоятельно.
Движок
Основа — ATR-канал с односторонним "храповиком": в восходящем тренде уровень поддержки может только подниматься, в нисходящем — уровень сопротивления может только опускаться. Помимо классической логики, версия 2.7 добавляет:
- Гистерезис разворота. Разворот тренда требует, чтобы цена закрытия пробила уровень на дополнительную долю ATR (настраивается). Это устраняет разворот "на один пункт" при охоте за стопами, характерный для классических ATR-трейлинг индикаторов на боковом рынке.
- Двухбарное подтверждение (опционально). Первое пробитие уровня закрытием переводит индикатор в состояние "ожидание"; разворот подтверждается, только если следующий бар тоже закроется за уровнем. Одна тень с возвратом больше не разворачивает тренд.
- Адаптивный множитель (опционально). Ширина канала масштабируется в зависимости от волатильности (отношение быстрого ATR к медленному, с ограничением диапазона). При росте волатильности канал расширяется, игнорируя шум; при снижении — сужается для более быстрой реакции.
- Два режима якоря. Классический (от медианы) или Chandelier (от максимума/минимума за период) — второй агрессивнее подтягивает уровень в сильном тренде.
- Инициализация по данным. Начальное направление тренда определяется по цене, а не задаётся жёстко, поэтому историческая линия остаётся стабильной независимо от объёма загруженной истории.
Фильтры качества сигнала
Каждый фильтр независим и может быть включён или выключен. Сигнал, не прошедший фильтр, не скрывается, а рисуется другим цветом (серый пунктир — боковой рынок, золотой — рискованный/неподтверждённый), чтобы вы всегда видели, почему индикатор не даёт чистого BUY/SELL.
- Гейт коэффициента эффективности Кауфмана. Измеряет направленность недавнего движения цены. Пилообразное, неэффективное движение классифицируется как FLAT до того, как сгенерирует ложный сигнал. Реагирует быстрее, чем ADX.
- Гейт ADX. Классический фильтр бокового рынка, может работать вместе с ER-гейтом или вместо него.
- Подтверждение дельтой объёма. Индикатор рассчитывает реальную дельту тикового объёма (объём на бычьих барах против объёма на медвежьих за период). Тренд BUY без преобладания бычьего объёма — или SELL без медвежьего — помечается как рискованный.
- Базовый фильтр. Сигналы против долгосрочной EMA помечаются как контртрендовые.
- Фильтр объёма. Сигналы при аномально низком объёме помечаются как ненадёжные. Объём текущего бара масштабируется по времени, чтобы формирующийся бар не был несправедливо помечен.
Стабильный текущий бар (без мерцания сигнала)
Оконные фильтры "шумят", пока текущий бар ещё формируется, из-за чего сигнал обычно мерцает между BUY и WAIT внутри бара. PrimeTrend Pro фиксирует вердикты фильтров на последнем закрытом баре и блокирует классификацию текущего бара до его закрытия. Линия на закрытых барах никогда не перерисовывается; цвет текущего бара больше не мерцает.
Мультивалютная / мультитаймфреймовая панель
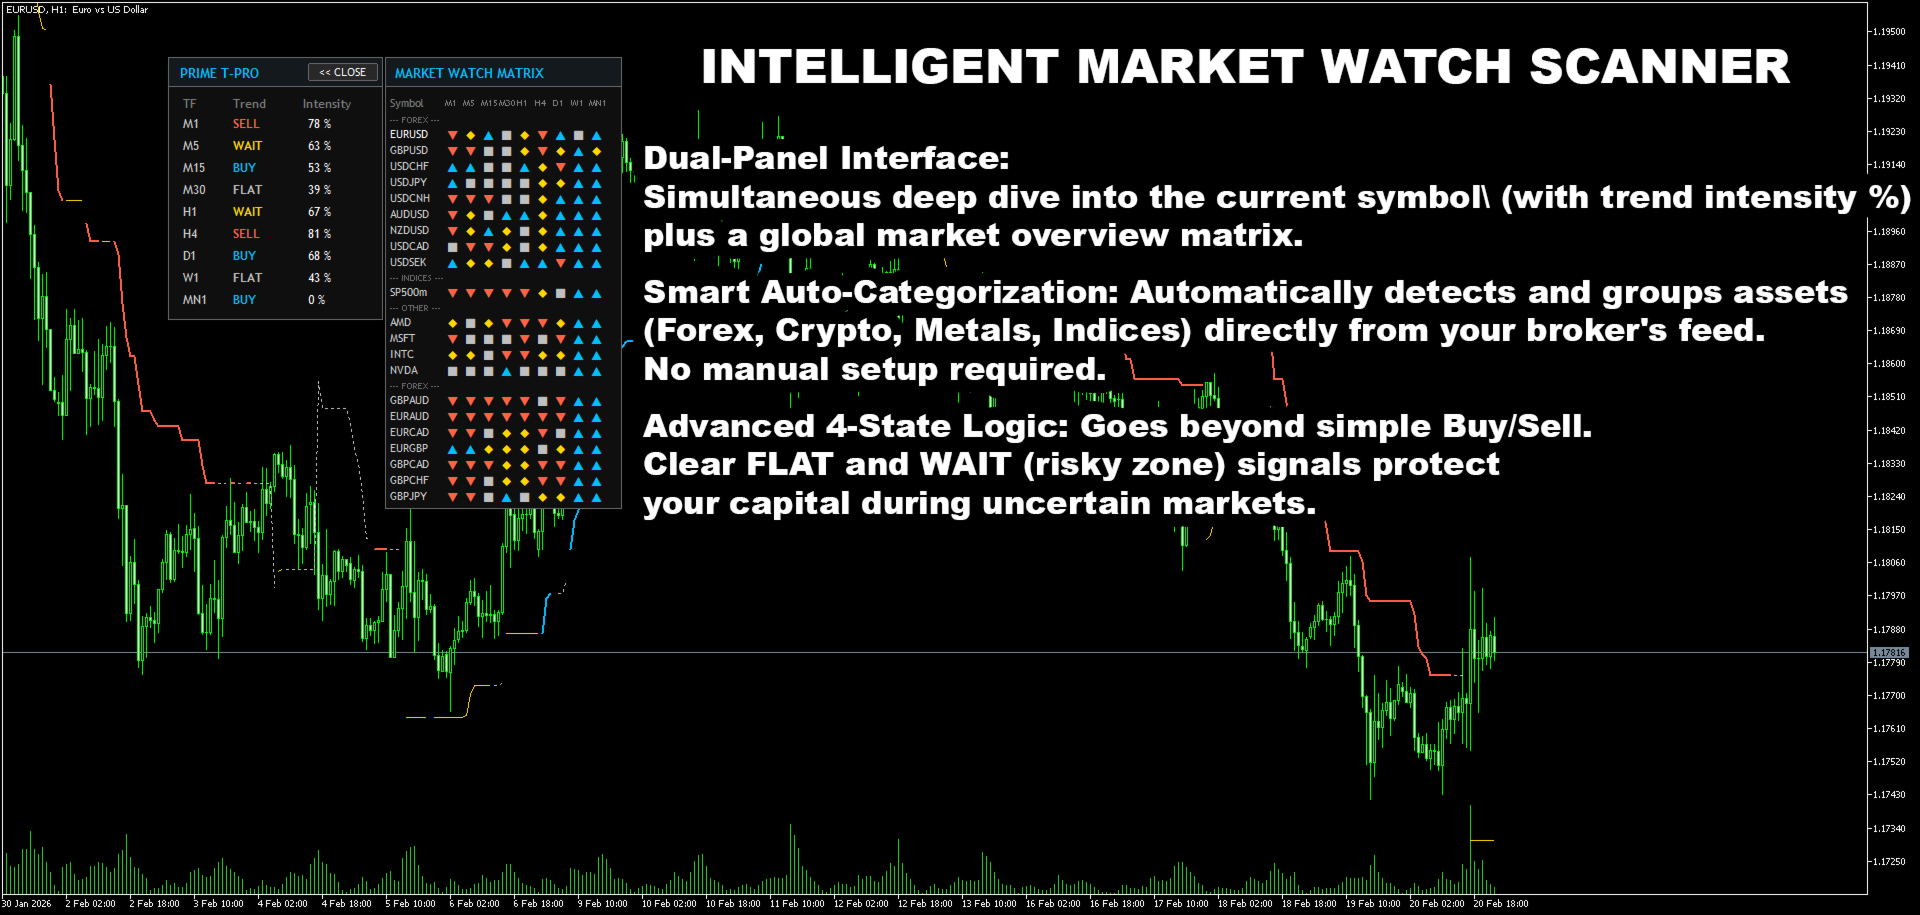
- Колонка TF для текущего символа: статус тренда и доминирование дельты объёма по всем таймфреймам от M1 до MN1.
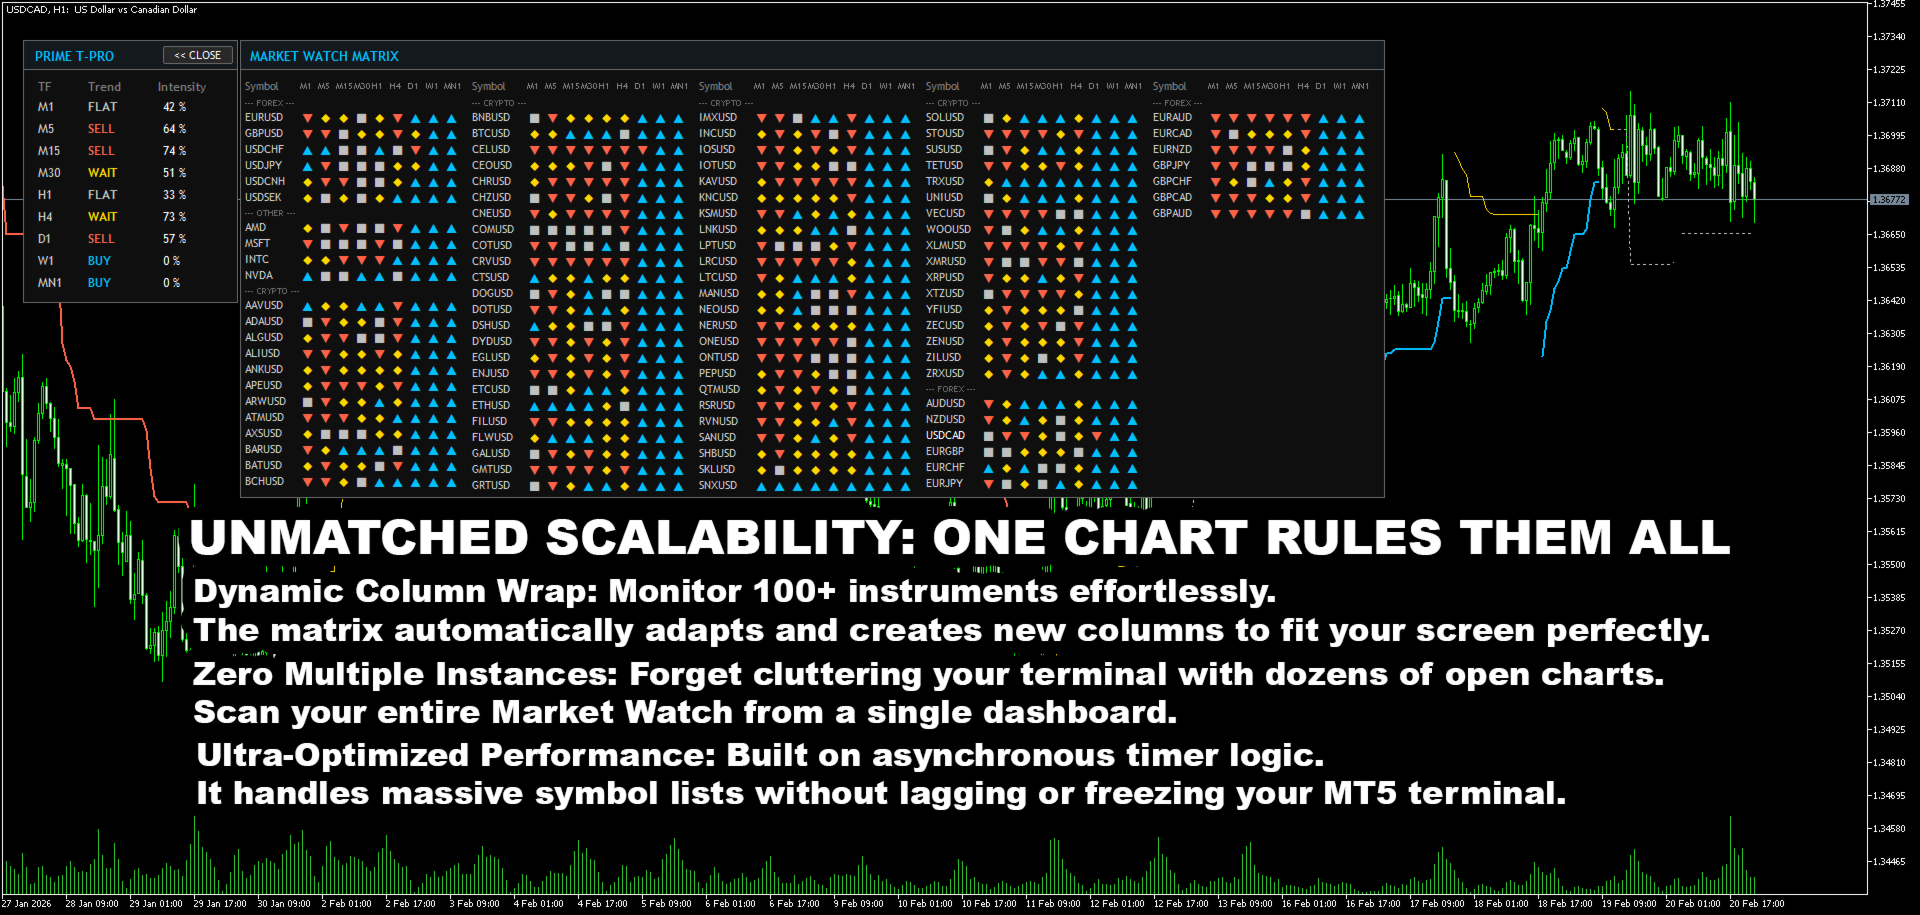
- Матрица обзора рынка: то же сканирование по 9 таймфреймам для каждого символа из Обзора рынка или пользовательского списка, с группировкой по категориям, сортировкой (категория, A–Z, сила быков, сила медведей), подсказками по ячейкам и мини-спарклайнами истории дельты. Клик по имени символа переключает график.
- Кокпит дельты объёма: живая гистограмма знаковой доминации дельты за последние 35 баров.
- Взвешенный индекс совпадения (конфлюэнс): одно число, суммирующее согласие по всем таймфреймам. Старшие ТФ имеют больший вес (голос D1 равен шести голосам M1), что устраняет иллюзию "совпадения", создаваемую тремя коррелированными минутными графиками. Доступен и обычный режим подсчёта.
- Режим подтверждённого бара: при алертах только по закрытию бара вся панель (матрица, конфлюэнс, кокпит) читает последний закрытый бар — ничего на панели не перерисовывается внутри бара.
- Панель перетаскивается, позиция сохраняется для каждого графика, режим "голограммы" (панель за свечами), адаптивная частота обновления.
Алерты
Экранные, push- и email-уведомления при смене тренда BUY/SELL для каждого символа и таймфрейма в матрице. В подтверждённом режиме алерты срабатывают строго по данным закрытого бара — сигнал, о котором пришло уведомление, не исчезнет.
Производительность
- Никаких обращений к индикатору в процессе отрисовки — все мультивалютные данные кэшируются и обновляются по таймеру с ограничением частоты.
- Хендлы для других символов создаются лениво, только при открытии матрицы.
- Расчёт скользящим окном для дельты объёма, скользящей средней объёма и коэффициента эффективности (O(1) на бар).
- Перерисовка по флагу изменений: панель перерисовывается только когда данные реально изменились.
- Параметр ограничения числа символов для предсказуемой нагрузки на терминал при большом Обзоре рынка.
Важные замечания
- В тестере стратегий панель показывает только тестируемый символ (ограничение тестера для мультивалютных индикаторов).
- Разворот тренда на текущем баре по замыслу следует за текущей ценой закрытия; используйте Confirm Bars = 1 или режим подтверждённого бара, если нужны развороты строго по закрытым барам.
- Индикатор не гарантирует торговых результатов. Прошлая эффективность любой сигнальной логики не гарантирует будущих результатов. Всегда тестируйте сначала на демо-счёте.
Справочник параметров
Основная стратегия
| Параметр | По умолчанию | Описание |
|---|---|---|
| ATR Period | 10 | Чувствительность тренда. Меньше = быстрее, больше разворотов. |
| ATR Multiplier | 3.0 | Ширина канала. Меньше = более тесные стопы, больше разворотов. |
| History Bars | 1000 | Количество баров для расчёта (0 = вся история). |
Двигатель v2.7
| Параметр | По умолчанию | Описание |
|---|---|---|
| Ratchet Anchor Mode | Classic | Classic (медиана) или Chandelier (по хай/лоу). |
| Flip Hysteresis (×ATR) | 0.15 | Дополнительная глубина пробоя для разворота. 0 = классическое поведение. |
| Confirm Bars | 0 | 1 = требуется второе подряд закрытие за уровнем. |
| Adaptive Multiplier | false | Масштабировать ширину канала по режиму волатильности. |
| Slow ATR Period | 100 | Опорный период для адаптивного множителя. |
| Min / Max Factor | 0.7 / 1.6 | Диапазон ограничения адаптивного масштабирования. |
| Stable Live Bar | true | Фиксировать вердикты фильтров текущего бара по закрытым данным (без мерцания). |
Умные фильтры
| Параметр | По умолчанию | Описание |
|---|---|---|
| Use ADX Filter | false | ADX ниже порога = FLAT (серый пунктир). |
| Use ER Gate | true | Коэффициент эффективности ниже уровня = FLAT. |
| ER Period / Level | 20 / 0.30 | Период и минимум ER. |
| Use Delta Confirm | true | Тренд против дельты объёма = рискованно (золотой). |
| Delta Min % | 50 | Требуемое преобладание на стороне тренда (50–100). |
| Use Baseline Filter | false | Сигналы против долгосрочной EMA = рискованно. |
| Use Volume Filter | false | Сигналы при низком объёме = рискованно. |
Как читать линию на графике
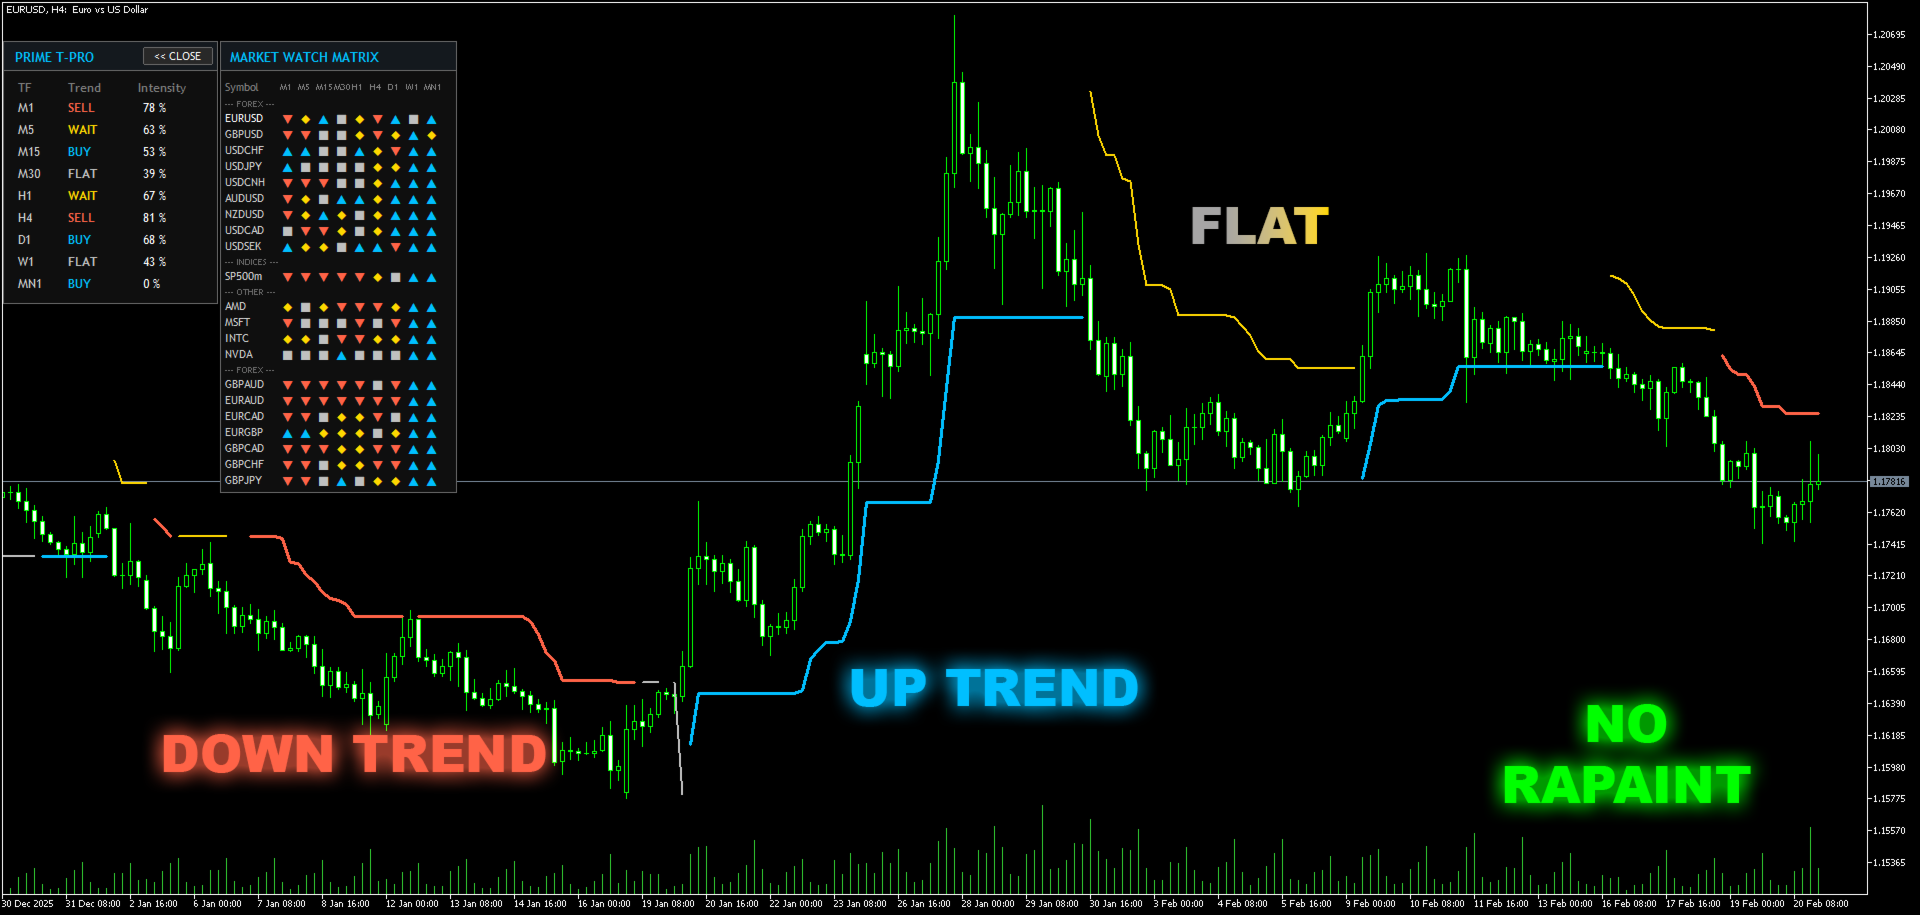
Индикатор рисует одну трейлинг-линию, цвет и стиль которой несут сигнал:
| Линия | Значение | Действие |
|---|---|---|
| Сплошная синяя | Подтверждённый тренд BUY, все включённые фильтры пройдены | Контекст для лонгов; линия — естественный ориентир трейлинг-стопа |
| Сплошная красная | Подтверждённый тренд SELL, все фильтры пройдены | Контекст для шортов |
| Пунктирная серая | FLAT — рынок в боковике (гейт ER или ADX) | Воздержаться от сделок; трейдеры на пробой могут следить за краями канала |
| Сплошная золотая | RISKY — тренд есть, но не прошёл фильтр подтверждения (дельта объёма против тренда, цена против базовой линии или низкий объём) | Считать неподтверждённым: пропустить или требовать дополнительное подтверждение |
Линия на закрытых барах никогда не перерисовывается. Тренд текущего бара может разворачиваться вместе с текущей ценой закрытия (это свойство любой логики на основе close), но при настройках по умолчанию его цветовая классификация зафиксирована до закрытия бара (Stable Live Bar).
Первая настройка — три профиля
Консервативный: оставить настройки по умолчанию, установить Confirm Bars = 1. Минимум сигналов и пилы, задержка в один бар на разворотах. Подходит для H1 и старше.
Сбалансированный (по умолчанию): гистерезис 0.15, ER-гейт включён, Delta confirm включён. Хорошая стартовая точка для M15–H4.
Быстрый: Flip Hysteresis = 0.05, ER Level = 0.20, Delta Confirm = off. Больше сигналов, больше шума. Только для опытных скальперов на ликвидных символах; ожидайте пилу в азиатскую сессию.
После выбора профиля поработайте с индикатором на демо-графике минимум неделю на вашем обычном таймфрейме, прежде чем менять что-либо ещё. Меняйте только один параметр за раз.
Панель
Главная панель (видна всегда при Show Panel = true):
- Колонка TF — статус тренда (BUY/SELL/FLAT/WAIT) и знаковая доминация дельты объёма для текущего символа по всем ТФ M1…MN1. "+ 63.1 %" означает, что быки держат 63% направленного тикового объёма в окне расчёта на этом ТФ.
- Кокпит дельты объёма — гистограмма доминации дельты за последние 35 баров таймфрейма графика. Синие столбцы — доминация быков, красные — медведей.
- Строка конфлюэнса — одно число, суммирующее согласие всех 9 таймфреймов. В взвешенном режиме (по умолчанию) старшие ТФ весят больше: голос D1 равен шести голосам M1. ≥60% суммарного веса на одной стороне = STRONG (цветное), меньше — WEAK (золотой) или MIXED (серый).
Панель можно перетащить в любое место; её позиция сохраняется для каждого графика. Режим Hologram Mode размещает панель за свечами, чтобы она не закрывала цену.
Матрица обзора рынка
Нажмите MATRIX >> для открытия. Каждая строка — символ, каждая колонка — таймфрейм: ▲ синий = BUY, ▼ красный = SELL, ■ серый = FLAT, ◆ золотой = RISKY, • тусклая — данных ещё нет. Тонкая линия под ячейкой — спарклайн истории дельты для этого символа/ТФ. Наведите на ячейку для подсказки с точным статусом и процентом дельты. Клик по имени символа переключает график на него (тот же таймфрейм). Кнопки сортировки в шапке: CAT (по классу актива), A–Z, Bull (сильнейший бычий конфлюэнс первым), Bear. Сортировка Bull/Bear обновляется в реальном времени по мере изменения рыночных данных.
Первое заполнение большой матрицы занимает несколько секунд, пока терминал загружает историю других символов — это нормально.
Режим подтверждённого бара
При Alert Only on Bar Close = true (по умолчанию) вся панель — ячейки матрицы, конфлюэнс, кокпит — читает последний закрытый бар каждого таймфрейма. Ничего на панели не меняется внутри бара, и каждый алерт соответствует состоянию, которое уже не отменится. Устанавливайте false только если вам явно нужны показания в реальном времени внутри бара и вы принимаете, что они могут отмениться.
Алерты
Включите Screen / Push / E-mail в блоке Alerts. Алерты срабатывают при смене тренда BUY↔SELL для каждого символа и таймфрейма в матрице, в формате:
PrimeTrend | EURUSD H4 | Trend: BUY
Для push-уведомлений укажите ваш MetaQuotes ID в Options → Notifications терминала. Для email настройте Options → Email. Первое сканирование после подключения индикатора никогда не даёт алерт (оно лишь запоминает начальное состояние) — вас не завалит 200 уведомлениями при запуске.
Рекомендуемые сценарии работы
Следование за трендом с MTF-фильтром: торгуйте только в направлении, где взвешенный конфлюэнс STRONG. Вход по вашему собственному триггеру (например, откат к линии) в этом направлении на рабочем ТФ; сама линия — ориентир трейлинг-стопа.
Скрининг: откройте матрицу, отсортируйте по Bull или Bear и проходите список сверху вниз — верхние символы там, где согласны больше таймфреймов. Проверяйте спарклайны: растущая доминация дельты рядом со свежей ▲ — самая чистая конфигурация.
Избегание пилы: если рабочий ТФ показывает серую пунктирную линию (FLAT), не форсируйте сделки — это гейт ER/ADX сообщает, что текущее движение неэффективно. Золотой цвет (RISKY) после разворота часто отмечает ранние, неподтверждённые развороты: агрессивные трейдеры могут заходить малым объёмом, консервативные — ждать, пока линия станет сплошной.
Ничто из перечисленного не является торговой рекомендацией — это паттерны использования инструмента. Сначала тестируйте любой подход на демо.
Заметки о тестере стратегий
Панель показывает только тестируемый символ — тестер не может передавать данные других символов мультивалютному индикатору. Это ограничение платформы, а не дефект. Обновление панели в тестере ограничено одним разом в 2 секунды тестерного времени для скорости визуального режима. Сама сигнальная линия (вся логика двигателя и фильтров) полностью тестируема и идентична поведению в реальном времени.
Советы по производительности
Держите Max Symbols на уровне или ниже реального размера Обзора рынка вашего брокера; 20–30 комфортно на MT5, 8–12 на MT4. Если вы никогда не используете матрицу, держите её закрытой — фоновые хендлы для других символов создаются только при первом открытии. History Bars = 1000 достаточно для визуальной работы; увеличивайте только если нужна линия далеко в истории.
Частые вопросы
Линия один раз изменила цвет внутри бара и вернулась обратно — это перерисовка? Нет. Закрытые бары никогда не меняются. Вы видели текущий бар до обновления Stable Live Bar, либо у вас установлено Stable Live Bar = false. По умолчанию классификация текущего бара зафиксирована.
Ячейки матрицы показывают • для некоторых символов. Терминал ещё не загрузил историю этого символа/ТФ. Откройте этот график один раз или просто подождите — ячейки заполнятся по мере поступления данных.
Дельта постоянно показывает 100% на экзотическом символе. На очень тонких символах тиковый объём в коротком окне может быть односторонним. Увеличьте Volume Delta Lookback Period.
Может ли индикатор торговать автоматически? Нет. Это индикатор. Состояния тренда и фильтров доступны в буферах индикатора (0–3 состояния линии, 4 тренд, 6 знаковая дельта), поэтому разработчик советника может читать их через iCustom/CopyBuffer.
MT4 и MT5 дают немного разные исторические линии. При одинаковых параметрах они должны совпадать бар в бар. Если нет — проверьте, что в обоих терминалах загружен одинаковый объём истории и одинаковое значение History Bars.