Prime Trend Pro MT5
- 지표
-
Artem Koliada
 MQL4/MQL5 Developer 💻 | Turning trading strategies into profitable code. Expert Advisors (EA) & Custom Indicators for MT4/MT5. Let's automate your trading
 - 버전: 2.5
- 업데이트됨: 29 3월 2026
- 활성화: 8
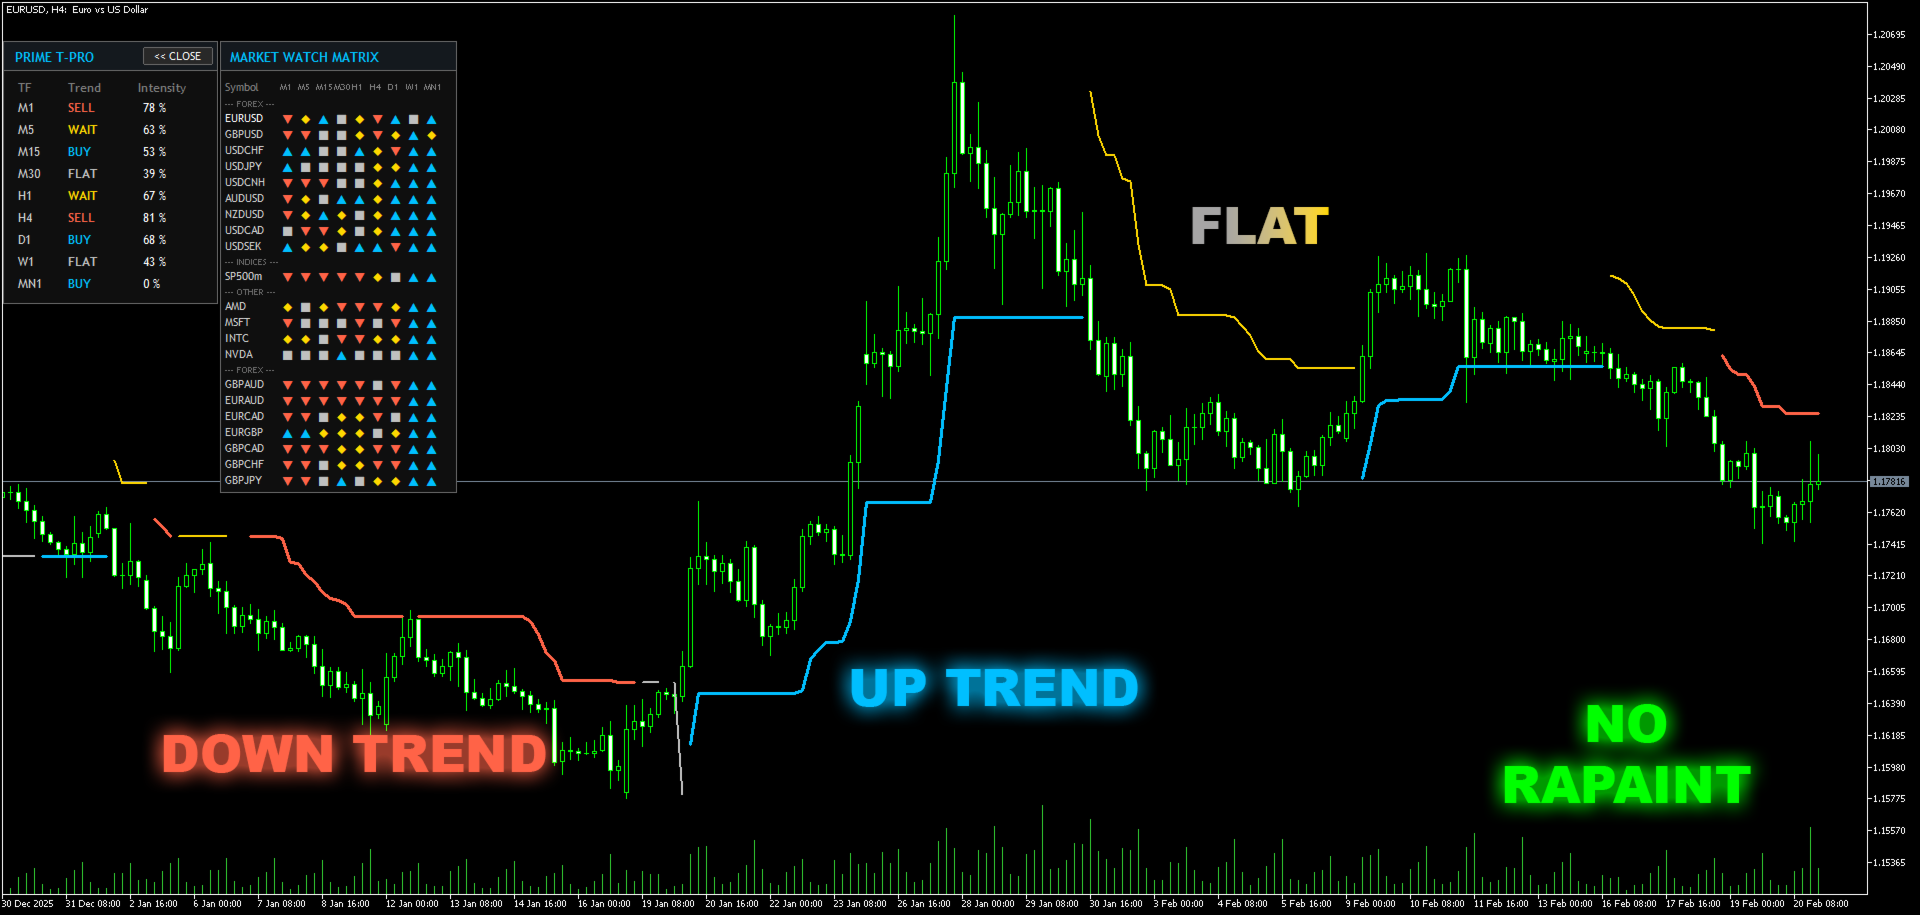
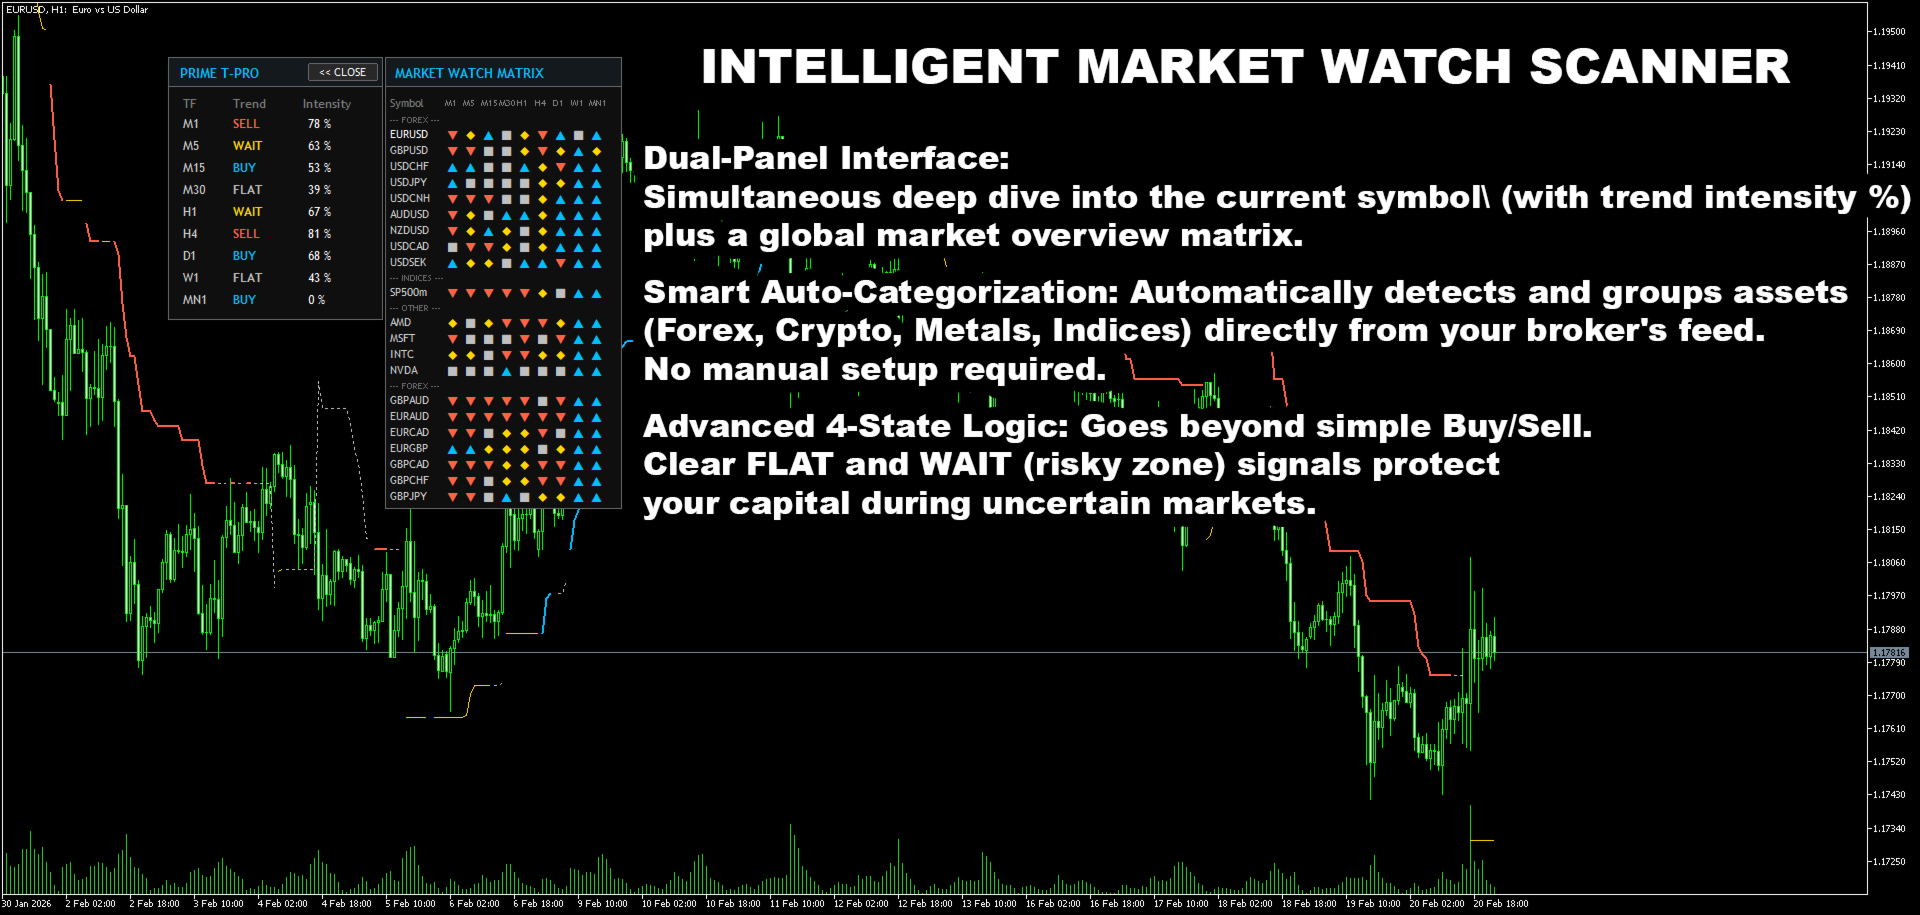
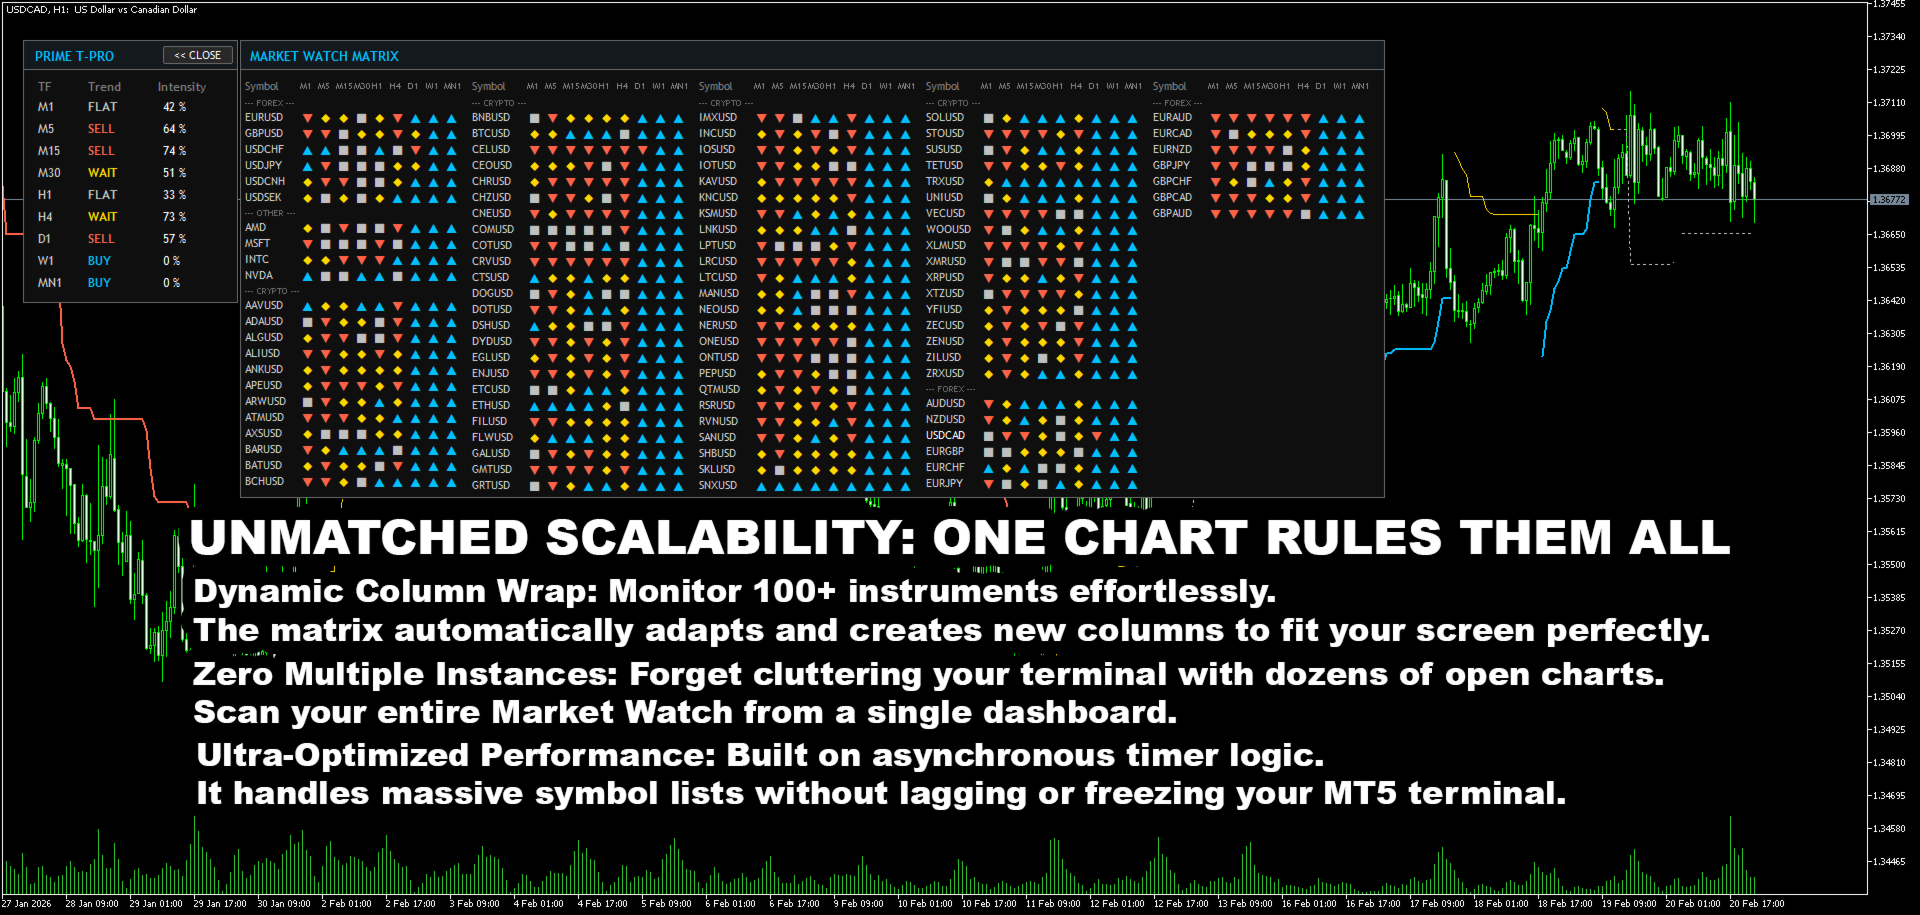
A non-repainting trend system with an advanced "Flat Market" filter.
Description:
Prime Trend Pro is a professional trend-following indicator designed to solve the biggest problem in trading: losing money during chopping (sideways) markets.
Unlike standard trend indicators that force a signal on every candle, Prime Trend Pro analyzes market volatility (ADX) and the global trend baseline (Moving Average) to filter out low-quality setups.
Key Features:
-
100% Non-Repainting: The signal is determined at the Close of the bar. Once a line is drawn, it never changes, shifts, or disappears. You can backtest it reliably.
-
Smart Flat Filter (The "Grey Zone"): When market volatility drops, the indicator automatically switches to a "Neutral" state (Grey Dotted Line). This prevents false signals during periods of uncertainty.
-
Baseline Protection: Integrated Moving Average filter. The indicator ignores Buy signals below the baseline and Sell signals above it, keeping you aligned with the global trend.
-
Visual Clarity: The indicator creates clear "Gaps" when the trend changes direction, making it easy to spot reversals instantly.
How to Trade:
-
BLUE Line (Buy Zone): The market is in a confirmed uptrend. Look for buying opportunities.
-
RED Line (Sell Zone): The market is in a confirmed downtrend. Look for selling opportunities.
-
GREY / DOTTED Line (Flat Zone): Low volatility or conflicting signals. Stay out of the market. This feature protects your capital from "whipsaw" movements.
Parameters:
-
ATR Period: Sensitivity of the trend calculation. Lower values = faster signals (Scalping). Higher values = longer trends (Swing).
-
ATR Multiplier: Width of the channel. Recommended range: 3.0 to 5.0.
-
Use ADX Filter: Enables/Disables the Flat Market detection.
-
ADX Level: The threshold for the flat zone (default: 20-25).
-
Use Baseline Filter: Enables/Disables the Moving Average filter.
-
Alerts: Pop-up, Push Notifications (Mobile), and Sound alerts are included.
Recommendations: Timeframes: M15, M30, H1, H4. Pairs: Works on all major pairs (EURUSD, GBPUSD, XAUUSD, US30).