ML Adaptivesupertrend

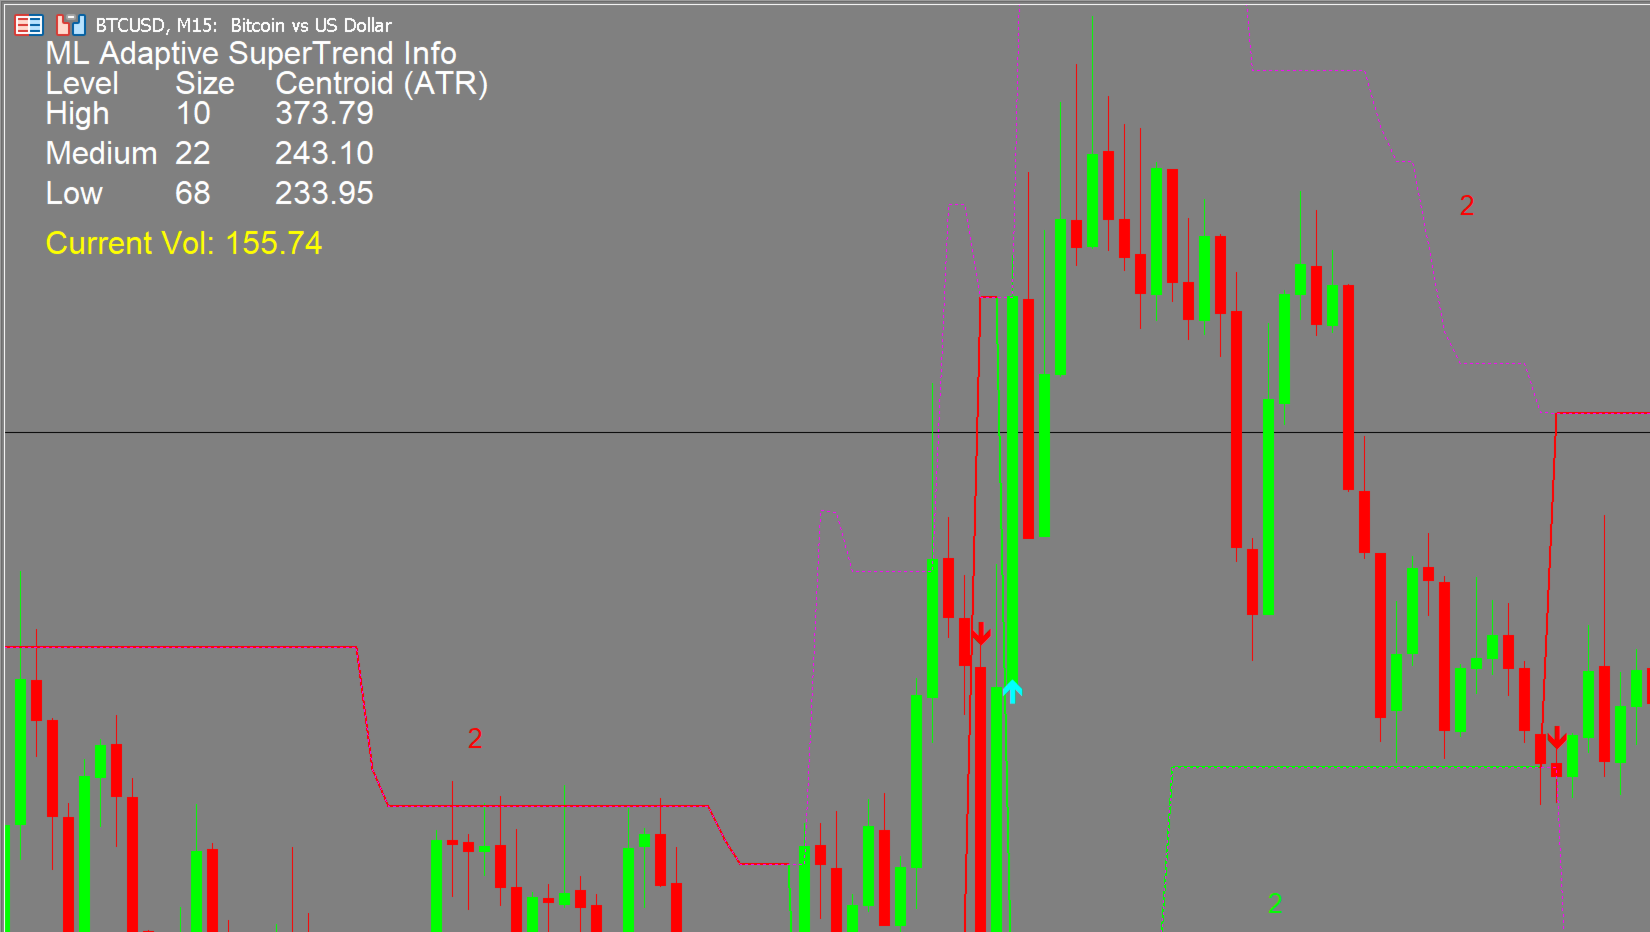
The Machine Learning Supertrend is a highly effective trading indicator specifically designed to identify and illustrate potential buy and sell signals through the use of clearly marked arrows. 


One of the key advantages of this indicator is that it operates as a leading indicator, meaning it anticipates market movements rather than following them. Unlike many traditional indicators, the Machine Learning Supertrend does not lag or repaint, ensuring the signals provided are timely and reliable.


If you would like to delve deeper into the functionality and application of this powerful tool, please feel free to reach out. I would be more than happy to share comprehensive reading materials and resources that will guide you on how to effectively utilize this indicator in your trading strategy.

Рекомендуем также
Caicai L&S Yield Histogram Important Notice: This indicator is an integral tool of the automated EA Caicai Long and Short Pair Trading . This indicator visually displays the percentage deviation (Yield %) of a pair's current spread relative to its own historical mean. It is an excellent tool for quickly visualizing the gross financial potential of a market distortion in Long & Short operations. Main Features: Percentage Visualization: Understand the size of the distortion in palpable percentage
CosmiCLab SMC FIBO CosmiCLab SMC FIBO — это профессиональный торговый индикатор, основанный на концепциях Smart Money Concepts (SMC), анализе структуры рынка и уровнях Fibonacci. Индикатор автоматически определяет свинги рынка и строит уровни Fibonacci по последнему импульсному движению. Также индикатор определяет ключевые изменения структуры рынка: BOS — Break Of Structure CHOCH — Change Of Character Дополнительно отображаются сигнальные стрелки BUY / SELL при пробое структуры. Индикатор подход
Этот индикатор представляет собой индикатор автоматического волнового анализа, который идеально подходит для практической торговли! Случай... Примечание.   Я не привык использовать западные названия для классификации волн. Из-за влияния соглашения об именах Тан Лунь (Тан Чжун Шуо Дзен) я назвал основную волну   ручкой   , а вторичную полосу волн —   сегментом   Ат. в то же время сегмент имеет направление тренда. Именование   в основном является трендовым сегментом   (этот метод именования буде
Euro Escalper V1 — Professionalnyi Institutsionalnyi Indikator Skalpinga Euro Escalper V1 — eto vysokoproizvoditelnyi torgovyi indikator, razrabotannyi dlya treiderov, trebuyushchikh institutsionalnoi tochnosti v kazhdoi tochke vkhoda. Rabotaet s Sinteticheskimi Indeksami (Deriv), Forex i lyubym aktivom, dostupnym v MetaTrader 5. Sochetaet zony likvidnosti na osnove Fibonachchi, vstroennyi dvigatel SuperTrend i professionalnuyu panel monitoringa v realnom vremeni. Klyuchevye Preimushchestva Bez
Link to our products: LINK The ICT Asian Killzone Indicator delivers a professional, institutional-grade framework by precisely defining the Asian trading session from 00:00 to 04:00 GMT with absolute accuracy. It streamlines market structure analysis by isolating liquidity accumulation, range formation, and volatility compression during the Asian session. Built for serious ICT and Smart Money traders, it enhances strategic decision-making, execution confidence, and Tokyo session directional bi
Dual-Period Williams %R Oscillator for MT5 A sophisticated trend exhaustion detector that combines two Williams %R oscillators to identify high-probability reversal opportunities through confluence analysis. ======================================================================================== Key Features Intelligent Dual-Signal System Fast and Slow Williams %R periods working in confluence Real-time trend exhaustion detection with reliable signals Optimized calculations for smooth MT5 perfor
Follow The Line MT5
Oliver Gideon Amofa Appiah
4.6 (35)
This indicator obeys the popular maxim that: "THE TREND IS YOUR FRIEND" It paints a GREEN line for BUY and also paints a RED line for SELL. (you can change the colors). It gives alarms and alerts of all kinds. IT DOES NOT REPAINT and can be used for all currency pairs and timeframes. Yes, as easy and simple as that. Even a newbie can use it to make great and reliable trades. NB: For best results, get my other premium indicators for more powerful and reliable signals. Get them here: https://www.m
FREE
Уникальный индикатор, реализующий профессиональный и количественный подход к торговле на возврате к среднему. Он использует тот факт, что цена отклоняется и возвращается к среднему предсказуемым и измеримым образом, что позволяет использовать четкие правила входа и выхода, которые значительно превосходят неколичественные торговые стратегии. [ Installation Guide | Update Guide | Troubleshooting | FAQ | All Products ] Четкие торговые сигналы Удивительно легко торговать Настраиваемые цвета и разме
RBreaker Gold Indicators — это краткосрочная внутридневная торговая стратегия для фьючерсов на золото, которая сочетает в себе два подхода: трендовое следование и внутридневные развороты. Она позволяет не только получать прибыль при трендовом движении, но и своевременно фиксировать прибыль при развороте рынка, открывая позиции в новом направлении. Данная стратегия на протяжении 15 лет подряд входила в десятку самых прибыльных торговых стратегий по версии американского журнала Futures Truth. Она
Price Magnet — Индикатор зон плотности цены и уровней притяжения Price Magnet — это профессиональный аналитический инструмент, который определяет ключевые уровни поддержки и сопротивления на основе статистической плотности распределения цены (Price Density). Индикатор анализирует заданный исторический период и находит ценовые значения, на которых рынок находился дольше всего. Эти зоны выступают в роли «магнитов» — они притягивают цену или служат фундаментом для разворота. В отличие от стандартны
1. Overview The Scalping PullBack Signal indicator is a powerful technical analysis tool designed to help traders identify scalping opportunities based on potential pullback and reversal signals. This tool is particularly useful on lower timeframes (below 15 minutes) but can also be applied on higher timeframes for longer-term trades. This indicator integrates several key analytical components, providing a comprehensive view of trends and potential entry/exit points, helping you make quick and e
FREE
HAS RSI Signal — Профессиональный трендовый индикатор с расчетом SL/TP HAS RSI Signal — это мощный торговый инструмент, объединяющий проверенную классику и современные алгоритмы фильтрации шума. Индикатор анализирует рынок через призму сглаженных свечей Heiken Ashi и осциллятора RSI, предоставляя трейдеру четкие сигналы на вход в моменты разворота тренда или выхода из зон перекупленности/перепроданности. Основные преимущества: Двойная фильтрация: Использование Heiken Ashi Smoothed позволяет искл
Indicator Name: Fibaction – price action candle Detector Description: Fibo Signal Boxes is a powerful Smart Money Concept (SMC)-inspired indicator that auto-detects price action candles. bullish hammers and shooting stars, then draws precise Fibonacci entry zones and multiple take-profit levels directly on the chart. as for the SL personally i use 40 pips rules  Key Features: Detects bullish hammer and shooting star reversal candles. Automatically draws Fibonacci entry and TP boxes. as
Congestion Breakout MT5
CARLO FINANCIAL SOFTWARE TECHNOLOGY LLC
3 (1)
Introducing "Congestion Breakout MT5" - the indicator that helps you identify congestion zones in your chart and alerts you when the price breaks through them.   Traders know that congestion zones can be key areas of price action and can indicate potential turning points in the market. However, spotting these zones and anticipating breakouts can be a difficult and time-consuming task. That's where "Congestion Breakout" comes in. This powerful indicator uses advanced algorithms to analyze the pri
Это мультисимвольный и мультифреймовый сканер для нашего индикатора - ACB Breakout Arrows . По умолчанию он сканирует сигналы на покупку/продажу по 28 валютным парам и 9 таймфреймам одновременно .  Особенности Сканирует 252* комбинации символов и таймфреймов с одного графика. Откройте график с найденным сигналом и предустановленным шаблоном одним щелчком мыши.  Простое перетаскивание панели в любое место на графике. Оповещения в реальном времени с помощью всплывающих окон, звуков, push-уведомле
Optimized Spike Detector Pro for MT5 is a professional-grade technical indicator designed to identify and capitalize on sharp, impulsive price movements (spikes) in any financial instrument. Utilizing a sophisticated, multi-algorithmic core, it distinguishes significant volatility expansions from market noise with exceptional accuracy. The tool dynamically adapts to changing market conditions, filtering out false signals and highlighting only high-probability spike setups in real-time. Featuring
Introducing the Bollinger Flipper Indicator – Your Ultimate Trading Edge!   Are you tired of second-guessing your entries and exits? The Bollinger Flipper Indicator is here to flip the game in your favor.   Built with the power of Bollinger Bands + Level 3 Power System + ZigZag Fractals, this advanced tool is designed to spot high-probability buy & sell signals with precision. SPECIAL BONUS (VALID TILL JUNE 2026)- OUR DAILY SCALPER EA for BTCUSD and VIX75 •································
Chỉ báo này sẽ thông báo cho bạn nếu cấu hình xu hướng thành công. Tín hiệu theo xu hướng không nên được tăng theo, nhưng tín hiệu mua ở mức giá thấp theo mô hình giao dịch thông thường của bạn, hoặc tín hiệu bán ở mức giá tốt, là một lựa chọn rất tốt. Hãy thiết lập nó trên khung thời gian lớn hơn và theo dõi các khung thời gian nhỏ hơn, bám sát các xu hướng chính. Tôi thường thiết lập ba khung thời gian gần nhau nhất và không bao giờ đi ngược tín hiệu của INdicator này. INdicator   này không có
Общее описание Этот индикатор — усовершенствованная версия классического канала Дончия с добавлением практических функций для реальной торговли. Помимо стандартных трёх линий (верхняя, нижняя и средняя), система определяет пробои и отображает их на графике стрелками, показывая только линию, противоположную текущему направлению тренда для более чистого восприятия. Индикатор включает: Визуальные сигналы : цветные стрелки при пробое Автоматические уведомления : всплывающие окна, push и email Фильтр
FREE
Divergent Stochastic Filter II Catch Reversals Early, Filter Noise, Trade with Confidence The Edge: Why This Stochastic is Different  Every trader knows the Stochastic oscillator. But knowing when to trust its signals, that's the real challenge. The Divergent Stochastic Filter II transforms this classic indicator into a precision reversal detection system by adding critical elements: divergence intelligence, signal filtering and exhaustion detection.  While standard Stochastic oscillators fire s
Этот индикатор находит AB = шаблоны восстановления CD. Паттерн AB = CD Retracement представляет собой 4-точечную ценовую структуру, в которой начальный ценовой сегмент частично восстановлен и сопровождается равноудаленным движением от завершения отката, и является базовой основой для всех гармонических паттернов. [ Руководство по установке | Руководство по обновлению | Устранение неполадок | FAQ | Все продукты ] Настраиваемые размеры рисунков Настраиваемые соотношения AC и BD Настраиваемые п
PROMETHEUS TECHNICAN VERSION Free | By THE SONS A gift from The Sons — no strings, no trial, no expiry. Every trader deserves access to professional-grade market intelligence. That belief is why Prometheus Technical Version exists, and why it costs nothing. Consider it our handshake to the trading community. What You're Getting This is not a simplified tool dressed up as a gift. Prometheus Technican Version is a fully built, institutional-quality technical analysis indicator running a dual-model
FREE
Free automatic Fibonacci is an indicator that automatically plots a Fibonacci retracement based on the number of bars you select on the BarsToScan setting in the indicator. The Fibonacci is automatically updated in real time as new highest and lowest values appears amongst the selected bars. You can select which level values to be displayed in the indicator settings. You can also select the color of the levels thus enabling the trader to be able to attach the indicator several times with differe
FREE
The RSI with Moving Averages indicator combines the classic Relative Strength Index with customizable moving averages, offering deeper insights into market momentum and trend direction. By smoothing the RSI curve with short- and long-term averages, traders can better distinguish true reversals from noise. This tool highlights overbought and oversold levels, reveals divergences between price and momentum, and confirms entry or exit points with enhanced accuracy. Its adjustable parameters allow tr
FREE
Do you, like me, like to trade with the trend? Then this indicator will help you! Rainbow Trend is a trend indicator, which uses several Moving Averages on the chart. It measures different trend strenght zones for different periods: very long term, long term, mid term, short term and very short term. Each zone has its color, and it is possible to have sound alert when the prices leaves a zone and enters another. Its configuration is very simple. If you find any bug or have any suggestions, conta
Trend based indicator Identify trends with this indicator A simple-to-use trend indicator No complicated settings Attributes: Can be used in all symbols Can be used in all time frames Relatively high signals No complicated settings Specific to the trend Lifetime support Settings: Alarm Show Alert: By activating these settings, after receiving the signal, you will receive an alarm in Metatrader Alarm Show Notification: By activating these settings, after receiving the signal, you will receive a
Coral trend is   a trend-following indicator that is widely popular among FOREX traders . It is usually used as a confluence with other indicators. It uses combinations of moving averages with complex smoothing formulas! It has two configurable parameters: Coefficient   - smoothing ratio (*) Applied price Calculation: Coral = (-0.064) * B6 + 0.672 * B5 - 2.352 * B4 + 2.744 * B3
FREE
Индикатор Rocket Trend трендовый. Индикатор рисует вдоль графика двухцветные точки соединенные между собой линиями. Это трендовый индикатор, представляет из себя алгоритмический индикатор. Прост в работе и понимании при появлении синего кружка необходимо покупать, при появлении красного - продавать. Индикатор используется для скальпинга и пипсовки, не плохо себя зарекомендовал. Rocket Trend доступный для анализа направления тренда за конкретный отрезок времени. Идеально подходит для начинающих
FlatBreakout  MT5 (Бесплатная версия) Детектор флэта и пробоев для MT5 — только для GBPUSD FlatBreakout   MT5  — это бесплатная версия профессионального индикатора FlatBreakoutPro MT5, специально предназначенная для анализа флэта и поиска точек пробоя только по паре   GBPUSD . Идеально для трейдеров, которые хотят познакомиться с уникальной фрактальной логикой FlatBreakout MT5  и протестировать сигналы пробоя диапазона на реальном рынке. Для кого этот продукт Для трейдеров, предпочитающих торгов
FREE
This indicator uses the metaquotes ZigZag indicator as base to plot fibonacci extension and fibonacci retracement based in the Elliot waves. A fibonacci retracement will be plotted on every wave draw by the ZigZag. A fibonacci extension will be plotted only after the 2nd wave. Both fibonacci will be updated over the same wave tendency. Supporting until 9 consecutive elliot waves. Parameters: Depth: How much the algorithm will iterate to find the lowest and highest candles Deviation: Amount of
С этим продуктом покупают
SuperScalp Pro
Van Minh Nguyen
4.64 (25)
SuperScalp Pro – Продвинутая скальпинговая индикаторная система с множественными фильтрами SuperScalp Pro — это продвинутый скальпинговый индикатор, который сочетает классический Supertrend с несколькими интеллектуальными фильтрами подтверждения для поиска торговых возможностей. Он эффективно работает на различных таймфреймах от M1 до H4, с оптимизированной производительностью на XAUUSD, BTCUSD и основных валютных парах Forex. Индикатор предоставляет четкие сигналы Buy и Sell, а также автоматиче
Каждый покупатель этого индикатора получает дополнительно Бесплатно: Авторскую утилиту "Bomber Utility", которая автоматически сопровождает каждю торговую операцию, устанавливает уровни Стоп Лосс и Тейк профит и закрывает сделки согласно правилам этой стратегии, Сет-файлы для настройки этого индикатора на различных активах, Сет-файлы для настройки Bomber Utility в режимы: "Минимум Риска", "Взвешенный Риск" и "Стратегия Выжидания", Пошаговый видео-мануал, который поможет вам быстро установить, на
SignalTech MT5 is an unique fully rule based trading system for EURUSD, USDCHF, USDJPY, AUDUSD, NZDUSD, EURJPY, AUDJPY, NZDJPY, CADJPY.  All the winning trades with chart setups are published on the comments page. 2026-05 3493 Pips (Until 05-21 NY Closed) 2026-04 2243 Pips 2026-03 2165 Pips 2026-02 2937 Pips 2026-01 2624 Pips 2025-12 1174 Pips It can generate signals with Buy/Sell Arrows and Pop-Up/Sound Alerts. Each signal has clear Entry and Stop Loss levels, which should be automatically flag
Entry In The Zone and SMC Multi Timeframe is a real-time 2-in-1 market analysis tool that combines market structure analysis and a No Repaint BUY / SELL signal system into a single indicator, built on Smart Money Concepts (SMC) — a widely adopted framework used by professional traders to understand market structure. This indicator helps you see the market more clearly, make decisions based on structure rather than guesswork, and focus on high-probability zones where price is more likely to react
Давайте сначала будем честны. Ни один индикатор сам по себе не сделает вас прибыльным. Если кто-то говорит вам обратное — он продаёт вам мечту. Любой индикатор, который показывает идеальные стрелки покупки/продажи, можно сделать безупречным — просто увеличьте нужный участок истории и сделайте скриншот успешных сделок. Мы так делать не будем. SMC Intraday Formula — это инструмент. Он считывает структуру рынка за вас, определяет зоны с наивысшей вероятностью движения цены и точно показывает, как
Azimuth Pro
Ottaviano De Cicco
5 (7)
Azimuth Pro V2: Синтетический фрактальный структурный анализ и подтверждённые входы для MT5 Обзор Azimuth Pro — многоуровневый индикатор свинговой структуры от Merkava Labs . Четыре вложенных уровня свингов, привязанный к свингам VWAP, определение ABC-паттернов, трёхтаймфреймная структурная фильтрация и подтверждённые входы на закрытой свече — один график, один рабочий процесс от микро-свингов до макро-циклов. Это не слепой сигнальный продукт. Это рабочий процесс, основанный на структуре, для т
Power Candles V3 — самооптимизирующийся индикатор силы Power Candles V3 преобразует силу валюты и инструмента в готовый к использованию торговый план на каждом графике, к которому он прикреплен. Вместо того, чтобы просто раскрашивать свечи, он выполняет автоматическую оптимизацию в режиме реального времени в фоновом режиме и предоставляет вам оптимальные значения Stop Loss, Take Profit и порог сигнала для выбранного вами символа. Один клик — и все готово для реальной торговли: на графике появляю
Trend Catcher   анализирует движения рыночных цен, используя комбинацию собственных и индивидуально разработанных адаптивных индикаторов анализа тренда. Он определяет истинное направление рынка, отфильтровывая краткосрочные шумы и фокусируясь на силе импульса, расширении волатильности и поведении ценовой структуры. Он также использует комбинацию сглаживающих и фильтрующих тренд индикаторов, таких как скользящие средние, RSI и фильтры волатильности. Мониторинг реальных операций, а также другие
Если вы покупаете этот индикатор, вы получите мой профессиональный Trade Manager + EA БЕСПЛАТНО. Прежде всего стоит подчеркнуть, что эта торговая система является индикатором без перерисовки, без повторной отрисовки и без задержки, что делает ее идеальной как для ручной, так и для роботизированной торговли. Онлайн курс, руководство и загрузка пресетов. «Smart Trend Trading System MT5» - это комплексное торговое решение, созданное для новичков и опытных трейдеров. Он объединяет более 10 премиаль
FX Trend NG: Следующее поколение интеллектуального анализа трендов на разных рынках Обзор FX Trend NG — это профессиональный инструмент анализа трендов и мониторинга рынка с поддержкой нескольких таймфреймов. Он позволяет за секунды получить полное структурное понимание текущего состояния рынка. Вместо переключения между десятками графиков вы мгновенно видите, какие инструменты находятся в тренде, где импульс ослабевает и где наблюдается сильная синхронизация между таймфреймами. Специальное пр
ARIPoint
Temirlan Kdyrkhan
1 (1)
ARIBot is a powerful trading companion designed to generate high-probability entry signals with dynamic TP/SL/DP levels based on volatility. Built-in performance tracking shows win/loss stats, PP1/PP2 hits, and success rates — all updated live. Key Features: Buy/Sell signals with adaptive volatility bands Real-time TP/SL/DP levels based on ATR Built-in MA Filter with optional ATR/StdDev volatility Performance stats panel (Success, Profit/Loss, PP1/PP2) Alerts via popup, sound, push, or email Cus
Gann Made Easy   - это профессиональная, но при этом очень простая в применении Форекс система, основанная на лучших принципах торговли по методам господина У.Д. Ганна. Индикатор дает точные BUY/SELL сигналы, включающие в себя уровни Stop Loss и Take Profit. ПОЖАЛУЙСТА, СВЯЖИТЕСЬ СО МНОЙ ПОСЛЕ ПОКУПКИ, ЧТОБЫ ПОЛУЧИТЬ ТОРГОВЫЕ ИНСТРУКЦИИ И ОТЛИЧНЫЕ ДОПОЛНИТЕЛЬНЫЕ ИНДИКАТОРЫ БЕСПЛАТНО! Вероятно вы уже не раз слышали о торговли по методам Ганна. Как правило теория Ганна отпугивает от себя не только
Прежде всего стоит подчеркнуть, что этот Торговый Инструмент является Неперерисовывающимся Нерепейнтинговым Индикатором, что делает его идеальным для профессиональной торговли. Онлайн-курс, руководство пользователя и демонстрация. Индикатор Концепций Умного Действия Цены - очень мощный инструмент как для новичков, так и для опытных трейдеров. Он объединяет более 20 полезных индикаторов в одном, комбинируя передовые торговые идеи, такие как анализ Inner Circle Trader и стратегии торговли концеп
Раскройте силу торговли трендами с помощью индикатора Trend Screener: вашего идеального решения для торговли трендами, основанного на нечеткой логике и мультивалютной системе! Повысьте уровень своей торговли по тренду с помощью Trend Screener, революционного индикатора тренда, основанного на нечеткой логике. Это мощный индикатор отслеживания тренда, который сочетает в себе более 13 инструментов и функций премиум-класса и 3 торговые стратегии, что делает его универсальным выбором для превращения
Большинство стрелочных индикаторов дают сигнал и оставляют вас самостоятельно разбираться со всем остальным. KT Alpha Hunter Arrows дает вам полный торговый план. Каждая сигнальная стрелка появляется вместе с уже готовым планом: линия входа, стоп-лосс, четыре уровня тейк-профита и живой вердикт по преимуществу, который показывает, стоит ли сейчас торговать данный символ и таймфрейм. В комплект входит Trade Manager EA, который берет на себя сопровождение сделки после вашего входа, помогая сохраня
Market Structure Order Block Dashboard MT5 — это индикатор MT5, разработанный для трейдеров, которые хотят читать рыночную структуру и основные зоны реакции цены прямо на графике. Он объединяет BOS, ChoCH, Order Blocks, Fair Value Gaps (FVG), Ликвидность, Kill Zones, Volume Profile и компактную панель для быстрого анализа. Индикатор предназначен для трейдеров, использующих рыночную структуру, концепции ICT и Smart Money как основу для принятия решений. Он помогает выявлять продолжения тренда, во
Прежде всего стоит подчеркнуть, что этот торговый индикатор не перерисовывается, не перерисовывает и не отставает, что делает его идеальным как для ручной, так и для роботизированной торговли. Руководство пользователя: настройки, вводы и стратегия. Атомный аналитик - это индикатор ценового действия PA, который использует силу и импульс цены, чтобы найти лучший край на рынке. Оборудованный расширенными фильтрами, которые помогают убирать шумы и ложные сигналы, и повышают торговый потенциал. Испо
Представляем       Quantum Breakout PRO   , новаторский индикатор MQL5, который меняет ваш способ торговли в зонах прорыва! Разработан командой опытных трейдеров со стажем торговли более 13 лет,       Квантовый прорыв PRO       разработан, чтобы поднять ваше торговое путешествие к новым высотам с его инновационной и динамичной стратегией зоны прорыва. Quantum Breakout Indicator покажет вам сигнальные стрелки на зонах прорыва с 5 целевыми зонами прибыли и предложением стоп-лосса на основе поля
FX Levels: Исключительно точные уровни поддержки и сопротивления для всех рынков Краткий обзор Ищете надежный способ определить уровни поддержки и сопротивления для любых инструментов—валют, индексов, акций или сырьевых товаров? FX Levels сочетает традиционный «Lighthouse» метод с современным динамическим подходом, обеспечивая почти универсальную точность. Благодаря сочетанию опыта реальных брокеров и автоматических ежедневных плюс «в реальном времени» обновлений, FX Levels поможет вам выявлят
FX Power: Анализируйте силу валют для более эффективной торговли Обзор FX Power — это ваш незаменимый инструмент для понимания реальной силы валют и золота в любых рыночных условиях. Определяя сильные валюты для покупки и слабые для продажи, FX Power упрощает принятие торговых решений и выявляет высоковероятные возможности. Независимо от того, хотите ли вы следовать за трендами или предсказывать развороты с использованием экстремальных значений дельты, этот инструмент идеально адаптируется под
OrderFlux | Футпринт и Orderflow для MetaTrader 5 Версия 2.0 – Визуализация Bid/Ask в реальном времени для активных трейдеров OrderFlux — это индикатор футпринта и потока ордеров (orderflow) для MT5. Он показывает не только, куда пошла цена, но и что происходит внутри движения: объем Bid/Ask на каждом ценовом уровне, дельту, дисбаланс (imbalance) и распределение объема. Многие графики показывают вам только конечный результат свечи. OrderFlux показывает вам путь к нему. Именно это помогает, когда
Btmm state engine pro
Garry James Goodchild
5 (4)
BTMM State Engine Pro is a MetaTrader 5 indicator for traders who use the Beat The Market Maker approach: Asian session context, kill zone timing, level progression, peak formation detection, and a multi-pair scanner from a single chart. It combines cycle state logic with a built-in scanner dashboard so you do not need the same tool on many charts at once. What it does Draws the Asian session range; session times can follow broker server offset or be set in inputs. Tracks level progression (L
Quantum TrendPulse
Bogdan Ion Puscasu
5 (25)
Представляем   Quantum TrendPulse   , совершенный торговый инструмент, который объединяет мощь   SuperTrend   ,   RSI   и   Stochastic   в один комплексный индикатор, чтобы максимизировать ваш торговый потенциал. Разработанный для трейдеров, которые ищут точность и эффективность, этот индикатор помогает вам уверенно определять рыночные тренды, сдвиги импульса и оптимальные точки входа и выхода. Основные характеристики: Интеграция SuperTrend:   легко следуйте преобладающим рыночным тенденциям и п
RelicusRoad Pro: Квантовая Рыночная Операционная Система СКИДКА 70% ПОЖИЗНЕННЫЙ ДОСТУП (ОГРАНИЧЕНО) - ПРИСОЕДИНЯЙТЕСЬ К 2000+ ТРЕЙДЕРАМ Почему большинство трейдеров теряют деньги даже с «идеальными» индикаторами? Потому что они торгуют Единичными Концепциями в вакууме. Сигнал без контекста — это лотерея. Чтобы выигрывать стабильно, вам нужна КОНФЛЮЭНЦИЯ . RelicusRoad Pro — это не простой стрелочный индикатор. Это полная Количественная Рыночная Экосистема . Она отображает «Дорогу Справедливой Сто
Индикатор Trend Forecaster использует уникальный авторский алгоритм для определения точек входа в сделку по пробойной стратегии. Индикатор определяет ценовые скопления и анализирует движение цены возле уровней и показывает сигнал, когда цена пробивает уровень. Индикатор Trend Forecaster подходит для любых финансовых активов: валюты (Форекс), металлы, акции, индексы, криптовалюты. Также индикатор можно настроить для работы на любых тайм-фреймах, однако в качестве рабочего тайм-фрейма все же реком
Reversal Master для MT5 Reversal Master для MT5 — это не перерисовывающийся (non-repaint) индикатор разворотов для MetaTrader 5. Он помогает находить потенциальные точки разворота рынка и показывает максимальное благоприятное движение цены после каждого исторического сигнала, чтобы лучше понимать, как цена вела себя в подобных ситуациях в прошлом. Версия для MT5 сохраняет привычную логику разворотных сигналов оригинального Reversal Master для MT4, но добавляет улучшенную визуализацию, историческ
Meridian Pro
Ottaviano De Cicco
5 (2)
Meridian Pro 2.00: профессиональная multi-timeframe матрица тренда для MT5 Meridian Pro 2.00 - профессиональная адаптивная матрица тренда для MetaTrader 5. Она объединяет оригинальный трендовый движок Meridian, чистый chart ribbon, сигнальные стрелки по закрытому бару, dashboard на 8 таймфреймов, Fuel momentum, weighted consensus, synthetic HTF processing и chart-native линии контекста старших таймфреймов. Цель простая: читать текущий тренд, multi-timeframe структуру, силу, momentum и EA-ready с
Эта панель показывает последние доступные   гармонические паттерны   для выбранных символов, так что вы сэкономите время и будете более эффективны /   MT4 версия . Бесплатный индикатор:   Basic Harmonic Pattern Колонки индикатора Symbol:   отображаются выбранные символы Trend   :   бычий или медвежий Pattern   :   тип паттерна (Гартли, бабочка, летучая мышь, краб, акула, шифр или ABCD) Entry   :   цена входа SL:   цена стоп-лосса TP1:   цена первого тейк-профита TP2:   цена второго тейк-профи
Smart Structure Concepts MT5
Cristhian Alexander Gaibor Cuasquer
Smart Structure Concepts MT5 — это самый полный институциональный SMC-инструментарий для MetaTrader 5 — с обучающими подсказками на 4 языках и push-уведомлениями в режиме реального времени в момент, когда цена входит в зону. Большинство SMC-индикаторов рисуют боксы и оставляют вас гадать. Этот объясняет каждый сигнал прямо на графике. Наведите курсор на любой BOS, CHoCH, Order Block, FVG или уровень ликвидности — и сразу увидите, что это значит и что делать дальше — на английском, испанском, п
Market Structure Patterns
Samuel Manoel De Souza
4.47 (19)
Market Structure Patterns   is an indicator based on   smart money concepts   that displays   SMC/ICT   elements that can take your trading decisions to the next level. Take advantage of the   alerts ,   push notifications   and   email messages   to keep informed from when an element is formed on the chart, the price crosses a level and/or enters in a box/zone. Developers can access the values of the elements of the indicator using the   global variables  what allows the automation of trading
Другие продукты этого автора
This MQL5 indicator, named BoS_ChoCh_Indicator, detects Break of Structure (BoS) and Change of Character (ChoCh) in trading charts. It identifies pivot highs and lows using a user-defined period (default 5), monitors price breakouts above highs or below lows, classifies them as bullish/bearish BoS or ChoCh based on the prevailing trend, draws colored lines and labels on the chart for visualization, and populates buffers with signals, structure levels, and trend direction (1 for up, -1 for down)
If you are unsure how to use this indicator, please feel free to reach out to me. I will explain it to you and provide reading materials to help you make the most of it. Here’s a brief description of how to use the indicator effectively. MT4 version: https://www.mql5.com/en/market/product/129509?source=Site +Market+My+Products+Page My Other Products:  https://www.mql5.com/en/users/1700046313/seller How to Use TD Sequential by Tom DeMark The TD Sequential is a technical analysis indicator develo
If you are unsure how to use this indicator, please feel free to reach out to me. I will explain it to you and provide reading materials to help you make the most of it. Here’s a brief description of how to use the indicator effectively. How to Use TD Sequential by Tom DeMark The TD Sequential is a technical analysis indicator developed by Tom DeMark, designed to identify potential turning points in market trends. It is widely used by traders to anticipate market reversals and manage trading ris
This indicator functions similarly to the traditional Relative Strength Index (RSI), but it's integrated directly onto the main price chart. This setup allows traders to more easily identify price fluctuations and recognize conditions of overbought or oversold markets. By observing the indicator in conjunction with price movements, you can gain valuable insights into potential trend reversals or continued momentum. Keep an eye on these signals to enhance your trading strategy. Happy trading, eve
FREE
Overview The TD Sequential EA is a sophisticated automated trading system designed to capitalize on the TD Sequential indicator, developed by Tom DeMark. This EA identifies trading opportunities based on TD Sequential setups and executes trades with predefined risk management parameters. It offers a clean and customizable chart appearance and allows users to set their own lot sizes and other trading parameters. Key Features Automated Trading : Executes buy and sell orders based on TD Sequential
To access the TD sequential Scanner for MT5, please check https://www.mql5.com/en/market/product/123369?source=Site +Market+My+Products+Page. One of the MT5 versions includes additional timeframes such as M1, M2, M3,H2,H6,H8 and so on.( https://www.mql5.com/en/market/product/123367?source=Site +Market+My+Products+Page) TD Sequential Scanner: An Overview The TD Sequential scanner is a powerful technical analysis tool designed to identify potential price exhaustion points and trend reversals in fi
The indicator I’m referring to is a leading indicator, similar to the Bill Williams Fractals indicator, but with an added feature: it draws vertical lines on the chart to mark significant points in time. This functionality makes it particularly useful for traders as it provides clear visual cues for potential trading opportunities. What sets this indicator apart is its versatility; it can be applied across all timeframes and any currency pair, making it suitable for a wide range of trading stra
This indicator functions similarly to the Relative Strength Index (RSI), but with a key difference: instead of being displayed in a separate window, it overlays directly on the main price chart. This allows for more convenient visualization and interpretation of market momentum alongside price movements. I believe this indicator will enhance your trading experience by providing clearer insights into market conditions. Wishing you successful trading!
This tool is designed specifically for traders seeking to identify market reversals, allowing you to capitalize on advantageous trading opportunities. The indicator has undergone extensive testing and has established itself as a leading indicator; it often predicts market movements effectively. When a buy or sell signal is generated by the indicator, it tends to align with the market’s subsequent behavior, following the trend indicated by the signal. By utilizing this indicator, you can enhance
If you are unsure how to use this indicator, please feel free to reach out to me. I will explain it to you and provide reading materials to help you make the most of it. Most effective with TD sequential :           MT4:  https://www.mql5.com/en/market/product/129509?source=Site +Profile+Seller           MT5:  https://www.mql5.com/en/market/product/129507?source=Site +Profile+Seller My Other products:  https://www.mql5.com/en/users/1700046313/seller Here’s a brief description of how to use the
This indicator outlines take profit (TP) stations derived from the Dinapoli ABC price projections. The key levels identified include COP (the critical operation point) designated as TP1, OP (the optimal point) marked as TP3, and SXOP (the secondary operation point) noted as TP4. This indicator proves to be especially beneficial for traders entering positions without clearly defined exit points. The Dinapoli levels provide precise price projections that highlight where the market is most likely
A fair value gap (FVG) is a temporary price gap that occurs when the price of a stock or security is out of line with its fair value.   This gap is often caused by an imbalance between buyers and sellers. How it works Price imbalance When there is an imbalance between buyers and sellers, the price of a security can move too quickly. Price gap This creates an unadjusted area on the price chart, known as the fair value gap Price correction The price is often drawn back to the fair value gap, as i
If you're familiar with COP, OP, and XOP levels, this indicator is definitely worth considering. There's no need to manually plot the ABC levels, as the indicator automatically calculates and displays the OP projection levels for you, updating regularly as the price changes. This is an essential indicator for your trading toolkit. Please if you are unsual on how to use this indicator feel fell to ask me for help and i can assist you where i can. Happy trading!
If you're familiar with trading using Dinapoli levels, then this indicator is definitely worth your attention. It automatically plots key levels such as COP (Change of Polarity), OP (Objective Price), and XOP (Extended Objective Price) on your charts, regardless of the timeframe you choose to work with. One of the standout features of this indicator is its ability to generate alerts. Whenever a new ABC pattern is automatically identified and plotted by the indicator, you will receive a notifica
Moving MinMax is a custom trend indicator that helps you easily identify the current market direction , reversals , and high-probability trade setups . This tool uses a unique calculation method that measures price pressure from both buyers and sellers, helping you see who is in control and when the market is likely to change direction. Unlike basic oscillators or moving averages, this indicator computes trend likelihoods using a distribution-based exponential model applied over a moving price w
How to Use this indicator-: 1. Trend-Following Strategy Objective : Enter trades in the direction of the trend when the Net Score and Signal Line confirm a strong trend. Identify the Trend : Look at the Net Score in the separate window: If the Net Score is above 0 and rising, the trend is bullish. If the Net Score is below 0 and falling, the trend is bearish. Confirm with the LazyLine on the main chart: Green LazyLine indicates an uptrend. Red LazyLine indicates a downtrend. Entry : Buy (Long)
Purpose : The AllAverages indicator plots a moving average line on the chart, with options to select from a wide range of MA types and price applications. It also displays buy and sell signals as arrows when the trend changes, and supports alerts (sound, email, push notifications) for these signals. Key Features : Supports multiple moving average types (e.g., SMA, EMA, HMA, TEMA, etc.). Allows customization of the price type (e.g., Close, Open, High, Low, Heiken Ashi variants). Displays a colore
The Trend and Revesal Indicator is a custom indicator designed to help traders identify trend direction, reversal points, and high-probability trade setups. It uses advanced mathematical calculations to analyze market behavior and highlight potential turning points with great accuracy. This indicator measures buying and selling pressure over a defined period and shows which side is in control. It provides a clear visual display of trend zones, reversal arrows, and momentum signals in a separate
If you are unsure how to use this indicator, please feel free to reach out to me. I will explain it to you and provide reading materials to help you make the most of it. TD Sequential Scanner: An Overview The TD Sequential scanner is a powerful technical analysis tool designed to identify potential price exhaustion points and trend reversals in financial markets. Developed by Tom DeMark, this method is widely used by traders to gauge market cycles and potential turning points with precision. Ho
This new version includes all MT5 timeframes (M1, M2, M3, M4, M5, M6, M10, M12, M15, M20, M30, H1, H2, H3, H4, H6, H8, H12, D1, W1 & MN1). The TD count for each timeframe is displayed on the top left corner. You don't need to do analysis anymore, as the scanner does all the analysis and updates every 1 second, allowing users to see real-time data for informed decision-making. Alerts are set on by default (can be turned off), which notifies users at the completion of every TD9. If you need a sca
Description of the Ichimoku Cloud Scanner  The Ichimoku Cloud Scanner is an advanced MetaTrader 5 (MT5) custom indicator designed to monitor the Ichimoku Cloud system across multiple timeframes and provide visual and audible alerts based on the price's position relative to the Ichimoku Cloud. Here's a detailed description of its features and functionalities: Features: Ichimoku Cloud Calculation : Utilizes the Ichimoku Cloud indicator, which consists of five components: Tenkan-sen (Conversion Lin
This indicator serves as a crucial leading tool for identifying pivotal points in market reversals. It provides traders with valuable insights regardless of the timeframe they are analyzing, whether it be minutes, hours, or days. Additionally, it is compatible with all trading pairs, making it highly versatile for various market scenarios. Incorporating this indicator into your trading strategy can significantly enhance your decision-making process and improve your overall trading performance. B
A fair value gap (FVG) is a temporary price gap that occurs when the price of a stock or security is out of line with its fair value.   This gap is often caused by an imbalance between buyers and sellers. How it works Price imbalance When there is an imbalance between buyers and sellers, the price of a security can move too quickly. Price gap This creates an unadjusted area on the price chart, known as the fair value gap Price correction The price is often drawn back to the fair value gap, as i
Purpose : The AllAverages indicator plots a moving average line on the chart, with options to select from a wide range of MA types and price applications. It also displays buy and sell signals as arrows when the trend changes, and supports alerts (sound, email, push notifications) for these signals. Key Features : Supports multiple moving average types (e.g., SMA, EMA, HMA, TEMA, etc.). Allows customization of the price type (e.g., Close, Open, High, Low, Heiken Ashi variants). Displays a colore
The Jurik Moving Average (JMA) is a sophisticated, adaptive moving average designed to reduce lag while maintaining smoothness. Unlike traditional moving averages (e.g., SMA, EMA), JMA adjusts dynamically to market volatility, making it more responsive to price changes. It’s particularly useful in trading for identifying trends and generating signals with less noise. Input Parameters : inpJmaPeriod (default: 14): The period for calculating the JMA and ATR. inpJmaPhase (default: 0): Controls the
Generates Buy/Sell Signals : Buy Signal : An upward arrow ( DRAW_ARROW ) appears when the JMA changes from a downtrend (red) to an uptrend (green). Sell Signal : A downward arrow ( DRAW_ARROW ) appears when the JMA changes from an uptrend (green) to a downtrend (red). Arrows are placed below (buy) or above (sell) the candle for visibility. Trend Following : Green Line : Indicates an uptrend. Consider holding or entering long positions. Crimson Line : Indicates a downtrend. Consider holding or en
Purpose : The SuperTrend indicator tracks price trends, plotting a line that follows the trend direction (up or down) and optionally fills the area between the trend line and the closing price Plots : SuperTrend Line : A colored line (green for uptrend, red for downtrend) plotted below the price in uptrends and above in downtrends. Filling : Optional filled area (bisque/pale green) between the SuperTrend line and the closing price, shown only if Show_Filling is true. Logic : Calculates ATR usin
Advanced Range Analyzer Pro – Smart Range Breakout & Probability Indicator Advanced Range Analyzer Pro is a powerful volatility-based range detection tool designed to identify high-probability consolidation zones before explosive breakouts occur. Using ATR, RSI, MACD, and volume-weighted price dynamics, this indicator automatically: Detects and draws clean, non-overlapping consolidation ranges Measures real-time Range Strength (compression & accumulation analysis) Calculates Bullish vs Bea
Smart Adaptive Renko Pro – Dynamic ATR & Fixed Box Renko Indicator Smart Adaptive Renko Pro is a powerful non-time-based Renko indicator designed to eliminate market noise and reveal true price momentum with precision. Unlike standard chart candles, this indicator builds Renko bricks based purely on price movement — helping traders focus on trend strength, reversals, and clean breakout structures. Key Features Adaptive ATR-Based Box Size (Auto-adjusts to market volatility) Fixed Pip Box M
FractalEA Pro — Smart Fractal Trading, Fully Automated FractalEA Pro turns Bill Williams' proven Fractal indicator into a complete, fully automated trading system. Every entry is confirmed by multiple filters — EMA trend direction, RSI momentum check, ATR volatility guard, and session timing — so the EA only trades when conditions genuinely align, not on every signal that appears. What makes FractalEA Pro stand out is the control it gives you. Every single feature has its own ON/OFF switch. Turn
Фильтр:
Нет отзывов
Ответ на отзыв