Pipwise EAs Smart Round Levels
- Indicadores
- Versão: 1.1
- Atualizado: 30 março 2025
- Ativações: 5

Upgrade your charts instantly.
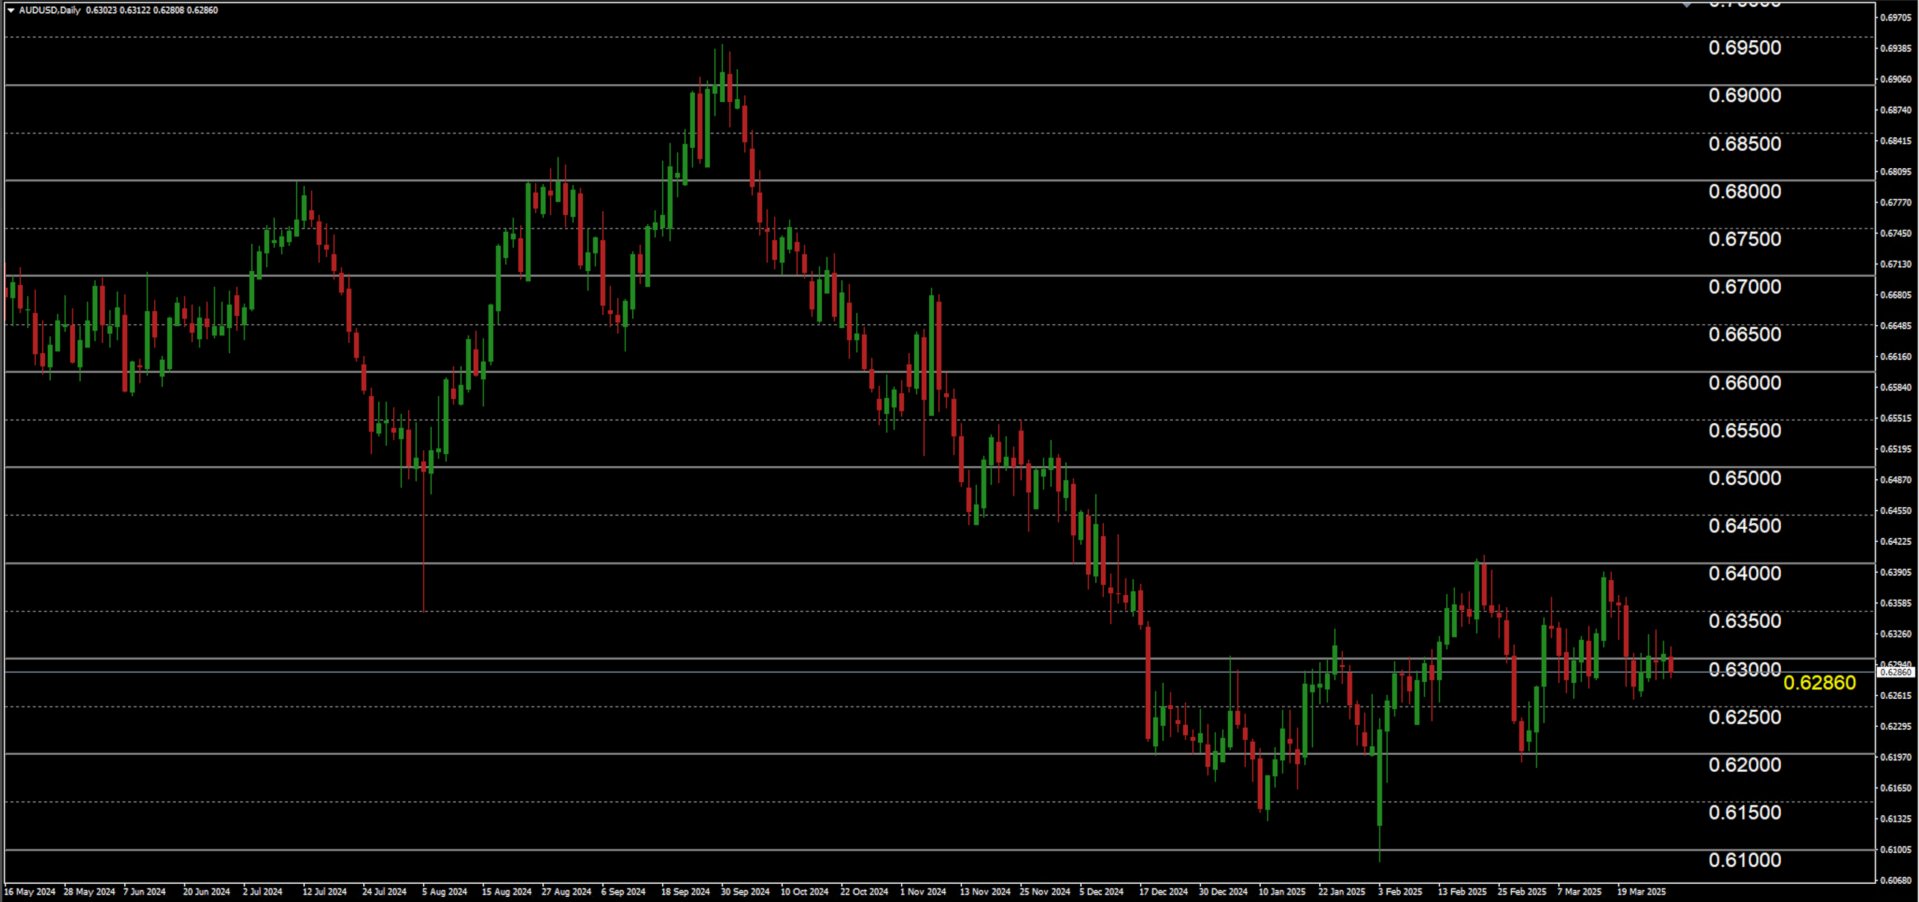
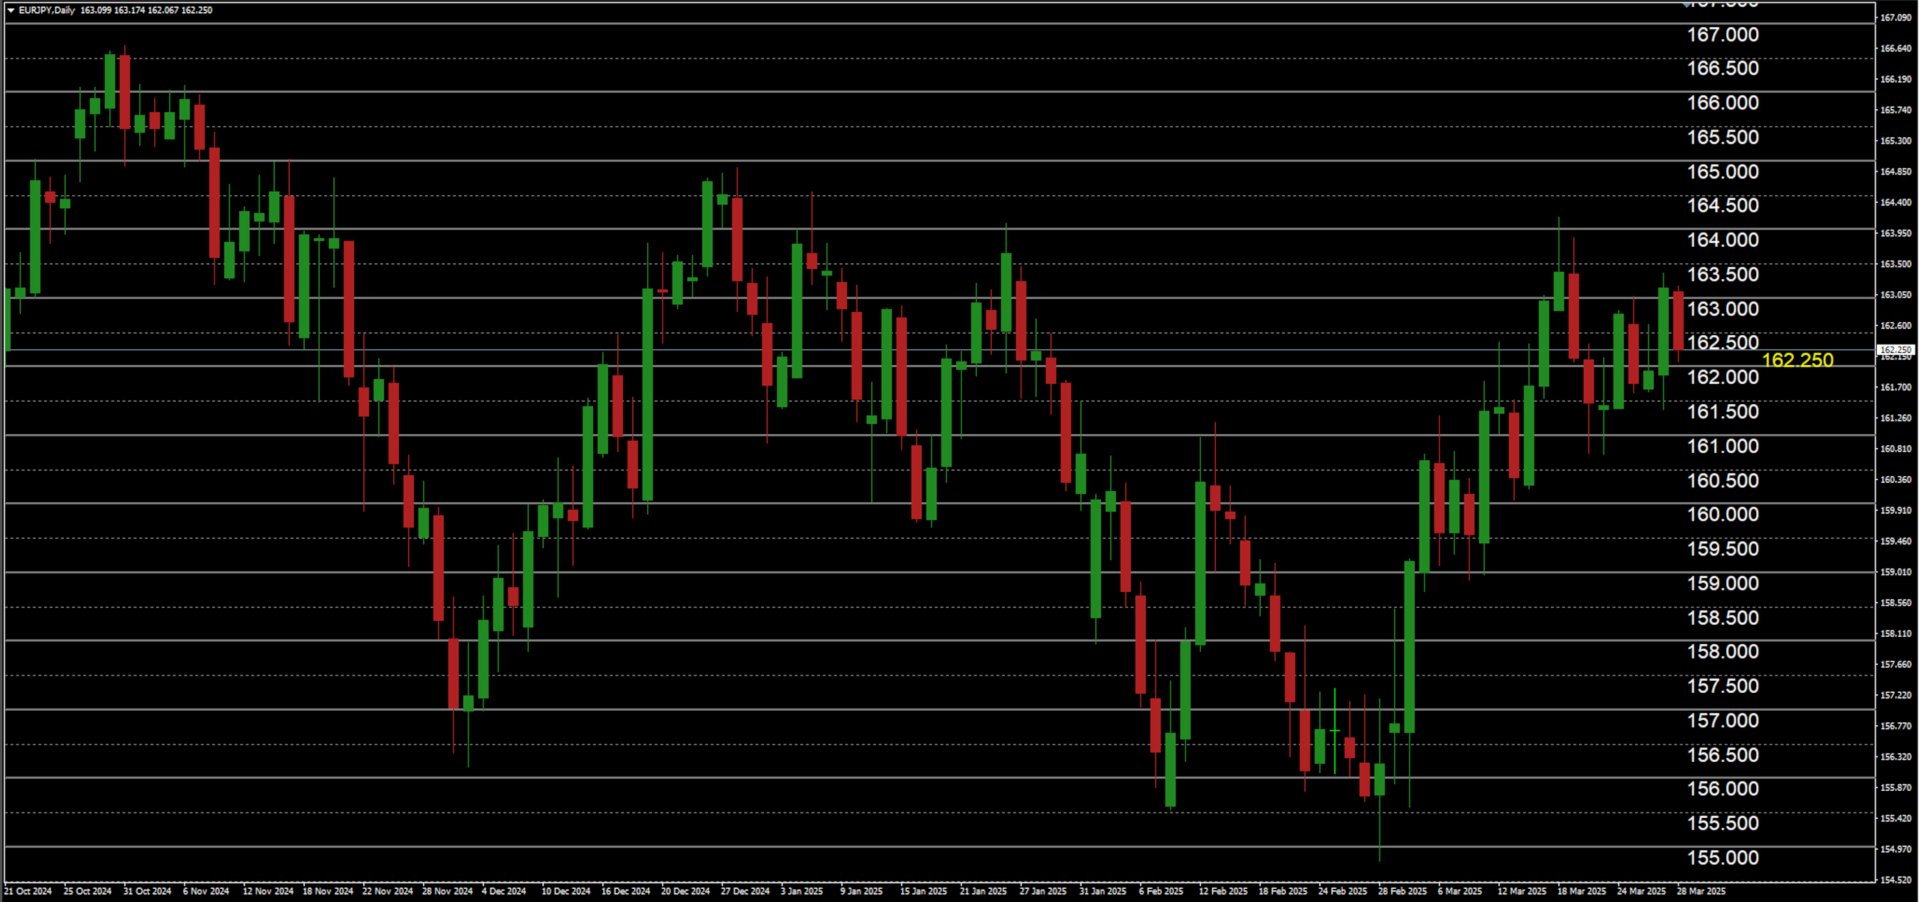
Smart Round Levels draws powerful .00 and .50 round-number zones automatically on any forex pair— including JPY pairs like USDJPY — and features a dynamic live price tracker that follows price in real time.
✅ Features:
•🔁Automatic round-number detection(.00 & .50)
•🔄Auto-adjusts for JPY and non-JPY pairs
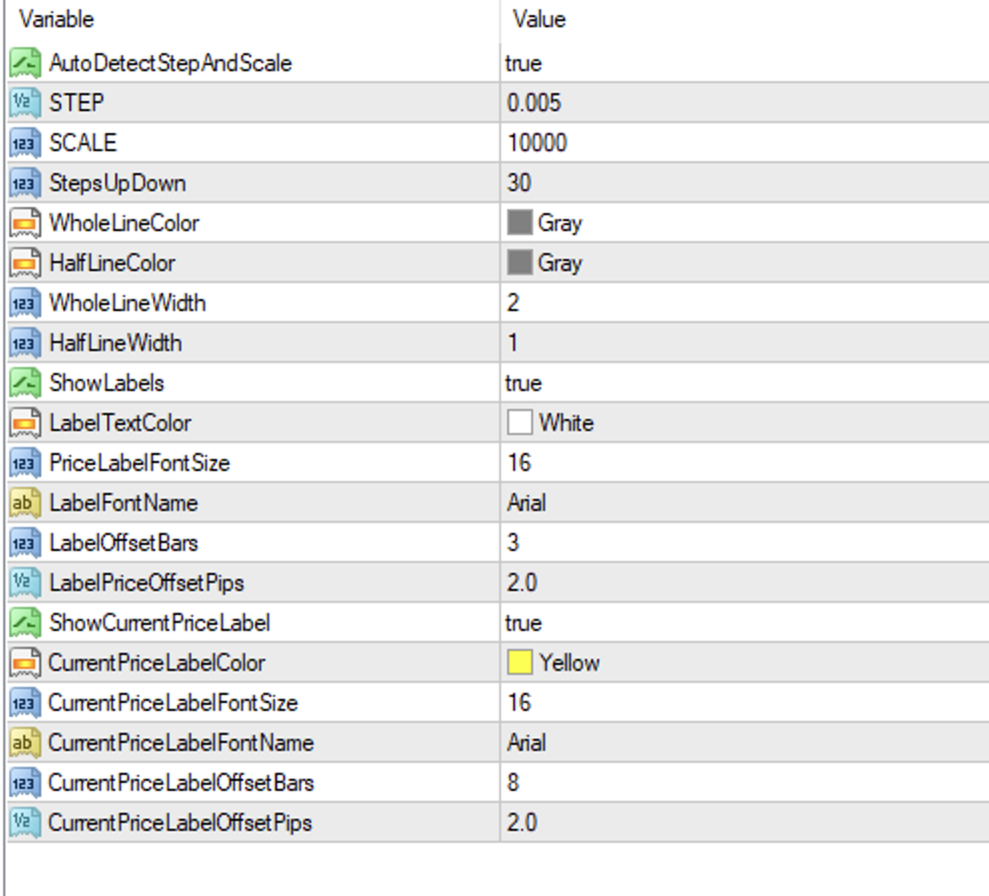
•🎯Perfect precisionwith customizable spacing & scale
•🎨Fully customizable colors, line widths, font sizes
•🟡Real-time yellow price labelthat moves with price
•📉Works on all timeframes
•📌Low CPU usage, ultra-lightweight
•🔒No DLLs, no externals — fully self-contained
⚙️ How It Works:
•Lines are placed every .005 for most pairs (e.g. 1.1000, 1.1050, 1.1100…)
•ForJPY pairs, spacing auto-switches to 0.5 (e.g. 132.00, 132.50, 133.00…)
•Each line is labeled on the right — .00 lines are solid. 50 lines are dotted
•A separate yellow label tracks live price, updating on every tick
💡 Use Cases:
•Mark psychological levels clearly
•Improve trade entries near round zones
•Spot rejection levels faster
•Stay visually aligned with market structure
📦 What’s Included:
•MQL4 file (compatible with MetaTrader 4)
•Clean, professional code
•One-time purchase —no subscriptions
💰 One-Time Price: $39 Unlimited Use