MetaTrader 5용 기술 지표 - 27
Rinse and Repeat indicator for 3 day/session/week setups. Check out our other products for fxer.net:
https://www.mql5.com/en/market/product/114888
https://www.mql5.com/en/market/product/114890
Indicator daily features: Daily close/high/low Weekly open/high/low/close Month open/high/low/close Daily breakouts Daily failed breakouts Asia/London/New York sessions Inside days Outside days Green days Red days
Indicator weekly features:
Weekly breakouts Week dividers Indicator other features: Das
FREE
The Channel Sgnals ProfRoboTrading Indicator for MT5 is an effective Forex trading tool designed to track market movements. The MT5 signal point indicator effectively detects trend reversals after they have already occurred. This Indicator is a fully automated technical tool that includes a number of parameters to track market trends. It automatically examines the ever-changing price dynamics of the market, compares the information with earlier data and generates a trading signal. Because
FREE
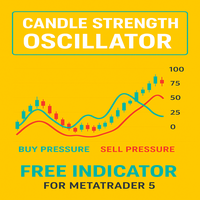
Candle Pressure Index (CPI) is a powerful yet easy-to-use indicator designed to reveal the hidden buying and selling pressure behind every candle. Instead of simply showing whether the price moved up or down, CPI digs deeper into how strongly buyers or sellers controlled the market within each candle. This makes it a unique tool for identifying trend strength, spotting reversals early, and confirming entry or exit points with higher accuracy.
Unlike traditional oscillators that only react to p
FREE
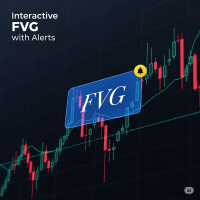
FVG Indicator with Alerts Description: This is a simple and effective indicator for identifying and displaying Fair Value Gaps (FVGs) on any timeframe. The indicator helps you see important price imbalances and provides powerful interactive tools for your analysis. Key Features: Detects FVGs: Clearly identifies and draws boxes around Bullish and Bearish Fair Value Gaps. Midline Level: Displays the 50% equilibrium level inside each FVG box, a critical point of interest. Complete Alert System: Rec
FREE

The indicator IQuantum shows trading signals for 10 symbols in the daily chart: AUDCAD, AUDUSD, EURUSD, GBPCAD, GBPCHF, GBPUSD, NZDUSD, USDCAD, USDCHF, and USDJPY.
Signals of the indicator are produced by 2 neural models which were trained independently from one another. The inputs for the neural models are normalised prices of the symbols, as well as prices of Gold, Silver and markers of the current day.
Each neural model was trained in 2 ways. The Ultimate mode is an overfitted neural model
FREE

Critical Market Session Information with a Single Glance Stop juggling multiple tools and squinting at time zone converters. The SessionInfoDisplay Indicator is your new, indispensable trading co-pilot that puts real-time market intelligence directly on your chart. What It Does: Your Essential Trading Dashboard This intelligent indicator provides three critical pieces of information at a glance: 1. Real-Time Session Detection - Automatically identifies which major financial session is act
FREE

이 지표는 볼린저 스타일의 변동성 채널에서 상단 밴드와 하단 밴드만 표시하며, 중앙 이동평균선은 표시하지 않습니다. 주요 목적은 깔끔하고 유연한 변동성 엔벨로프를 제공하여 트레이더가 채널 경계 대비 가격 움직임에 집중할 수 있도록 하면서, 차트의 시각적 구성과 미적 요소에 대한 완전한 제어를 유지하는 것입니다. 전통적인 볼린저 밴드와 달리, 이 지표는 이동평균선을 내부 계산에만 사용합니다. 중앙선은 시각적 혼잡을 줄이고 사용자가 필요에 따라 별도로 관리할 수 있도록 의도적으로 숨겨져 있습니다. 상단 및 하단 밴드는 각각 독립적인 색상 설정이 가능하여 시각적 구분이 명확해지고 다양한 차트 테마나 개인 취향에 더 잘 적응할 수 있습니다. 전통적인 볼린저 밴드 외형을 원하는 트레이더는 동일한 파라미터를 가진 이동평균 지표를 추가하여 쉽게 재현할 수 있습니다. 기간과 가격 소스를 일치시키면 표준 볼린저 구조를 효과적으로 복원할 수 있으며, 중앙선의 색상과 스타일도 완전히 제어할 수 있습니다
FREE

This indicator is based on Bollinger Bands and moving averages, and uses ADX to get the turning point of the market trend and display a sign.
It is basically intended for use with currency pairs and futures with high volatility. In our tests we use it on XAUUSD, 5m and 15m. Win rate is more than 80% with 50 pips stop loss and 50 pips gain or more.
The indicator is also a simple indicator that allows you to enable or disable alerts and change the color of the arrows from the indicator settings
FREE

Market State Dashboard : The Ultimate 6-in-1 Trading Dashboard Indicator for all markets .
Stop guessing the market direction . Start trading with confluence . Market State Dashboard Indicator is not just a signal indicator; it is a complete Decision Support System for serious traders. Most traders fail because they look at strategies in isolation . They buy because of an RSI cross, ignoring that the trend is down. They sell because of a trend line, ignoring that a reversal is building. Thi
FREE

1. Introduction The CM_Ultimate_RSI_MTF is a powerful and versatile custom indicator for MetaTrader 5, designed to enhance your Relative Strength Index (RSI) analysis. It provides multi-timeframe (MTF) capabilities, visual signals, and customizable alerts, making it an invaluable tool for traders seeking to identify overbought/oversold conditions, trend strength, and potential entry/exit points across various timeframes. 2. Key Features Multi-Timeframe (MTF) Analysis: Allows you to view RSI from
FREE

Stochastic Color Alerts – 스마트 모멘텀 및 컬러 트렌드 지표
Stochastic Color는 클래식 스토캐스틱 오실레이터의 고급 시각적 버전으로, 동적인 색상 변화와 지능형 알림 시스템을 통해 모멘텀 변화, 추세 방향 및 교차 신호를 보다 명확하게 식별할 수 있도록 설계되었습니다. 이 지표는 전통적인 %K 및 %D 로직과 색상이 변하는 메인 라인을 결합하여 숫자에만 의존하지 않고도 시장의 강도, 추세 변화 및 잠재적 반전 구간을 즉시 인식할 수 있습니다. Key Features
Dynamic Color Main Line (%K)
메인 스토캐스틱 라인은 모멘텀 방향에 따라 자동으로 색상이 변경됩니다:
초록색 → 상승 모멘텀
빨간색 → 하락 모멘텀
주황색 → 현재 형성 중인 캔들
이 시각적 시스템은 더 빠르고 자신감 있는 결정을 돕습니다. Classic Stochastic Calculation
전통적인 %K, %D 및 Slowing 파라미터 기반
모든 트레이딩 스타
FREE

[ How to use the Demo version ] [ MT4 Version ] AO unpaid divergences MT5 AO unpaid divergences is the first indicator developed to detailed analyze Regular and Hidden Divergences. It uses this analysis to find out possible entry points and targets. Below some of the characteristics of this indicator: Time saving Highly customizable Working for all pairs (Crypto, Forex, Stocks, Indices, Commodities...) Suitable for Scalping or Swing trading Possible reversal swings Alerts and Notifications on M
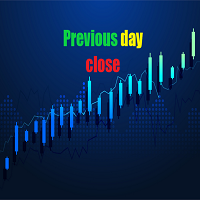
The indicator is a line right at yesterday's closing price. With the indicator, there is no need for adding or deleting previous day close lines each new day. T he line gives you an instant visual reference point for support, resistance, and market sentiment. Whether you are day trading or swing trading, this line helps you quickly gauge where the market closed last session and how current price action relates to that level. It works seamlessly across all timeframes - from 1-minute charts to d
FREE

This indicator draws regular bullish and bearish divergences in real-time onto the charts. The algorithm to detect those divergences is based on my 10+ years experience of detecting divergences visually. The divergences are drawn as green and red rectangles on the charts. You can even do forward testing in the visual mode of the strategy tester. This FREE Version is restricted to EURUSD and GBPUSD. The full version without restrictions is here: https://www.mql5.com/en/market/product/42758
Para
FREE
FOTSI – 외환 진정 강도 지수 개요 각 통화의 진정한 강도를 발견하고 우위를 가지고 거래하세요. FOTSI 지표 는 모든 주요 통화(USD, EUR, GBP, JPY, CHF, AUD, CAD, NZD)의 실제 모멘텀을 모든 통화쌍에서 측정하는 다중 통화 오실레이터 입니다. 단일 차트를 분석하는 대신, FOTSI는 여러 통화쌍의 데이터를 결합하고 움직임을 평활화하며, True Strength Index (TSI) 알고리즘을 적용하여 각 통화의 상대적 강도를 명확하고 안정적이며 지연 없이 제공합니다. 주요 특징 다중 통화 오실레이터: 각 통화의 강도를 독립적으로 측정합니다. 과매수 및 과매도 수준: +50 → 통화 과매수 (조정 확률 높음). –50 → 통화 과매도. ±25 → 중립 영역. 간단한 해석: 0 이상/이하 곡선 = 강도/약점. 리페인트 없음: 모든 계산은 실시간으로 수행되며 안정적입니다. 모든 통화쌍과 시간 프레임에서 호환: 신뢰성을 위해 H1, H4, D1 권장.

Version 1.5: manual color change added
This indicator helps to trade price action and momentum strategies like Guerrilla Trading or similar strategies.
The indicator displays: most recent highs and lows number of consecutive breaks past breaks of most recent highs and lows retest lines flag formations manual color change User can change colors. Go to Indictor Properties/Input, set "Auto Color" to false and change the colors. Set "Auto color" back to true to go back to pre-set colors. Please wa
FREE

This Quarter Levels Indicator for MQL5 is a sophisticated technical analysis tool designed to capitalize on "Psychological Levels" or "Round Numbers" in financial markets. It operates on the principle that institutional order flow, stop-losses, and take-profit targets tend to cluster at specific mathematical intervals—specifically the whole numbers ( 00 ), midpoints ( 50 ), and quarter points ( 25 and 75 ). By dividing price action into these four distinct quadrants, the indicator provides a cle
FREE

RITZ Candle Kaufman’s AMA is a precision market-flow indicator built around Kaufman’s Adaptive Moving Average (KAMA / AMA) — a dynamic smoothing algorithm that automatically adjusts to changing volatility.
This enhanced version interprets AMA momentum directly into smart candle-color signals , giving traders a clean, noise-filtered view of trend strength and directional bias. Where most indicators repaint or react too slowly, RITZ Candle AMA delivers stable, non-repainting color shifts based on
FREE

The indicator is designed for building horizontal channels and signal zones, detecting breakouts of extremes, bounces and targets based on custom Fibonacci levels (with or without sound alerts). It automatically applies your chosen Fibonacci levels to those extremes. When price breaks the Fibonacci levels enabled in the settings, the indicator can play a sound, show a message, send a push notification to your mobile terminal or an email (if enabled). Features:
automatic channel building by time

Hull Moving Average is more sensitive to the current price activity than a traditional Moving Average. It faster responds to trend change and more shows the price movement more accurately. This is a color version of the indicator. This indicator has been developed based in the original version created by Sergey <wizardserg@mail.ru>. Suitable for all timeframes.
Parameters Period - smoothing period, recommended values are 9 to 64. The larger the period, the softer the light. Method - smoothing m
FREE

Price Volume Distribution
가격 수준별 거래량 분포를 분석하는 Volume Profile 지표. MT5용 POC, Value Area, 거래량 급등 및 존 기반 신호 필터링을 표시합니다.
개요
Price Volume Distribution은 MetaTrader 5용 거래량 분석 지표입니다. M1 타임프레임 데이터를 사용하여 가격 수준별 거래량 분포를 계산하고 표시하며, 히스토그램 바와 참조선을 통해 시각적 표현을 제공합니다. 시스템 이해를 위한 사용자 가이드 | 기타 언어 사용자 가이드 주요 기능
지표가 식별하는 항목: - Point of Control (POC): 가장 높은 거래량의 가격 수준 - Value Area High/Low (VAH/VAL): 거래량의 70%를 포함하는 가격 범위 - 거래량 급등: 비정상적으로 높은 활동의 가격 수준 - 거래량 집중에 기반한 지지 및 저항 존
프로파일 모드
세 가지 계산 모드 제공:
1. 세션 모드:

Purpose and functions of the indicator The indicator determines and marks the moments of trend change on the chart based on the theory of fractal levels breakout on any of the analyzed timeframes. If a breakout based on all rules is valid, a horizontal line with corresponding color will appear on the chart. If there is an uptrend, the line will be blue. In the descending trend, the line will be red. The blue line is a strong support level, the trader should look for buying opportunities above th
FREE

Chronolines – Temporal Support and Resistance Levels for MetaTrader 5 Introduction to Chronolines
Chronolines is a graphical indicator designed to identify and visualize temporal support and resistance levels using the Highs and Lows of four predefined periods. It is compatible with all assets available on MetaTrader 5 , including stocks, currencies, commodities, indices, and cryptocurrencies, offering a logical and structured approach to tracking market behavior. Lines and Periods
Chronolines
FREE
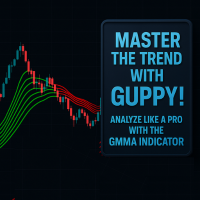
This is a custom Guppy-style Moving Average indicator built for MetaTrader 5 (MT5), designed to replicate the appearance and logic of the popular TradingView version. Unlike the built-in tools in MT5, this indicator offers a simplified yet powerful approach by using only 6 Exponential Moving Averages (EMAs). It provides clean visualization and accurate market layering to help traders make better decisions. Features
TradingView-Style Guppy Logic – Displays 6 EMAs for combined short- and medium-
FREE

The POC_Levels indicator calculates and displays the 3 most frequently occurring price levels (Points of Control – POC) based on historical candles. It is useful for identifying areas of high market interest (like support/resistance zones) across any timeframe. How It Works
The indicator analyzes the last LookbackBars candles. It counts how many times each price level (based on the selected price type) appears. Then it selects the top 3 most frequent prices and draws horizontal lines at those l
FREE
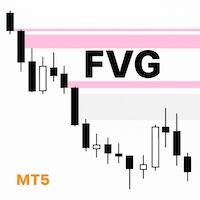
What Makes UTurn FVG indicator Unique I’m a trader, and I built a simple and clean FVG indicator that focuses on what traders actually need. Flexible color and transparency settings. The option to extend unmitigated and partially mitigated FVGs to the current price. Automatic removal of fully mitigated FVGs. Clear visual confirmation when an FVG has already been tested. A clean, professional look that helps traders make faster, more confident decisions. Overview UTurn FVG is a clean, efficient,
FREE

Introducing the Professional Arka STM Signal Indicator
With Arka Candle Close Time – 100% Free Version Fast, Accurate, and Unmatched in Identifying Trading Opportunities
This indicator is the result of combining advanced price action analysis with specialized market algorithms, delivering clear, timely, and profitable signals. Completely Free – No Installation or Usage Limits
️ An automated trading bot, fully synchronized with it, is also ready to run. The Power of ARKA STM Signa
FREE

Simple indicator to calculate fibonacci retracement levels on time. Add to chart and move trend line to set the fibonacci retracement levels. Inputs Levels - levels for which to calculate values, separated by space, default are fibonacci levels Show time - if true, time will be shown on levels Show date - if true, date will be shown on levels Show fibonacci level - if true, value of levels will be shown Fibonacci lines color - color of levels Trend line color - color of trend line which de
FREE

ATR Plus is an enhanced version of the classic ATR that shows not just volatility itself, but the directional energy of the market .
The indicator converts ATR into a normalized oscillator (0–100), allowing you to clearly see: who dominates the market — buyers or sellers when a trend begins when a trend loses strength when the market shifts into a range where volatility reaches exhaustion zones ATR Plus is perfect for momentum, trend-following, breakout and volatility-based systems. How ATR Plus
FREE

This indicator is based on Mr. Mark Fisher's ACD strategy, based on the book "The Logical Trader."
- OR lines - A lines - C lines - Daily pivot range - N days pivot range - Customizable trading session - Drawing OR with the desired time Drawing levels A and C based on daily ATR or constant number - Possibility to display daily and last day pivots in color zone - Displaying the status of daily PMAs (layer 4) in the corner of the chart - Show the order of daily pivot placement with multi-day piv
FREE
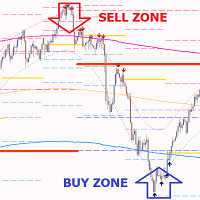
Gold PL MTF - 훌륭한 주식 기술 지표입니다. 지표 알고리즘은 자산 가격의 움직임을 분석하고 피보나치 방법(황금 분할)을 사용하여 지정된 기간(TF)의 중요한 피벗 레벨을 자동으로 반영합니다.
이 지표는 선택한 기간(일, 주, 월, 년)의 가격 궤적을 완벽하게 설명하고 추세의 시작과 반대 추세로 발전할 수 있는 수정의 시작을 결정합니다.
이 지표는 또한 가격 자석 역할을 하는 다양한 기간의 현재 미처리 피벗 레벨을 보여줍니다. 이를 통해 시장 상황을 빠르게 평가하고 거래에 참여하거나 종료할지 결정할 수 있습니다. 각 거래의 잠재력은 평균 50~1000포인트입니다.
이 지표를 사용하면 다양한 기간에서 가격 움직임의 가능한 방향을 평가할 수 있으며 가장 가능성 있는 목표와 가격 움직임의 잠재력도 보여줍니다.
이 지표의 이점: 1. 이 지표는 높은 정확도로 신호를 생성합니다. 2. 피벗 레벨은 사라지지 않고 다시 그려지지 않습니다. FP 버퍼의 확인된 화살표 신호는 추세

MT5용 Body Ratio Indicator – 캔들 강도 및 범위 압축 분석기 Body Ratio Indicator는 캔들의 구조를 분석하여, 캔들 몸통(시가–종가)과 전체 범위(고가–저가)의 비율을 기준으로 시장의 방향성, 불확실성 또는 범위 압축 상태를 식별하는 기술적 도구입니다.
이 간단하면서도 강력한 계산은 트레이더가 강한 모멘텀 캔들 , 우유부단한 캔들(Doji, 스피닝탑) , 폭발적 움직임 전의 압축 구간 을 식별하는 데 도움을 줍니다. 캔들은 실시간으로 세 가지 범주로 분류됩니다: 약한 캔들 (몸통이 전체 범위의 30% 미만): 불확실한 장 , 저거래량 세션 , 또는 Doji , Spinning Top 과 같은 우유부단한 패턴에 자주 나타납니다 중립 캔들 (몸통이 30~70%): 횡보장 , 범위 압축 , 변동성 수축 또는 NR4 , NR7 , 인사이드 바 와 같은 패턴에서 자주 발생합니다 강한 캔들 (몸통이 70% 이상): 강한 방향성 과 추세 지속 가능성이 높으며
FREE

CustomRSI50 - 50 레벨 맞춤형 RSI 지표 설명 CustomRSI50은 인기 있는 상대강도지수(RSI)를 기반으로 한 맞춤형 기술 지표입니다. 이 지표는 많은 트레이더들이 모멘텀 분석에서 중요하게 여기는 50 레벨에 특별히 초점을 맞춰 RSI의 명확하고 사용자 정의 가능한 시각화를 제공합니다. 주요 특징 구성 가능한 RSI 기간 강조된 50 레벨 참조선 사용자 정의 가능한 적용 가격 유형 별도 창에서 표시 쉬운 해석을 위한 0에서 100까지의 고정 스케일 사용자 정의 가능한 매개변수 RSI_Period: RSI 계산을 위한 기간을 설정할 수 있습니다 (기본값: 14) applied_price: 계산에 사용할 가격 유형을 선택할 수 있습니다 (기본값: 종가) CustomRSI50 사용 방법 MetaTrader 5의 아무 차트에나 지표를 적용하세요. RSI 기간과 가격 유형을 선호에 따라 사용자 정의하세요. 50 레벨에 대한 RSI의 움직임을 관찰하세요: 50 이상의 값은
FREE

BarTimer v1.0 | Visualización Dinámica de Tiempo para MT5 BarTimer v1.0 es un indicador de alta precisión diseñado para traders que buscan gestionar el tiempo de cierre de sus velas sin saturar su espacio de trabajo. A diferencia de los contadores numéricos tradicionales, utiliza una barra de progreso visual que permite interpretar el ciclo del mercado de un solo vistazo. BarTimer v1.0 "La gestión del tiempo es tan crítica como la gestión del riesgo. BarTimer transforma un dato abstracto en una
FREE

추세,추세지표,모멘텀,오실레이터,히스토그램,추세강도,시장흐름,추세확인,강세,약세,기술적분석
Trend Flow Oscillator
Trend Flow Oscillator는 시장의 흐름과 모멘텀을 분석하여
가격 움직임의 방향과 강도 를 명확하고 직관적으로 파악할 수 있도록 설계된 지표입니다.
특히 5분 차트(M5) 에서 효과적입니다.
기능 매수·매도 흐름의 변화 및 지속성 식별 가격 움직임의 가속과 감속 표시 추세 방향 진입 확인에 도움 분리된 히스토그램으로 흐름 표시 방향성 모멘텀 오실레이터로 작동 대상 재량 트레이더 스캘퍼 및 데이 트레이더(M5 권장) 자동 신호가 아닌 흐름 확인을 원하는 트레이더 추세 및 눌림목 트레이더 깔끔하고 객관적인 지표를 선호하는 사용자 ️ 사용 방법 M5 차트에서 사용 권장 히스토그램 확인: 파란 막대 → 매수 흐름 강화 빨간 막대 → 매도 흐름 강화 막대가 클수록 모멘텀 강함 활용 목적: 추세 방향
FREE
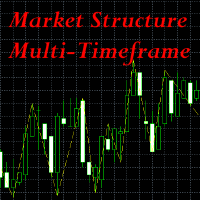
This indicator is extremely useful for traders who want to keep an eye on the market structure without wasting time drawing it manually. It also adds an important optional feature, which is MTF (Multi-Timeframe) analysis . Multi-Timeframe (MTF) analysis is a trading technique that consists of analysing the same financial instrument on different time intervals (charts) simultaneously, in order to gain a more complete view of the market. Starting with the analysis of higher timeframe charts to i
FREE

MT5에 대한 경고가 있는 자동 고정 범위 볼륨 프로필
이 지표는 가격이 더 많은 시간을 소비한 위치를 보여주고 거래에 사용할 수 있는 중요한 수준을 강조합니다.
그리고 주어진 거래 세션의 가장 중요한 가격 수준, 가치 영역 및 제어 가치를 요약하여 시간 경과에 따른 가격 밀도를 보여줄 수 있습니다. 이 표시기는 M1과 D1 사이의 기간에 첨부할 수 있으며 일일, 주간, 월간 또는 일중 세션에 대한 시장 프로필을 표시합니다. 더 낮은 기간은 더 높은 정밀도를 제공합니다. 더 나은 가시성을 위해 더 높은 기간이 권장됩니다. 프리 드로우 사각형 세션을 사용하여 임의의 시간대에 맞춤형 시장 프로필을 생성하는 것도 가능합니다. 프로필의 블록을 그리는 데 6가지 색 구성표를 사용할 수 있습니다. 일반 색상 히스토그램으로 프로필을 그리는 것도 가능합니다. 또는 강세/약세 막대를 기반으로 프로필 색상을 선택할 수 있습니다. 이 지표는 베어 프라이스 액션을 기반으로 하며 표준 지표를 사용하지

Introduction
The RSI Plus is an innovative technical analysis tool designed to measure the strength and direction of the market trend. Unlike the traditional RSI indicator, the RSI Plus boasts a distinctive ability to adapt and respond to market volatility, while still minimizing the effects of minor, short-term market fluctuations.
Signal
Buy when the RSI plus has been in the oversold (red) zone some time and it crosses above the 20 level on previous candle close
Sell when the RSI plus ha
FREE
This indicator is a sophisticated MetaTrader 5 tool that calculates and displays Average Daily Range (ADR) levels on your chart. It draws horizontal lines representing expected price movement ranges based on historical daily volatility, helping traders identify potential daily high and low targets. ADR (Average Daily Range) = The average difference between the daily high and low over a specified period (default: 14 days). Unlike ATR which includes gaps between days, ADR focuses purely on int
FREE
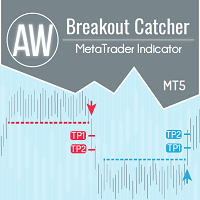
가격 수준 분석, 고급 통계, TakeProfit 계산 및 3가지 유형의 알림. 이익: 결과를 다시 그리지 마십시오 촛불이 닫힐 때 엄격하게 신호를 보냅니다. 거짓 고장 필터링 알고리즘 어떤 트렌드 전략과도 잘 어울립니다. 모든 도구 및 시계열에서 작동 매뉴얼 및 지침 -> HERE / 문제 해결 -> HERE / MT4 버전 -> HERE 지표로 거래하는 방법 AW Breakout Catcher와 거래하는 간단한 3단계: 1단계 - 포지션 열기 70% 이상의 성공률로 매수 신호를 받았습니다. 2단계 - StopLoss 결정 반대 신호로 트렁크 선택 3단계 - 이익 실현 전략 정의 전략 1: TP1 도달 시 전체 포지션 청산 전략 2: TP1 도달 시 포지션의 50% 청산 및 TP2 도달 시 나머지 50% 청산 전략 3: 반대 신호에서 전체 포지션 청산 통계 모듈 더 나은 쌍 선택을 위해 내장된 통계 계산을 사용하십시오. 거래 계산 - 통계가 제공되는 총 신호 수

Description (English): Trend Test by Subho – Advanced Trend & Step Channel System Trend Test by Subho is a powerful all-in-one trend trading system designed to filter noise and provide clear market direction. This indicator combines two sophisticated algorithms: the Trend Test () and the Subho Step Channel into a single chart overlay. It also features a stylish Live Dashboard that alerts you to the current trend status in real-time. Key Features: Trend Test () Logic: An advanced tr
FREE
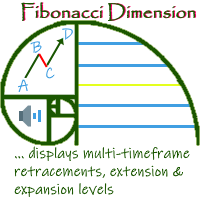
'Fibonacci Dimension' indicator allows display of preset or user-defined multi-timeframe Fibonacci levels. It automatically takes the previous high and low for two user-defined timeframes and calculates their Fibonacci retracement levels. It also considers the retraced level to draw the expansions on every change of price. A complete visual dimension in multiple timeframes allows deriving profitable strategies for execution. Enhanced functionality to view and customize the default Fibonacci Rang
FREE

The indicator My Big Bars can show bars (candles) of a higher timeframe. If you open an H1 (1 hour) chart, the indicator puts underneath a chart of H3, H4, H6 and so on. The following higher timeframes can be applied: M3, M5, M10, M15, M30, H1, H3, H4, H6, H8, H12, D1, W1 and MN. The indicator chooses only those higher timeframes which are multiple of the current timeframe. If you open an M2 chart (2 minutes), the higher timeframes exclude M3, M5 and M15. There are 2 handy buttons in the lower r
FREE

Market Sessionsync** is a cutting-edge trading session indicator designed to enhance your trading experience by visually breaking down the market's daily rhythm. With a compact window overlaid on your chart, this indicator provides a split-second understanding of the current trading session through: Basic setup: Set Difference between your local time and your broker time , set DST(Daylight Saving Time) ON or OFF , set timescale sync you want to use (Local, Broker, CET) - A vertical time marker
FREE
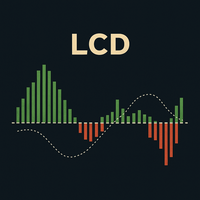
LCD 라게르 컨버전스 다이버전스: 클래식 MACD의 고급 개선 버전 **LCD 라게르 컨버전스 다이버전스(Laguerre Convergence Divergence)**는 클래식 MACD를 개선하기 위해 설계된 고급 기술 지표로, 더 빠르고, 더 민감하며, 적응력이 뛰어난 모멘텀 감지를 제공합니다. 이 지표의 주요 장점은 전통적인 이동 평균보다 가격 변화에 더 정확하게 반응하는 라게르 필터 를 사용한다는 점입니다. 주요 이점 향상된 민감도와 낮은 지연: 라게르 필터는 변동성이 큰 시장에서 중요한, 더 빠른 진입 및 청산 신호를 생성합니다. 변동성에 대한 적응성: **ATR(Average True Range, 평균 참 범위)**에 따라 동적으로 조정되며, 낮은 변동성 시에는 노이즈를 필터링하고 높은 변동성 시에는 빠르게 반응합니다. 개선된 노이즈 필터링: 허위 신호를 줄이기 위해 **결정 영역(Decision Zone)**과 추가적인 스무딩(히스토그램의 EMA)을 포함합니다. 선택적
FREE

SessionRange-MT5-Ind is an indicator for MetaTrader 5 that builds a High/Low/Middle channel based on the given trading session. Indicator : Defines the session range - builds a channel based on a given high/low window Draws three lines : SessionTop (blue) — maximum session SessionMiddle (grey) — channel center SessionBottom (orange) — minumum session Session mode (Mode) : `Previous Day` — for classical PDH/PDL (previous day range) `Current Day` — to display the current day’s session
FREE

Bollinger bands out/in strategy A strategy created by Joe Ross, and very useful for finding trades when the market is overloaded. Indicator You don't need to find where there are entries on the chart, this indicator shows them for you. The entrance The trade is confirmed when the price closes outside the bollinger bands on a candle and the candle after the price closes inside the bands. comment I want to improve this indicator, so you can help me sending me your reviews and comments, thanks :).
FREE
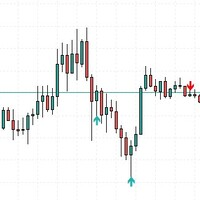
This indicator was creating a perfect structure to not re-paint or recalculate, all signals are accurate. I can create a robotic version of this indicator but I need more precision in the signals. So appreciate this work.
Tips to use when trading, do not buy at the top or sell at the bottom, always buy at the bottom and sell at the top. Risk 1 to 3.
In the settings you can adjust the size of the shadow or trail of the candle, you can change the colors and sizes of the arrows.
FREE

INTRODUCTION : The breakout strength meter is a trading tool that is used to identify which currencies are the strongest to breakout, and which currencies are the weakest to breakout. The settings for the indicator are easy, and if you cannot find the settings, please leave a comment The tools are completely free to use Please, if you like the indicator, please leave a comment and rate the indicator in order to develop it
FREE

The daily custom period seperator indicator allows you to draw period seperators for your lower time frame charts H1 and below. The period seperator gives you options to set different colors for: Weekend - saturday/sunday Monday and Friday Midweek - Tuesday to Thursday.
By default the indicator plots the period seperator line at 00:00 hours for the last 10 days.
Use Cases: The indicator can be used as a colourful alternative period seperator to the default MT5 period seperator. For those tha
FREE
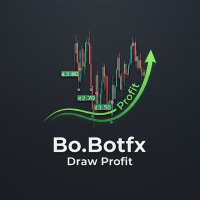
Tired of sifting through your account history to track closed trade profits? The Draw Profit indicator by Bo.Botfx is here to revolutionize how you visualize your trading performance! This intuitive and powerful indicator automatically draws the profit (or loss) of your closed orders directly onto your chart . No more guessing or tedious calculations – with Draw Profit, you can instantly see the exact outcome of each trade right where it happened. Key Features: Visual Profit Tracking: Clearly di
FREE
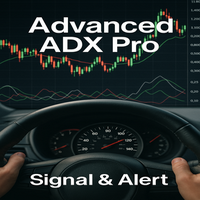
Advanced ADX Pro: ADX 분석을 한 단계 더 높이세요 Advanced ADX Pro 는 전통적인 평균 방향성 지수 (ADX) 지표 사용 경험을 변화시키기 위해 설계된 고급 트레이딩 도구입니다. 이 지표는 더 큰 편의성, 제어력, 시각 및 청각적 명확성 을 제공하기 위해 만들어졌으며, MetaTrader 5 (MT5) 기본 ADX의 기능을 훨씬 뛰어넘습니다. ADX란 무엇이며 왜 중요한가요? ADX는 시장 추세의 강도 를 측정하는 중요한 기술 지표입니다. 세 가지 주요 선으로 구성됩니다. ADX (파란색 선): 추세의 강도를 나타냅니다. 값이 증가하면 강한 추세 를 나타내고, 감소하면 약세 또는 횡보를 나타냅니다 . +DI (녹색 선): 상승 움직임의 강도를 측정합니다 . -DI (빨간색 선): 하락 움직임의 강도를 측정합니다 . 이러한 선들의 조합을 통해 트레이더는 시장이 추세에 있는지, 그리고 어느 방향으로 더 강하게 움직이는지 식별할 수 있습니다. MT5 기
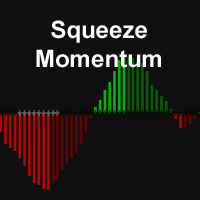
The Squeeze Momentum Indicator, identifies periods of low volatility ("squeeze") when Bollinger Bands are inside the Keltner Channel, marked by black crosses on the midline. This suggests the market is preparing for a significant move.
Gray crosses indicate a "squeeze release," signaling potential breakout. To use it, wait for the first gray cross after a black cross, then enter a trade in the direction of momentum (long if above zero, short if below). Exit when momentum shifts (color change i
FREE

Breakeven and Swaps Dashboard Breakeven and Swaps Dashboard is a lightweight on-chart dashboard for MetaTrader 5 that summarises your open positions on the current symbol and draws two breakeven levels per side: Breakeven (price only) – ignores swaps Breakeven (including swaps) – adjusts the breakeven level using accumulated swaps It is designed for traders running baskets, grids or multi-entry positions who want a quick, readable view of where the book truly breaks even. What it shows For Buy ,
FREE
FULL VERSION https://www.mql5.com/en/market/product/145203?source=Site https://www.mql5.com/en/users/gedeegi/seller
GEN TurboTrend Signals is an adaptive volatility-based trend indicator designed to help traders identify dominant trend directions, key momentum transition points, and projected profit-taking zones in a visual and intuitive manner. The indicator utilizes a temporally-weighted moving average combined with statistical dispersion via standard deviation to construct a dynamic volati
FREE

Channels indicator does not repaint as its based on projecting the falling and raising channels. As a trader you need a path to be able to place your buy and sell trades such as: Supply and Demand , Falling & raising channels. Falling and raising channels can be in any time frame and also can be in all time frames at the same time and the price always flows within these channels. Experienced trades will draw the key levels and channels around the time frames. But, they will not be able to draw
FREE

Description : Rainbow MT5 is a technical indicator based on Moving Average with period 34 and very easy to use. When price crosses above MA and MA changes color to green, then this is a signal to buy. When price crosses below MA and MA changes color to red, then this is a signal to sell. The Expert advisor ( Rainbow EA MT5 ) based on Rainbow MT5 indicator is now available here .
MT4 version is available here .
FREE
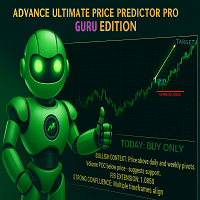
THE ADVANCE PRICE PREDICTOR - GURU EDITION Tired of Guesswork?
Meet the AI-Powered "Almighty Predictor" – Pinpoints High-Probability Targets Before the Move, With Surgical Precision
Stop chasing pips. Start attracting them. Our proprietary algorithm fuses Multi-Timeframe Analysis + Smart Money Concepts + Real-Time Confluence Scoring to give you a clear, calculated edge on every trade.
Are You Constantly Wondering…
"Is this the top, or will it keep going?"
"Where should I real
FREE

Asia Range STDV I ndicator
This Indicator is designed not only to identify the Asia session trading range and Standard Deviation levels but also to assist traders in creating a systematic entry and exit strategy based on the higher timeframe daily trend . The indicator supports both bullish and bearish scenarios, allowing traders to focus on key moments when the Asia range's high or low is "swept" (broken) in line with the confirmed trend. Strategy Overview: 1. Confirming the Daily Trend (Bul
FREE

PipVenom - Advanced ATR Trailing Stop Signal Indicator for MT5 Professional Visual Trading System with Real-Time Dashboard OVERVIEW PipVenom is a sophisticated visual trading indicator designed for MT5 that combines ATR Trailing Stop methodology with EMA crossover signals to identify high-probability trade entries. Built with precision and clarity in mind, this indicator provides crystal-clear visual signals with automatic Stop Loss and Take Profit levels displayed directly on your chart. P
FREE

Introducing the AI Keltner Channel , a cutting-edge Forex indicator that leverages machine learning to dynamically calculate Keltner Channels in real-time. Unlike traditional Keltner Channel indicators, which rely on static inputs, the AI Keltner Channel adapts continuously to ever-changing market conditions, providing traders with a more accurate and responsive view of price trends and volatility. Powered by advanced machine learning algorithms, the AI Keltner Channel analyzes historical and re
FREE

Trendy Stock is a price following indicator that uses Stochastic to show when the price is out of the oversold or overbought areas. The algorithm allows you to stay longer in a trend where the bulls or bears are in control. The indicator changes color immediately the price exits oversold/overbought state. In short, the downtrend [red] bars start to paint when the buying pressure decreases while the uptrend [green] bars form as the buy pressure kicks in. For MT4 version, follow :: https://www
FREE

The initial balance (IB) is a range in which the price spent its first two OPT periods after the opening. In other words, the opening balance is a range of the first hour after the market opened. The opening balance arose from room trading, as room traders observed the various ranges after the market opened.
This indicator allows you to enter the starting and ending hours and minutes of a specific hourly time range so that the trader can set up different IBs according to the market.
Automatic
FREE

If you like this project, leave a 5 star review. Often times we are using brokers that are outside of the GMT-0 timezone, this
not only complicates things, but, it can make seeing when a trading session starts
a bit more difficult than it should. This indicator allows you to set a timezone offset it will draw a vertical line for the: Day. Week. Month. Quarter. year.
FREE

Wyckoff fans, enjoy!
Ideally to be used with the Weis Waves indicator, but it can be easily used alone, the Waves Sizer puts the range (in resulting Price movement) done by the Price on its market swings. You can control how accurate or loose will be the swings. This tool is very helpful for visually know how much the Price has traveled in your Timeframe. This way you can confront this level of effort with the resulting Volume, etc... Weis Waves indicator:
https://www.mql5.com/en/market/produc
FREE

This indicator searches for candlestick patterns. Its operation principle is based on Candlestick Charting Explained: Timeless Techniques for Trading Stocks and Futures by Gregory L. Morris. If a pattern is detected, the indicator displays a message at a bar closure. If you trade using the MetaTrader 4 terminal, then you can download the full analogue of the " Candle Pattern Finder for MT4 " indicator
It recognizes the following patterns: Bullish/Bearish (possible settings in brackets) : Hammer

Price and Spread Indicator
Version: 1.0 Developer: Creative Tech Solutions Website: https://www.creativetechsolutions.co.uk
Overview The Price and Spread Indicator is a great tool for MetaTrader 5 that displays the Ask and Bid prices along with the spread directly on the chart. This indicator provides real-time updates and allows traders to make informed decisions based on accurate price information.
Features - Real-time Price Updates: Continuously updates Ask and Bid prices. - Spread Disp
FREE
Hi Traders, The Volume Spike Alert Indicator is a lightweight, non-lagging tool designed to help traders identify unusual volume activity in real time . This indicator calculates the average tick volume over a user-defined number of previous bars and compares it with the current candle’s volume . When the current volume exceeds the average by a specified percentage, the indicator triggers alerts, allowing traders to quickly spot potential breakouts, institutional activity, or strong market inter
FREE
Scalper Pro – XAUUSD, EURUSD 및 JPY 스캘핑 고급 지표 (M1/M5/M15) | 거래량 스파이크 + 시장 구조 돌파 더 똑똑하게, 더 빠르게, Scalper Pro와 함께 거래하세요. Scalper Pro는 MetaTrader 5용 고성능 스캘핑 지표 로, XAUUSD 골드 스캘핑, EURUSD 데이 트레이딩, JPY 돌파 전략 에 특화된 전문 트레이더 를 위해 설계되었습니다.
M1 차트 정밀도 를 기반으로 M5 및 M15 다중 타임프레임 확인 을 지원하며, 정확하고 실시간인 매수·매도 신호 를 제공합니다. Scalper Pro 주요 장점: XAUUSD 스캘핑 최적화: 골드 스캘핑에 적합한 정밀한 진입 타이밍. EURUSD & JPY 대응: USDJPY, EURJPY, GBPJPY 등 주요 통화쌍의 변화를 신속 탐지. 시장 구조 돌파 감지: 주요 지지/저항 돌파 자동 인식. 거래량 스파이크 확인: 주문 흐름 급증 탐지를 통한 신호 필터링. 다중 타임프레임 대

https://www.mql5.com/en/users/gedeegi/seller
The design features a bold orange countdown timer icon set against a dark gray background, with the clock hands pointing toward the upper right. Below the timer, a candlestick chart displays green and red bars that represent price movements across different time periods, with sharp detailing and balanced composition. The countdown time of "05:17" is prominently displayed next to the clock, adding a dynamic and informative element to the image.
FREE
MetaTrader 마켓은 거래로봇과 기술지표를 판매하기에 최적의 장소입니다.
오직 어플리케이션만 개발하면 됩니다. 수백만 명의 MetaTrader 사용자에게 제품을 제공하기 위해 마켓에 제품을 게시하는 방법에 대해 설명해 드리겠습니다.
트레이딩 기회를 놓치고 있어요:
- 무료 트레이딩 앱
- 복사용 8,000 이상의 시그널
- 금융 시장 개척을 위한 경제 뉴스
등록
로그인
계정이 없으시면, 가입하십시오
MQL5.com 웹사이트에 로그인을 하기 위해 쿠키를 허용하십시오.
브라우저에서 필요한 설정을 활성화하시지 않으면, 로그인할 수 없습니다.