Investment Castle Trend Lines
- 지표
-
Ahmed Alaaeldin Abdulrahman Ahmed Elherzawi
 Every day is a new opportunity. You can build on yesterday's success or put its failures behind and start over again. That's the way life is, with a new game every day, and that's the way baseball is.
 - 버전: 1.0
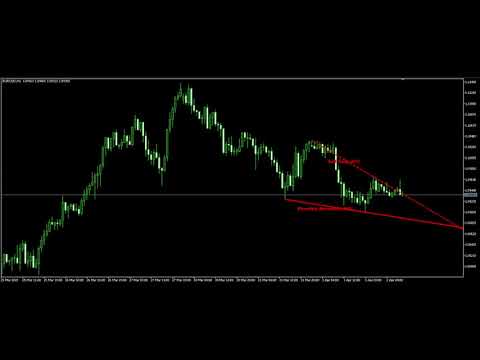
Investment Castle Trend Lines — Price Action, Drawn for You
Good trading starts with reading the trend — supply and demand, rising and falling channels, trend lines and engulfing candles. Investment Castle Trend Lines brings that price-action picture together on your chart automatically, so you can catch the trend with less guesswork and less stress.
What it does for you
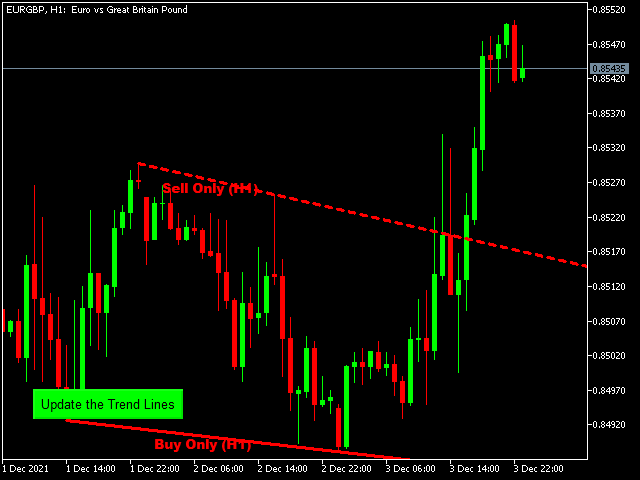
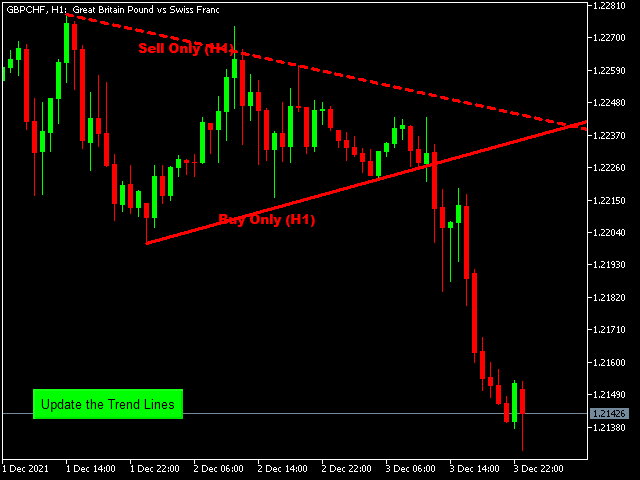
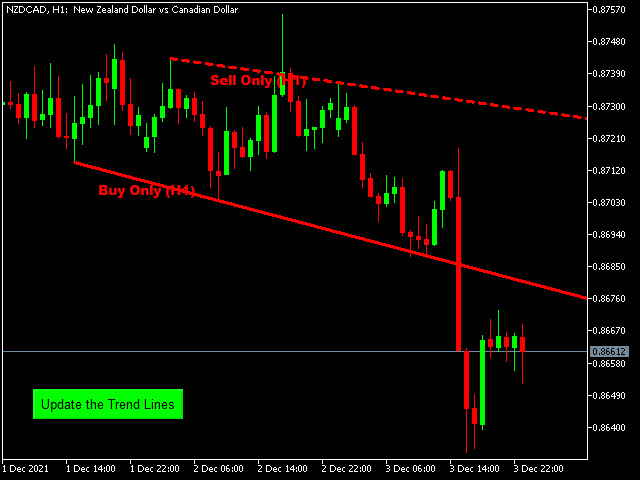
- Automatic trend lines: the prevailing trend lines are drawn for you — no manual plotting.
- Price-action context: see structure, direction and key turning points at a glance.
- Less stress, faster reads: spend your time deciding, not drawing.
- Built around proven price action: the same approach professional traders use to catch trends.
- Works everywhere: any symbol, any timeframe.
Who it is for: price-action traders who want the trend mapped for them before they commit.
Risk warning: trading involves substantial risk of loss. Always test on a demo account first and use risk settings you are comfortable with. Past performance does not guarantee future results.


super