Elder Impulse System

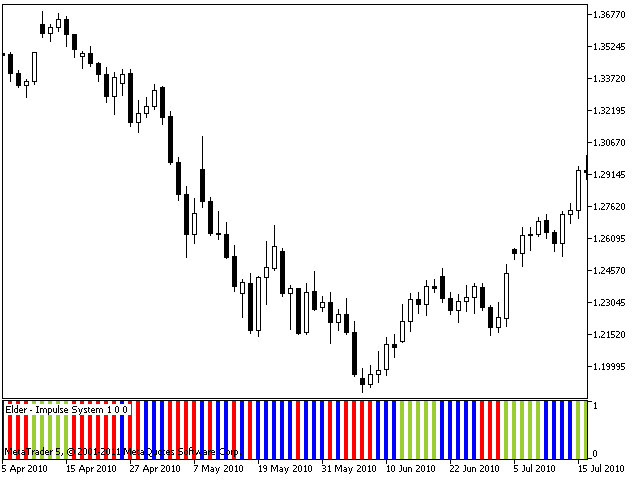
Impulse System은 "Come into my Trading Room" 책에서 처음 설명되었습니다. 그것은 MACD-히스토그램과 가격의 지수 이동 평균(EMA)의 방향을 사용하여 충동을 정의합니다. 규칙은 충동에 반대하여 거래하지 않는 것입니다.

색상 코드는 다음과 같은 여러 신호를 제공합니다.
  • EMA와 MACD-히스토그램이 모두 상승할 때 Impulse 시스템은 막대 색상을 녹색으로 지정합니다(단락 허용 안 됨).
  • EMA와 MACD-히스토그램이 모두 하락할 때 Impulse 시스템은 막대 색상을 빨간색으로 표시합니다(구매 불가).
  • EMA 및 MACD-히스토그램이 다른 방향을 가리키고 있을 때 Impulse 시스템은 막대 색상을 청록색으로 지정합니다(길거나 짧게 갈 수 있음).
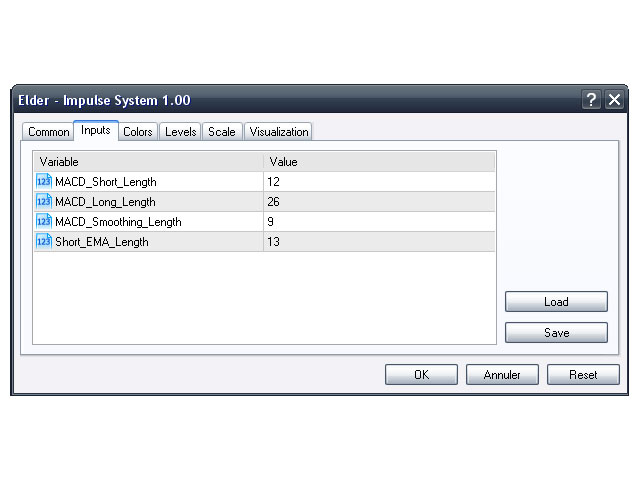

매개변수:

  • MACD_Short_Length(12) – MACD 계산을 위한 짧은 EMA.
  • MACD_Long_Length (26) – MACD 계산을 위한 긴 EMA
  • MACD_Smoothing_Length (9) – 신호 라인의 평활화 값.
  • Short_EMA_Length (13) – 단기 가격 EMA.
추천 제품
Noize Absorption Index
Ekaterina Saltykova
Noize Absorption Index - is the manual trading system that measures the difference of pressure between bears forces and bulls forces. Green line - is a noize free index that showing curent situation. Zero value of index shows totally choppy/flat market.Values above zero level shows how powerfull bullish wave is and values below zero measures bearish forces.Up arrow appears on bearish market when it's ready to reverse, dn arrow appears on weak bullish market, as a result of reverse expectation.
HMA Trend Professional MT5
Pavel Zamoshnikov
4.25 (4)
Improved version of the free HMA Trend indicator (for MetaTrader 4) with statistical analysis. HMA Trend is a trend indicator based on the Hull Moving Average (HMA) with two periods. HMA with a slow period identifies the trend, while HMA with a fast period determines the short-term movements and signals in the trend direction. The main differences from the free version: Ability to predict the probability of a trend reversal using analysis of history data. Plotting statistical charts for analyzi
Trend Reversal Scanner MT5
Reza Aghajanpour
5 (8)
**   All Symbols   x   All Timeframes   scan just by pressing scanner button ** Discount: The price is $50$, But now it is just $39, Limited time offer is active. *** Contact me  to send you instruction and add you in "Trend Reversal group" for sharing or seeing experiences with other users. Introduction: Trendlines are the most famous technical analysis in trading . Trendlines continually form on the charts of markets across all the different timeframes providing huge opportunities for traders
RBreaker
Zhong Long Wu
RBreaker Gold Indicators는 금 선물을 위한 단기 데이 트레이딩 전략으로, 추세 추종과 데이 내 반전의 두 가지 거래 방식을 결합합니다. 추세 장에서 수익을 포착할 수 있을 뿐만 아니라, 시장이 반전될 때 적시에 이익을 확정하고 추세에 맞춰 반대 포지션을 잡을 수 있습니다. 이 전략은 미국 잡지 Futures Truth에서 15년 연속으로 가장 수익성 높은 트레이딩 전략 상위 10위 안에 선정되었습니다. 긴 라이프사이클을 자랑하며, 현재까지 국내외에서 널리 사용되고 연구되고 있습니다. 본 지표는 2026년 금 선물의 움직임을 반영하여 14일 ATR 지표를 기반으로 돌파 계수 A, 관찰 계수 B, 반전 계수 R을 보다 합리적인 값으로 정의했습니다. 매우 훌륭한 지표이며, 안정적인 연간 수익성을 달성했습니다. 강력히 추천합니다~ 위 지표는 변동성이 높은 상품에 적합하며, 매개변수는 금 선물, 주가 지수 선물 등에 적합합니다. 다른 상품이 필요한 경우 돌파 계수 A
Heiken Ashi RSI Indicator for MT5
Mohammad Taher Halimi Tabrizi
Heikin Ashi RSI Indicator for MT5 (HARSI) Overview The Heikin Ashi RSI (HARSI) indicator combines Heikin Ashi candle smoothing with RSI momentum analysis, providing a dual-layer view of price action and relative strength. It offers a clear visualization of market direction, RSI-based overbought and oversold conditions, and optional backtesting and alert systems for strategy validation and trade signal automation. How It Works The indicator applies RSI values to Heikin Ashi calculations, creati
Volality Index Scalper
Lesedi Oliver Seilane
5 (1)
Volality Index scalper indicator  Meant for Volality pairs such as Volality 10, 25, 50, 75 and 100 The indicator works on all timeframes from the 1 minute to the monthly timeframe the indicator is non repaint the indicator has 3 entry settings 1 color change on zero cross 2 color change on slope change 3 color change on signal line cross Orange line is your sell signal Blue line is your buy signal.
Introduction The "Two Moving Average Crossover" indicator for MetaTrader 5 (MT5) is a technical analysis tool that displays two moving averages and notifies when the moving averages cross each other. The indicator calculates and plots two moving averages, one of which is faster and the other is slower. When the faster moving average crosses above the slower moving average, it is considered a bullish signal, indicating a potential trend reversal or the start of a new uptrend. Conversely, when th
우선적으로, 이 거래 도구는 전문적인 거래에 이상적인 비-다시 그리기 및 지연되지 않는 지표입니다.  온라인 강좌, 사용자 매뉴얼 및 데모. 스마트 가격 액션 컨셉트 인디케이터는 신규 및 경험 많은 트레이더 모두에게 매우 강력한 도구입니다. Inner Circle Trader Analysis 및 Smart Money Concepts Trading Strategies와 같은 고급 거래 아이디어를 결합하여 20가지 이상의 유용한 지표를 하나로 결합합니다. 이 인디케이터는 스마트 머니 컨셉트에 중점을 두어 대형 기관의 거래 방식을 제공하고 이동을 예측하는 데 도움을 줍니다.  특히 유동성 분석에 뛰어나 기관이 어떻게 거래하는지 이해하는 데 도움을 줍니다. 시장 트렌드를 예측하고 가격 변동을 신중하게 분석하는 데 탁월합니다. 귀하의 거래를 기관 전략에 맞추어 시장의 동향에 대해 더 정확한 예측을 할 수 있습니다. 이 인디케이터는 시장 구조를 분석하고 중요한 주문 블록을 식별하고 다양
Universal Soul Reaper
Pieter Gerhardus Van Zyl
Universal Soul Reaper is an atmospheric market-flow oscillator designed to interpret price behavior as a cycle of spiritual energy. Instead of reacting to raw price alone, it visualizes the state of the market’s soul —revealing when momentum is awakening, stabilizing, or fading. The indicator operates in a separate window and presents three interwoven entities: the Ectoplasmic Veil , the Spirit Boundary , and the Soul Core . Together, they form a living framework that helps traders sense pressu
Antique Trend
Nadiya Mirosh
The Antique Trend Indicator is a revolutionary trend trading and filtering solution with all the important features of a trend tool built into one tool! The Antique Trend indicator is good for any trader, suitable for any trader both for Forex and binary options. There is no need to configure anything, everything has been perfected by time and experience, it works great during flats and trends. The Antique Trend indicator is a tool for technical analysis of financial markets, reflecting curren
An indicator of pattern #31 ("Long Island") from Encyclopedia of Chart Patterns by Thomas N. Bulkowski. The second gap is in the opposite direction. Parameters: Alerts - show alert when an arrow appears   Push - send a push notification when an arrow appears (requires configuration in the terminal) GapSize - minimum gap size in points ArrowType - a symbol from 1 to 17 ArrowVShift - vertical shift of arrows in points   ShowLevels - show levels ColUp - color of an upward line ColDn - color of a d
TRI Visualizer
Yoshimi Mon 三 Ura
TRI Visualizer MT5 – Thermodynamic Market Analysis Overview The TRI (Thermal Range Indicator) Visualizer Enhanced is a rare market analysis indicator that goes beyond conventional technical analysis, applying principles of thermodynamics from physics. It interprets market price fluctuations as “thermodynamic energy,” enabling the highly accurate detection of subtle market changes that are often overlooked. Innovative Mechanisms 1. Dual Calculation Engines Classic TRI Mode Formula: |Close
MACD Pro Master
Itumeleng Mohlouwa Kgotso Tladi
MACD Pro Master The MACD Pro Master is your ultimate trading companion, designed to revolutionize your financial journey and unlock the doors to wealth. Here's why it's the next best thing since sliced bread: Advantages Precision Trading : The MACD Pro Master leverages the powerful Moving Average Convergence Divergence (MACD) indicator to provide accurate buy and sell trades,  ensuring you capitalize on every market opportunity. Customizable Settings : Tailor the trading strategy to your unique
Syntetic Mean Reversion
Danny Giovanni Romero Lozano
Synthetic Mean Reversion The Synthetic Mean Reversion is a technical indicator designed to analyze price momentum and its distance from dynamic equilibrium. It operates in a separate sub-window, offering a normalized view of market extensions and potential exhaustion zones based on price volatility. The indicator measures the difference between the current price and its mean, transforming market data into a visual scale of 0 to 100. This calculation helps identify periods when the price has de
Stochastic R
Antony Augustine
Stochastic  Reversal  allows you to recognize reversals professionally. Stochastic Indicator: This technical indicator was developed by George Lane more than 50 years ago. The reason why this indicator survived for so many years is because it continues to show consistent signals even in these current times. The Stochastic indicator is a momentum indicator that shows you how strong or weak the current trend is. It helps you identify overbought and oversold market conditions within a trend.  Rules
Scalping Flash X
Syamsurizal Dimjati
SCALPFLASH-X Where Fibonacci Precision Meets RSI Intelligence. Next-gen trading system combining Adaptive Fibonacci Pivots, RSI Heat Mapping, and Smart Candle Analytics. Detect market dominance, momentum shifts, and reversal zones in real time across multiple timeframes. Institutional accuracy, retail simplicity — built for speed, clarity, and precision. Advanced Multi-Timeframe Fibonacci & RSI-Driven Market Intelligence System ScalpFlash-X — A next-generation trading system combining Fibonacc
Riko Trend mt5
Nadiya Mirosh
The Riko Trend indicator is a revolutionary trend trading and filtering solution with all the important features of a trend tool built into one tool! The Riko Trend indicator is good for any trader, suitable for any trader for both forex and binary options. You don’t need to configure anything, everything is perfected by time and experience, it works great during a flat and in a trend. The Riko Trend indicator is a technical analysis tool for financial markets that reflects the current price f
Wavetrend for MT5
Antonello Belgrano
Here is a version for MetaTrader 5 of the famous Wave Trend indicator. Introducing the Wave Trend Oscillator Indicator for MT5 We are excited to present our Wave Trend Oscillator Indicator, exclusively designed for MetaTrader 5. This advanced tool is a must-have for traders who seek precision and efficiency in their trading journey. Our oscillator is built on the principles of wave trend analysis, capturing the ebb and flow of market trends with unparalleled accuracy. It helps traders identify p
The Trend Duration Forecast MT5 indicator is designed to estimate the probable lifespan of a bullish or bearish trend. Using a Hull Moving Average (HMA) to detect directional shifts, it tracks the duration of each historical trend and calculates an average to forecast how long the current trend is statistically likely to continue. This allows traders to visualize both real-time trend strength and potential exhaustion zones with exceptional clarity. KEY FEATURES Dynamic Trend Detection:   Utiliz
CosmiCLab FIBO
Kirils Subins
CosmiCLab SMC FIBO CosmiCLab SMC FIBO is a professional trading indicator designed for traders who use Smart Money Concepts (SMC), market structure analysis and Fibonacci retracement levels. The indicator automatically detects market swings and builds Fibonacci levels based on the latest impulse movement. It also identifies market structure changes such as BOS (Break of Structure) and CHOCH (Change of Character), helping traders understand the current market direction. CosmiCLab SMC FIBO also pr
FXC iDeM-DivergencE MT5 Indicator This is an advanced DeMarker indicator that finds trend-turn divergences on the current symbol. The indicator detects divergence between the DeMarker and the price movements as a strong trend-turn pattern. Main features: Advanced divergence settings Price based on Close, Open or High/Low prices Give Buy/Sell open signals PUSH notifications E-mail sending Pop-up alert Customizeable Information panel Input parameters: DeM Period: The Period size of the DeMarker in
MACD Divergence Radar Pro Multi-Symbol Divergence Scanner & Visual Dashboard for MetaTrader 5 Regular & Hidden Divergence 20+ Pairs Simultaneous Scan One-Click Chart Opening Auto MACD Sub-Window Overview MACD Divergence Radar Pro is a professional-grade divergence detection indicator that continuously scans multiple currency pairs and timeframes in real time. It identifies both regular and hidden MACD divergences — bullish and bearish — and presents all findings in a sleek, draggable on-chart d
Pro Gold System Indicator
PEDRO JOAQUIM GONCALVES GOMES
ADVANCED FUNCTIONALITIES: Trend Score (0-100) with visual bar Intelligent signals with adjustable strength (1-10) Risk management with automatic TP/SL Audible and visual alerts Price zones with smooth filling Multi-indicator analysis (RSI, ATR, BB, EMAs) DESIGN FEATURES Modern Visual: Smooth and well-spaced lines (EMA with 2-3px width) Vibrant and professional colors (Sky Blue, Orange, Gold) Modern arrows (code 233/234) for buy/sell signals Configurable dark/light theme Adjustable transparency f
FXC iMACD-DivergencE MT5 Indicator This is an advanced MACD indicator that finds trend-turn divergences on the current symbol. The indicator detects divergence between the MACD and the price movements as a strong trend-turn pattern. Main features: Advanced divergence settings Price based on Close, Open or High/Low prices Give Buy/Sell open signals PUSH notifications E-mail sending Pop-up alert Customizeable Information panel Input parameters: MACD Fast-EMA: The Fast-EMA variable of the MACD indi
Doctor Oscillator
Nicholas C Weber
This is similar in it's idea as the Binary Advance/Lite indicator, but this is intended to use as a levels indicator, as well as trend reversal and how ranging the market is. It takes several useful indicators and combines them in such a way as to declutter your charts, yet prove even more useful together, than separate. RSI, RVI, DeMarker, MACD are added together then multiplied by ATR and StdDev to reveal multiple factors: How far the price has changed, and as the price slows down and reverses
MT5용 Crypto_Forex 지표 "HTF 이동평균 교차" - MT5용 강력한 HTF 이동평균 교차 지표로 거래 방식을 업그레이드하세요. HTF는 더 높은 시간대를 의미합니다. - 이 지표는 가격 변동이 있는 추세 트레이더에게 매우 유용합니다. - 더 높은 시간대의 빠르고 느린 이동평균을 현재 차트에 추가할 수 있습니다. 이는 전문적인 방법입니다. - HTF 이동평균 교차는 모바일 및 PC 알림 기능을 내장하고 있습니다. - 이 지표는 낮은 위험으로 상당한 수익을 얻을 수 있는 기회를 제공합니다. .......................................................................... 여기를 클릭하여 고품질 트레이딩 로봇과 지표를 확인하세요! 이 제품은 MQL5 웹사이트에서만 제공되는 오리지널 제품입니다.
Multi ZigZag
Jose Freitas Alves Neto
# Indicador MultiZigZag Pro para MetaTrader 5 O MultiZigZag Pro é um poderoso indicador técnico para a plataforma MetaTrader 5 que identifica, de forma inteligente e flexível, os principais pontos de inflexão e tendências nos gráficos de preços. ## Características principais: - Algoritmo avançado que filtra ruídos e movimentos irrelevantes do mercado  - Múltiplos timeframes para análise de tendências de curto a longo prazo - Parâmetros de profundidade e desvio personalizáveis para adaptação a
Elder Impulse Release
Financial Trading Seminars Inc.
The purpose of Impulse Release is to prevent trading in the wrong direction. While the Impulse System operates in a single timeframe, Impulse Release is based on two timeframes. It tracks both the longer and the shorter timeframes to find when the Impulse points in the same direction on both. Its color bar flashes several signals: If one timeframe is in a buy mode and the other in a sell mode, the signal is "No Trade Allowed", a  black bar. If both are neutral, then any trades are allowed, showi
Binary Options Assistant (BOA) ICE Signals Indicator provides signals based on gkNextLevel Binary Options Strategy. Indicators: 2 Bollinger Bands & Stochastic Stop missing trades, stop jumping from chart to chart looking for trade set-ups and get all the signals on 1 chart! U se any of the BOA Signals Indicator with the  Binary Options Assistant (BOA) Multi Currency Dashboard .  All BOA Signal Indicator settings are adjustable to give you more strategy combinations. The signals can be seen vis
Laguerre SuperTrend Clouds   adds an Adaptive Laguerre averaging algorithm and alerts to the widely popular SuperTrend indicator. As the name suggests,   Laguerre SuperTrend Clouds (LSC)   is a trending indicator which works best in trendy (not choppy) markets. The SuperTrend is an extremely popular indicator for intraday and daily trading, and can be used on any timeframe. Incorporating Laguerre's equation to this can facilitate more robust trend detection and smoother filters. The LSC uses the
이 제품의 구매자들이 또한 구매함
SuperScalp Pro
Van Minh Nguyen
5 (14)
SuperScalp Pro – 고급 다중 필터 스캘핑 인디케이터 시스템 SuperScalp Pro는 클래식 Supertrend와 여러 지능형 확인 필터를 결합한 고급 스캘핑 인디케이터 시스템입니다. 해당 인디케이터는 M1부터 H4까지 모든 타임프레임에서 효율적으로 작동하며, 특히 XAUUSD, BTCUSD 및 주요 외환 통화쌍에 적합합니다. 독립형 시스템으로 사용하거나 기존 거래 전략에 유연하게 통합할 수 있습니다. 이 인디케이터는 11개 이상의 필터를 통합하며, 빠른/느린 EMA, 추세 판별용 3개의 EMA, EMA 기울기(EMA slope), RSI, ADX, 거래량(Volume), VWAP, 볼린저 밴드 돌파(Bollinger Bands Breakout) 및 MACD 다이버전스 필터 등을 포함합니다. 스마트 캔들 필터는 캔들 종가를 확인하여 약한 신호를 제거하고, 3 EMA와 MACD 다이버전스 필터를 결합한 추세 인식 메커니즘은 더 높은 승률의 신호를 선별하는 데 도움을 줍니
Azimuth Pro
Ottaviano De Cicco
5 (6)
LAUNCH PROMO Azimuth Pro price is initially set at 299$ for the first 100 buyers. Final price will be 499$ . THE DIFFERENCE BETWEEN RETAIL AND INSTITUTIONAL ENTRIES ISN'T THE INDICATOR — IT'S THE LOCATION. Most traders enter at arbitrary price levels, chasing momentum or reacting to lagging signals. Institutions wait for price to reach structured levels where supply and demand actually shift. Azimuth Pro maps these levels automatically: swing-anchored VWAP, multi-timeframe structure lines, an
Divergence Bomber
Ihor Otkydach
4.89 (85)
이 지표를 구매하신 분께는 다음과 같은 혜택이 무료로 제공됩니다: 각 거래를 자동으로 관리하고, 손절/익절 수준을 설정하며, 전략 규칙에 따라 거래를 종료하는 전용 도우미 툴 "Bomber Utility" 다양한 자산에 맞게 지표를 설정할 수 있는 셋업 파일(Set Files) "최소 위험", "균형 잡힌 위험", "관망 전략" 모드로 설정 가능한 Bomber Utility의 셋업 파일 이 전략을 빠르게 설치, 설정, 시작할 수 있도록 돕는 단계별 영상 매뉴얼 주의: 위의 모든 보너스를 받기 위해서는 MQL5 개인 메시지 시스템을 통해 판매자에게 연락해 주세요. 독창적인 커스텀 지표인 “Divergence Bomber(다이버전스 봄버)”를 소개합니다. 이 지표는 MACD 다이버전스(괴리) 전략을 기반으로 한 올인원(All-in-One) 거래 시스템입니다. 이 기술 지표의 주요 목적은 가격과 MACD 지표 간의 다이버전스를 감지하고, **향후 가격이 어느 방향으로 움직일지를 알려주는
Entry In The Zone and SMC Multi Timeframe is a real-time market analysis tool developed based on Smart Money Concepts (SMC). It is designed to analyze market structure, price direction, reversal points, and key zones across multiple timeframes in a systematic way. The system displays Points of Interest (POI) and real-time No Repaint signals, with instant alerts when price reaches key zones or when signals occur within those zones. It functions as both an Indicator and a Signal System (2-in-1), c
이 지표를 구매하면 제 프로페셔널 트레이드 매니저를 무료로 드립니다. 우선 이 거래 시스템이 리페인팅, 리드로잉 및 레이그 인디케이터가 아니라는 점을 강조하는 것이 중요합니다. 이는 수동 및 로봇 거래 모두에 이상적인 것으로 만듭니다. 온라인 강좌, 설명서 및 프리셋 다운로드. "스마트 트렌드 트레이딩 시스템 MT5"은 새로운 및 경험이 풍부한 트레이더를 위해 맞춤형으로 제작된 종합적인 거래 솔루션입니다. 10개 이상의 프리미엄 인디케이터를 결합하고 7개 이상의 견고한 거래 전략을 특징으로 하여 다양한 시장 조건에 대한 다목적 선택이 가능합니다. 트렌드 추종 전략: 효과적인 트렌드 추이를 타기 위한 정확한 진입 및 손절 관리를 제공합니다. 반전 전략: 잠재적인 트렌드 반전을 식별하여 트레이더가 범위 시장을 활용할 수 있게 합니다. 스캘핑 전략: 빠르고 정확한 데이 트레이딩 및 단기 거래를 위해 설계되었습니다. 안정성: 모든 인디케이터가 리페인팅, 리드로잉 및 레이그가 아니므로 신뢰
FX Trend MT5 NG
Daniel Stein
5 (4)
FX Trend NG: 차세대 멀티 마켓 트렌드 인텔리전스 개요 FX Trend NG 는 다중 시간 프레임 기반의 전문 트렌드 분석 및 시장 모니터링 도구입니다. 몇 초 만에 전체 시장 구조를 파악할 수 있도록 설계되었습니다. 여러 차트를 일일이 전환할 필요 없이, 어떤 종목이 추세에 있는지, 어디에서 모멘텀이 약화되고 있는지, 그리고 어떤 시간 프레임이 서로 정렬되어 있는지 즉시 확인할 수 있습니다. 출시 기념 특별 혜택 – FX Trend NG 를 $30 (6개월) 또는 $80 평생 라이선스 로 이용할 수 있습니다. 이미 Stein Investments 고객이신가요? -> 메시지를 보내 전용 고객 그룹에 참여하세요. 설정이나 사용 방법이 필요하신가요? -> Stein Investments 공식 페이지 를 방문하세요. 1. FX Trend NG가 특별한 이유 3단계 추세 로직 – 단순한 Buy / Sell이 아닙니다 • 대부분의 지표는 Buy 또는 Sell 두 가지 상태만 제
RelicusRoad Pro MT5
Relicus LLC
5 (24)
RelicusRoad Pro: 퀀트 시장 운영 체제 70% 할인 평생 이용권 (한정 시간) - 2,000명 이상의 트레이더와 함께하세요 왜 대부분의 트레이더는 "완벽한" 지표를 가지고도 실패할까요? 진공 상태에서 단일 개념 만으로 거래하기 때문입니다. 문맥 없는 신호는 도박입니다. 지속적인 승리를 위해서는 컨플루언스(중첩) 가 필요합니다. RelicusRoad Pro는 단순한 화살표 지표가 아닙니다. 완전한 퀀트 시장 생태계 입니다. 독점적인 변동성 모델링을 사용하여 가격이 이동하는 "공정 가치 로드"를 매핑하고, 단순 노이즈와 실제 구조적 돌파를 구분합니다. 추측은 그만두세요. 기관급 로드 로직으로 거래를 시작하세요. 핵심 엔진: "Road" 알고리즘 시스템의 중심에는 시장 상황에 실시간으로 적응하는 동적 변동성 채널인 Road Algo 가 있습니다. 세이프 라인(평형) 과 가격이 수학적으로 반전될 가능성이 높은 확장 레벨 을 투영합니다. Simple Road: 일반적인 시장을 위
Power Candles MT5
Daniel Stein
5 (6)
Power Candles – 모든 시장을 위한 강도 기반 진입 신호 Power Candles 는 Stein Investments의 검증된 강도 분석을 가격 차트에 직접 제공합니다. 가격 움직임에만 반응하는 대신, 각 캔들은 실제 시장 강도를 기준으로 색상화되어 모멘텀 형성, 강도 가속, 명확한 추세 전환을 즉시 파악할 수 있습니다. 모든 시장을 위한 단일 로직 Power Candles는 모든 거래 심볼 에서 자동으로 작동합니다. 현재 심볼이 Forex인지 비-Forex 시장인지 자동으로 감지하여 내부적으로 적절한 강도 모델을 적용합니다. Forex 및 Gold 는 FX Power Delta 값을 사용합니다 (절대값 범위 최대 100) 지수, 크립토 및 CFD 는 IX Power Strength 값을 사용합니다 (절대값 범위 최대 50) 필요한 강도 계산은 Power Candles에 완전히 내장되어 있습니다. 캔들 색상이나 신호 로직을 위해 추가 인디케이터는 필요하지 않습니다. 가격
AriX
Temirlan Kdyrkhan
1 (4)
AriX Indicator for MT5 A powerful trend-following and signal-evaluation tool AriX is a custom MT5 indicator that combines Moving Averages and ATR-based risk/reward logic to generate clear buy/sell signals. It visualizes dynamic SL/TP levels, evaluates past trade outcomes, and displays win/loss statistics in a clean on-chart panel. Key features include: Buy/Sell signals based on MA crossovers ATR-based SL/TP1/TP2/TP3 levels with visual lines and labels Signal outcome tracking with real-time stat
FX Power MT5 NG
Daniel Stein
5 (31)
FX Power: 통화 강세 분석으로 더 스마트한 거래 결정을 개요 FX Power 는 어떤 시장 상황에서도 주요 통화와 금의 실제 강세를 이해하기 위한 필수 도구입니다. 강한 통화를 매수하고 약한 통화를 매도함으로써 FX Power 는 거래 결정을 단순화하고 높은 확률의 기회를 발견합니다. 트렌드를 따르거나 극단적인 델타 값을 사용해 반전을 예측하고자 한다면, 이 도구는 귀하의 거래 스타일에 완벽히 적응합니다. 단순히 거래하지 말고, FX Power 로 더 스마트하게 거래하세요. 1. FX Power가 거래자에게 매우 유용한 이유 통화와 금의 실시간 강세 분석 • FX Power 는 주요 통화와 금의 상대적 강세를 계산하고 표시하여 시장 역학에 대한 명확한 통찰력을 제공합니다. • 어떤 자산이 앞서고 있고 어떤 자산이 뒤처지는지 모니터링하여 보다 현명한 거래 결정을 내릴 수 있습니다. 포괄적인 멀티 타임프레임 뷰 • 단기, 중기 및 장기 타임프레임에서 통화와 금의 강세를
Meridian Pro
Ottaviano De Cicco
Meridian Pro: Professional Multi-Timeframe Trend Matrix for MT5 Overview Meridian Pro is a multi-timeframe trend matrix by Merkava Labs that compresses directional state, strength, momentum condition and matrix agreement into one compact panel. One adaptive engine, applied consistently from M1 to W1. No per-symbol tuning. No indicator stacking. One structured readout across every asset and every timeframe. Launch Offer — Get Meridian Pro for USD 99 (introductory). Regular price: USD 149. 1. Why
Meravith MT5
Ivan Stefanov
마켓 메이커를 위한 도구. Meravith는 다음과 같은 기능을 제공합니다: 모든 타임프레임을 분석하고 현재 유효한 추세를 표시합니다. 강세와 약세 거래량이 동일한 유동성 구간(거래량 균형 구간)을 강조 표시합니다. 서로 다른 타임프레임의 모든 유동성 레벨을 차트에 직접 표시합니다. 텍스트 기반 시장 분석을 생성하여 참고용으로 제공합니다. 현재 추세를 기반으로 목표가, 지지선 및 손절가를 계산합니다. 거래의 위험 대비 보상 비율(Risk/Reward)을 계산합니다. 계좌 잔고에 따라 포지션 크기를 산출하고 잠재 수익을 추정합니다. 시장에 중대한 변화가 발생할 경우 경고도 제공합니다. 지표의 주요 라인: 강세/약세 거래량 소진 라인 — 목표가로 사용됩니다. 시장 추세를 나타내는 라인. 시장이 강세인지 약세인지에 따라 색상이 변경되며 추세 지지선 역할을 합니다. 색상은 주로 시장 심리를 보여줍니다. 거래량 균형선(Eq). Eq(Volume Equilibrium) 라인은 시스템의 핵심입니
Quantum TrendPulse
Bogdan Ion Puscasu
5 (22)
SuperTrend   ,   RSI   ,   Stochastic   의 힘을 하나의 포괄적인 지표로 결합하여 트레이딩 잠재력을 극대화하는 궁극의 트레이딩 도구   인 Quantum TrendPulse를   소개합니다. 정밀성과 효율성을 추구하는 트레이더를 위해 설계된 이 지표는 시장 추세, 모멘텀 변화, 최적의 진입 및 종료 지점을 자신 있게 식별하는 데 도움이 됩니다. 주요 특징: SuperTrend 통합:   주요 시장 추세를 쉽게 따라가고 수익성의 물결을 타세요. RSI 정밀도:   매수 과다 및 매도 과다 수준을 감지하여 시장 반전 시점을 파악하는 데 적합하며 SuperTrend 필터로 사용 가능 확률적 정확도:   변동성이 큰 시장에서 숨겨진 기회를 찾기 위해 확률적 진동   을 활용하고 SuperTrend의 필터로 사용 다중 시간대 분석:   M5부터 H1 또는 H4까지 다양한 시간대에 걸쳐 시장을 최신 상태로 유지하세요. 맞춤형 알림:   맞춤형 거래 조건이 충족되면
RFI levels PRO MT5
Roman Podpora
3.67 (3)
이 지표는 추세 반전 지점과 가격 반등 영역을 정확하게 보여줍니다.       주요 투자자들   . 새로운 트렌드가 형성되는 곳을 파악하고 최대한 정확하게 의사결정을 내리며 모든 거래를 완벽하게 통제합니다. TREND LINES PRO   지표와 함께 사용할 때 최대의 잠재력을 발휘합니다.  VERSION MT4 지표가 보여주는 내용: 새로운 추세의 시작 시 활성화되는 반전 구조 및 반전 수준. 최소한의 위험 대비 수익률을 갖는 이익 실현   (TAKE PROFIT)   및   손절매(STOP LOSS)   레벨 표시       RR 1:2   . 지능형 손실 감소 로직이 적용된 손절매 기능. 지정된 지표에서 두 가지 추세 유형에 대한 반전 패턴을 표시합니다. 지표: 트렌드를 따라   트렌드 라인 프로   (글로벌 트렌드 변화) 트렌드 프로   (빠른 트렌드 변화) 간단하고 효과적입니다       스캐너       실시간 추세 (신규). 다중 시간 프레임 도구 필터링. 표시하다  
Grabber System MT5
Ihor Otkydach
4.83 (23)
탁월한 기술적 지표인 Grabber를 소개합니다. 이 도구는 즉시 사용 가능한 “올인원(All-Inclusive)” 트레이딩 전략으로 작동합니다. 하나의 코드 안에 강력한 시장 기술 분석 도구, 매매 신호(화살표), 알림 기능, 푸시 알림이 통합되어 있습니다. 이 인디케이터를 구매하신 모든 분들께는 다음의 항목이 무료로 제공됩니다: Grabber 유틸리티: 오픈 포지션을 자동으로 관리하는 도구 단계별 영상 매뉴얼: 설치, 설정, 그리고 실제 거래 방법을 안내 맞춤형 세트 파일: 인디케이터를 빠르게 자동 설정하여 최고의 성과를 낼 수 있도록 도와줍니다 다른 전략은 이제 잊어버리세요! Grabber만이 여러분을 새로운 트레이딩의 정점으로 이끌어 줄 수 있습니다. Grabber 전략의 주요 특징: 거래 시간 프레임: M5부터 H4까지 거래 가능한 자산: 어떤 자산이든 사용 가능하지만, 제가 직접 테스트한 종목들을 추천드립니다 (GBPUSD, GBPCAD, GBPCHF, AUDCAD, AU
Trend Screener Pro MT5
STE S.S.COMPANY
4.84 (102)
트렌드 표시기, 트렌드 트레이딩 및 필터링을 위한 획기적인 고유 솔루션, 하나의 도구 안에 내장된 모든 중요한 트렌드 기능! Forex, 상품, 암호 화폐, 지수 및 주식과 같은 모든 기호/도구에 사용할 수 있는 100% 다시 칠하지 않는 다중 시간 프레임 및 다중 통화 표시기입니다. Trend Screener는 차트에 점이 있는 화살표 추세 신호를 제공하는 효율적인 지표 추세 추종 지표입니다. 추세 분석기 표시기에서 사용할 수 있는 기능: 1. 트렌드 스캐너. 2. 최대 이익 분석이 있는 추세선. 3. 추세 통화 강도 측정기. 4. 경고가 있는 추세 반전 점. 5. 경고가 있는 강력한 추세 점. 6. 추세 화살표 Trend Screener Indicator가 있는 일일 분석 예, 일일 신호 성능...등은 여기에서 찾을 수 있습니다. 여기를 클릭하십시오. LIMITED TIME OFFER : Trend Screener Indicator는 50$ 및 평생 동안만 사용할 수 있습니다.
Atomic Analyst MT5
Issam Kassas
3.94 (31)
우선적으로 언급할 점은이 거래 지표가 다시 그리지 않고 지연되지 않으며 이를 통해 수동 및 로봇 거래 모두에 이상적이라는 점입니다. 사용자 매뉴얼: 설정, 입력 및 전략. Atomic Analyst는 가격의 강도와 모멘텀을 활용하여 시장에서 더 나은 이점을 찾는 PA Price Action Indicator입니다. 고급 필터를 장착하여 잡음과 거짓 신호를 제거하고 거래 잠재력을 높이는 데 도움이 됩니다. 복잡한 지표의 다중 레이어를 사용하여 Atomic Analyst는 차트를 스캔하고 복잡한 수학적 계산을 간단한 신호와 색상으로 변환하여 초보 트레이더가 이해하고 일관된 거래 결정을 내릴 수 있도록합니다. "Atomic Analyst"는 새로운 및 경험이 풍부한 트레이더를위한 종합적인 거래 솔루션입니다. 프리미엄 지표와 최고 수준의 기능을 하나의 거래 전략에 결합하여 모든 종류의 트레이더에 대한 다재다능한 선택지가되었습니다. 인트라데이 거래 및 스캘핑 전략 : 빠르고 정확한 일일
OmniSync Projection
Antonio-alin Teculescu
5 (1)
Chronos Fractal Engine is an innovative price projection indicator for MetaTrader 5, designed to transform your technical analysis by intelligently identifying and projecting historical price patterns. Built upon an advanced correlation algorithm and the fractal principles of the market, this powerful tool visualizes potential future price movements, giving you a unique edge in your trading decisions. What is Chronos Fractal Engine? At its core, the Chronos Fractal Engine employs a sophisticat
Trend Forecaster
Alexey Minkov
5 (7)
The Trend Forecaster indicator utilizes a unique proprietary algorithm to determine entry points for a breakout trading strategy. The indicator identifies price clusters, analyzes price movement near levels, and provides a signal when the price breaks through a level. The Trend Forecaster indicator is suitable for all financial assets, including currencies (Forex), metals, stocks, indices, and cryptocurrencies. You can also adjust the indicator to work on any time frames, although it is recommen
Crystal Heikin Ashi Signals
Muhammad Jawad Shabir
5 (1)
Crystal Heikin Ashi Signals - Professional Trend & Signal Detection Indicator Advanced Heikin Ashi Visualization with Intelligent Signal System for Manual & Automated Trading Final Price: $149 ---------> Price goes up $10 after every 10 sales . Limited slots available — act fast . Overview Crystal Heikin Ashi Signals is a professional-grade MetaTrader 5 indicator that combines pure Heikin Ashi candle visualization with an advanced momentum-shift detection system. Designed for both manual traders
Matrix Arrow Indicator MT5
Juvenille Emperor Limited
5 (19)
매트릭스 화살표 표시기 MT5 는 외환, 상품, 암호 화폐, 지수, 주식과 같은 모든 기호/도구에 사용할 수 있는 100% 다시 칠하지 않는 다중 기간 표시기를 따르는 고유한 10 in 1 추세입니다.  Matrix Arrow Indicator MT5 는 다음과 같은 최대 10개의 표준 지표에서 정보와 데이터를 수집하여 초기 단계에서 현재 추세를 결정합니다. 평균 방향 이동 지수(ADX) 상품 채널 지수(CCI) 클래식 하이켄 아시 캔들 이동 평균 이동 평균 수렴 발산(MACD) 상대 활력 지수(RVI) 상대 강도 지수(RSI) 포물선 SAR 스토캐스틱 오실레이터 윌리엄스의 백분율 범위 모든 지표가 유효한 매수 또는 매도 신호를 제공하면 강력한 상승/하락 추세를 나타내는 다음 캔들/막대가 시작될 때 해당 화살표가 차트에 인쇄됩니다. 사용자는 사용할 표시기를 선택하고 각 표시기의 매개변수를 개별적으로 조정할 수 있습니다. 매트릭스 화살표 표시기 MT5는 선택한 표시기에서만 정보를 수
Smart Stop Indicator – 차트 위에서 직접 작동하는 지능형 스톱로스 시스템 개요 Smart Stop Indicator는 감이나 추측이 아닌 명확하고 체계적인 방식으로 스톱로스를 설정하고 싶은 트레이더를 위한 맞춤형 솔루션입니다. 이 도구는 클래식 프라이스 액션 논리(고점, 저점 구조)와 현대적인 브레이크아웃 인식을 결합하여 실제로 가장 논리적인 다음 스톱 레벨을 정확히 식별합니다. 추세, 박스권, 빠른 브레이크아웃 상황 등 어떤 시장에서도 인디케이터는 최적의 SL 구역과 상태(“new”, “broken”, “valid”)를 차트에 직접 표시합니다. 새로운 기능으로 SL 거리의 %ADR 표시가 추가되었습니다. 핵심 기능 자동 시장구조 기반 스톱 설정 • 시장 구조와 실시간 가격 움직임을 기반으로 의미 있는 스톱로스 레벨을 자동으로 탐지합니다. 스마트 브레이크아웃 감지 • 빠른 방향 변화나 돌파 상황에서도 불필요한 조기 스톱 조정을 강요하지 않으며 유연하게 반응합
Bill Williams Advanced
Siarhei Vashchylka
5 (10)
Bill Williams Advanced is designed for automatic chart analysis using Bill Williams' "Profitunity" system. The indicator analyzes four timeframes at once. Manual (Be sure to read before purchasing) Advantages 1. Analyzes the chart using Bill Williams' "Profitunity" system. Signals are displayed in a table in the corner of the screen and on the price chart. 2. Finds all known AO and AC signals, as well as zone signals. Equipped with a trend filter based on the Alligator. 3. Finds "Divergence Bar
Trend Lines PRO MT5
Roman Podpora
5 (1)
트렌드 라인즈 프로       이 지표는 시장이 실제로 어떤 방향으로 전환되는지 파악하는 데 도움이 됩니다. 실제 추세 반전 지점과 주요 시장 참여자들이 다시 진입하는 지점을 보여줍니다. 보시다시피       BOS 라인       복잡한 설정이나 불필요한 노이즈 없이 더 높은 시간대의 추세 변화와 주요 레벨을 확인할 수 있습니다. 신호는 차트에 다시 그려지지 않고 캔들이 마감된 후에도 계속 표시됩니다. MT4 버전   -   RFI LEVELS PRO   표시기   와 결합 시 최대 잠재력을 발휘합니다. 지표가 보여주는 내용: 실제 변화       추세(BOS 라인) 한 번 신호가 나타나면 그 신호는 계속 유효합니다! 이는 신호를 발생시킨 후 변경될 수 있는 리페인팅 방식의 지표와 중요한 차이점입니다. 리페인팅 방식의 지표는 잠재적으로 자금 손실로 이어질 수 있습니다. 이제 더욱 높은 확률과 정확도로 시장에 진입할 수 있습니다. 또한 화살표가 나타난 후 목표가(익절)에 도달하거나
Trend indicator AI mt5
Ramil Minniakhmetov
5 (16)
트렌드 인공 지능 지표는 실행 가능한 진입 점 및 반전 경고와 추세 식별을 결합하여 상인의 시장 분석을 향상시킬 훌륭한 도구입니다. 이 표시기는 사용자가 자신감과 정밀도로 외환 시장의 복잡성을 탐색 할 수 있도록 지원합니다 기본 신호 외에도 트렌드 인공 지능 지표는 풀백 또는 되돌림 중에 발생하는 2 차 진입 점을 식별하여 거래자가 기존 트렌드 내에서 가격 수정을 활용할 수 있도록합니다. 중요한 장점: ·작동 4 및 5 *명확한 구매 또는 판매 신호 *다시 칠하지 않습니다 *모든 자산에서 작동 나는 전보 사기에 개 또는 세트를 판매하지 않도록주의. 모든 설정은 블로그에 여기에 무료.  중요! 지침 및 보너스를 얻기 위해 구입 후 즉시 저에게 연락! 진짜 가동 감시는 뿐 아니라 나의 다른 제품 여기에서 찾아낼 수 있습니다: https://www.mql5.com/en/users/mechanic/seller&nbsp ; 설정 및 입력: 모든 자산에 대해 기본 설정을 권
Market Structure Order Block Dashboard MT5 는 MetaTrader 5용 MT5 인디케이터 로, 시장 구조 및 ICT / Smart Money Concepts에 기반합니다: HH/HL/LH/LL , BOS , ChoCH 뿐 아니라 Order Blocks , Fair Value Gaps (FVG) , 유동성 (EQH/EQL, sweeps), 세션 / Kill Zones , 그리고 Volume Profile 을 통합하여 콤팩트한 컨플루언스 대시보드를 제공합니다. 중요: 본 제품은 분석 도구 입니다. 자동 매매를 실행하지 않습니다( EA가 아님 ). 구매자 보너스 구매 후 제 스토어에서 보너스 인디케이터 2개 를 (선택하여) 무료로 받을 수 있습니다. 보너스 수령 방법: 1) 본 제품에 대한 솔직한 리뷰를 남겨주세요. 2) MQL5 메시지로 BONUS MSOB + 선택한 인디케이터 2개 이름 을 보내주세요. 주요 기능 시장 구조: HH/HL/LH/LL
Gold Sniper Scalper Pro
Ich Khiem Nguyen
3.78 (9)
Gold Sniper Scalper Pro는 XAUUSD에서 허위 돌파 (false breakout) 패턴을 감지하기 위해 특별히 설계된 MetaTrader 5 지표입니다. 가격이 레인지 경계를 돌파하여 돌파 트레이더를 유인한 후 반전하는 4봉 트랩 구조를 식별합니다. 지표는 각 셋업을 17개 품질 요소로 평가하고, 4계층 합류 파이프라인을 통해 처리하며, 7타임프레임 추세 합의 엔진으로 검증하고, 금 변동성 상태 분류기로 필터링합니다. 이 모든 과정이 신호가 차트에 표시되기 전에 완료됩니다. 자세한 사용자 가이드는 작성자의   MQL5 블로그 에서 확인할 수 있습니다. 추가 업데이트는 작성자의   MQL5 채널 을 통해 제공됩니다. 현재 지원 정책에 따라 구매자는 저자가 개발한 선별된 보조 도구에 대한 추가 접근 권한을 받을 수 있습니다. Forex 쌍, 지수 및 암호화폐에서도 작동하지만, 감지 매개변수, 변동성 처리 및 필터 로직은 XAUUSD 특성에 최적화되어 있습니다.
FX Levels MT5
Daniel Stein
5 (13)
FX Levels: 모든 시장을 위한 뛰어난 정확도의 지지와 저항 간단 요약 통화쌍, 지수, 주식, 원자재 등 어떤 시장이든 믿을 만한 지지·저항 레벨을 찾고 싶나요? FX Levels 는 전통적인 “Lighthouse” 기법과 첨단 동적 접근을 결합해, 거의 보편적인 정확성을 제공합니다. 실제 브로커 경험을 반영하고, 자동화된 일별 업데이트와 실시간 업데이트를 결합함으로써 FX Levels 는 가격 반전 포인트를 파악하고, 수익 목표를 설정하며, 자신 있게 트레이드를 관리할 수 있게 돕습니다. 지금 바로 시도해 보세요—정교한 지지/저항 분석이 어떻게 여러분의 트레이딩을 한 단계 끌어올릴 수 있는지 직접 확인하세요! 1. FX Levels가 트레이더에게 매우 유용한 이유 뛰어난 정확도의 지지·저항 존 • FX Levels 는 다양한 브로커 환경에서도 거의 동일한 존을 생성하도록 설계되어, 데이터 피드나 시간 설정 차이로 인한 불일치를 해소합니다. • 즉, 어떤 브로커를 사용하
ARIPoint
Temirlan Kdyrkhan
ARIPoint is a powerful trading companion designed to generate high-probability entry signals with dynamic TP/SL/DP levels based on volatility. Built-in performance tracking shows win/loss stats, PP1/PP2 hits, and success rates all updated live. Key Features: Buy/Sell signals with adaptive volatility bands Real-time TP/SL/DP levels based on ATR Built-in MA Filter with optional ATR/StdDev volatility Performance stats panel (Success, Profit/Loss, PP1/PP2) Alerts via popup, sound, push, or email Cu
이 지표는 실제 거래에 완벽한 자동 파동 분석 지표입니다! 사례... 참고:   웨이브 그레이딩에 서양식 이름을 사용하는 데 익숙하지 않습니다. Tang Lun(Tang Zhong Shuo Zen)의 명명 규칙의 영향으로 기본 웨이브를   펜   으로 명명하고 2차 웨이브 밴드를   세그먼트   로 명명했습니다. 동시에, 세그먼트에는 추세 방향이 있습니다.   주요 추세 세그먼트에는   이름이 지정되지만(이 이름 지정 방법은 향후 노트에서 사용됩니다. 먼저 말씀드리겠습니다.) 알고리즘은 굴곡 이론과 거의 관련이 없으므로 그렇게 해서는 안 됩니다. 이는 나의 시장 분석을   통해 요약된 끊임없이 변화하고 복잡한 운영 규칙을   반영합니다. 밴드는 더 이상 사람마다 다르지 않도록 표준화되고 정의되었습니다. 인위적인 간섭의 드로잉 방법은 시장 진입을 엄격하게 분석하는 데 핵심적인 역할을 합니다. 이 지표를 사용하는 것은 거래 인터페이스의 미학을 개선하고 원래의 K-line 거래를
제작자의 제품 더 보기
Elder MACD Combo
Financial Trading Seminars Inc.
MACD Histogram tracks the difference between the MACD line and the Signal line (which is the exponential moving average of the first line). For better visibility, when plotting the lines and the histogram in the same window, we scale up the histogram by a factor of 2. Furthermore, we use two separate plots for the histogram, which allows us to color-code the bars for upticks and downticks. The MACD Combo overlays MACD lines on MACD Histogram. Putting both plots in the same window enables you to
Elder Chandelier Long Exit
Financial Trading Seminars Inc.
The Chandelier Exit, introduced by Charles LeBeau, is described in "Come into My Trading Room" book. It calculates each stop on a long position in an uptrend from the highest point reached during that rally, and gets its name from the chandelier, which hangs from the highest point in the room. The Chandelier Exit uses a multiple of the Average True Range (ATR), subtracting it from the highest high since the trade was entered. It creates a new trade whenever the previous trade is stopped out. Cha
Elder Chandelier Long Entries
Financial Trading Seminars Inc.
One of the key rules in trading is never move your stops in such a way that your risk increases. Our stop sequence shows the automatic tightening of stops. They appear as a series of decreasing risk points until the trade is eventually stopped out. The problem is that if you enter a trade at any other point than the initial dot of the sequence, you may be placing the stop too close. Stop-entry plots show you the initial value for the stop for each bar. You can use them when you put on a trade, a
Elder Chandelier Short Exit
Financial Trading Seminars Inc.
The Chandelier Exit, introduced by Charles LeBeau, is described in "Come into My Trading Room" book. It calculates each stop on a short position in a downtrend from the lowest point reached during that decline. The Chandelier Exit uses a multiple of the Average True Range (ATR), adding it to the lowest low since the trade was entered. It creates a new trade whenever the previous trade is stopped out. Chandelier Stops differ from traditional stops by having the ability to move against you if the
Elder Chandelier Short Entries
Financial Trading Seminars Inc.
One of the key rules in trading is never move your stops in such a way that your risk increases. Our stop sequence shows the automatic tightening of stops. They appear as a series of decreasing risk points until the trade is eventually stopped out. The problem is that if you enter a trade at any other point than the initial dot of the sequence, you may be placing the stop too close. Stop-entry plots show you the initial value for the stop for each bar. You can use them when you put on a trade, a
Elder ray
Financial Trading Seminars Inc.
Elder-Ray is made of both Bulls Power and Bears Power as described in "Come into my Trading Room" book. It is tracking the relative power of bulls and bears by measuring how far the high and the low of each bar get away from the average price. Elder-ray is an indicator developed by Dr. Elder and named for its similarity to x-rays. It shows the structure of bullish and bearish power below the surface of the markets. Elder-ray combines a trendfollowing moving average with two oscillators to show w
Elder Impulse Release
Financial Trading Seminars Inc.
The purpose of Impulse Release is to prevent trading in the wrong direction. While the Impulse System operates in a single timeframe, Impulse Release is based on two timeframes. It tracks both the longer and the shorter timeframes to find when the Impulse points in the same direction on both. Its color bar flashes several signals: If one timeframe is in a buy mode and the other in a sell mode, the signal is "No Trade Allowed", a  black bar. If both are neutral, then any trades are allowed, showi
Elder MACD XOver
Financial Trading Seminars Inc.
The MACD XOver indicator was developed by John Bruns to predict the price point at which MACD Histogram will reverse the direction of its slope. The indicator is plotted one day ahead into the future, allowing, if your strategy depends on MACD Histogram, to predict its reversal point for tomorrow (or the next bar in any timeframe). If the closing price tomorrow is above the value of this indicator, then MACD Histogram will tick up. If the closing price tomorrow is below the value of this indicat
Elder Market Thermometer
Financial Trading Seminars Inc.
The Market Thermometer is described in "Come into my Trading Room" book.  It measures the degree of volatility, as reflected in greater or smaller intraday ranges. When the Market Temperature spikes above its average or stays below its average for a number of days, it gives trading signals, as described in the book. Parameters: Thermometer_EMA_Length (22) – The length of the moving average of the Market Temperature. The default 22, the average number of trading days in a month. Spike_Alert_Facto
Elder SafeZone Long
Financial Trading Seminars Inc.
SafeZone is a method for setting stops on the basis of recent volatility, outside the level of market noise. It is described in "Come into my Trading Room" book. In an uptrend, SafeZone defines noise as that portion of the current bar that extends below the low of the previous bar, going against the prevailing trend. It averages the noise level over a period of time and multiplies it by a trader-selected factor. For long trades, SafeZone subtracts the average noise level, multiplied by a factor
Elder SafeZone Long Entries
Financial Trading Seminars Inc.
One of the key rules in trading is never move your stops in such a way that your risk increases. Our stop sequence shows the automatic tightening of stops. They appear as a series of decreasing risk points until the trade is eventually stopped out. The problem is that if you enter a trade at any other point than the initial dot of the sequence, you may be placing the stop too close. Stop-entry plots show you the initial value for the stop for each bar. You can use them when you put on a trade,
Elder SafeZone Short
Financial Trading Seminars Inc.
SafeZone is a method for setting stops on the basis of recent volatility, outside the level of market noise. It is described in "Come into my Trading Room" book. In a downtrend, SafeZone defines noise as the portion of the current bar that extends above the high of the previous bar, against the downtrend. It averages the noise level over a period of time and multiplies it by a trader-selected factor. For short trades, it adds the average noise level, multiplied by a factor, to the latest high t
Elder SafeZone Short Entries
Financial Trading Seminars Inc.
One of the key rules in trading is never move your stops in such a way that your risk increases. Our stop sequence shows the automatic tightening of stops. They appear as a series of decreasing risk points until the trade is eventually stopped out. The problem is that if you enter a trade at any other point than the initial dot of the sequence, you may be placing the stop too close. Stop-entry plots show you the initial value for the stop for each bar. You can use them when you put on a trade,
Elder Smoothed ROC
Financial Trading Seminars Inc.
The Smoothed ROC indicator, developed by Fred Schutzman, is described in "Trading for a Living" book. It is created by calculating the rate of change for an exponential moving average of closing prices. When it changes direction, it helps identify and confirm trend changes. Parameters Smoothing_EMA_Length (13) – The length of the EMA used for smoothing; ROC_Period (21) – The length of the rate of change calculation.
Elder Force Index With ATR Channels
Financial Trading Seminars Inc.
3 (1)
Kerry Lovvorn은 Force Index에 ATR(Average True Range) 채널을 추가하는 것을 제안했습니다. 이러한 채널을 추가하면 Force Index가 중간 고점과 저점을 식별하는 탁월한 도구로 변합니다. ATR 채널을 사용하는 Force Index는 모든 회전을 포착하지는 않지만 식별하는 회전은 매우 심각한 주의를 기울일 가치가 있습니다. 참고 : Average True Range에서 "true"라는 단어는 가격 격차를 처리하는 것을 의미합니다. Force Index에는 간격이 없으므로 여기서 ATR은 Average Range와 동일합니다. 힘 지수가 3-ATR 채널보다 높거나 낮을 때마다 이는 티커가 지속 불가능한 극단 영역에 도달했다는 신호입니다. 이는 상승과 하락이 소진되고 가격이 반전되는 경향이 있는 곳입니다. 이는 위쪽과 아래쪽 영역을 모두 호출하는 데 똑같이 효율적인 몇 안 되는 도구 중 하나입니다. Elder-disk는 힘 지수의 EMA가
필터:
리뷰 없음
리뷰 답변