Ultimate Pivot Points

Ultimate Pivot Levels indicator for MetaTrader 5

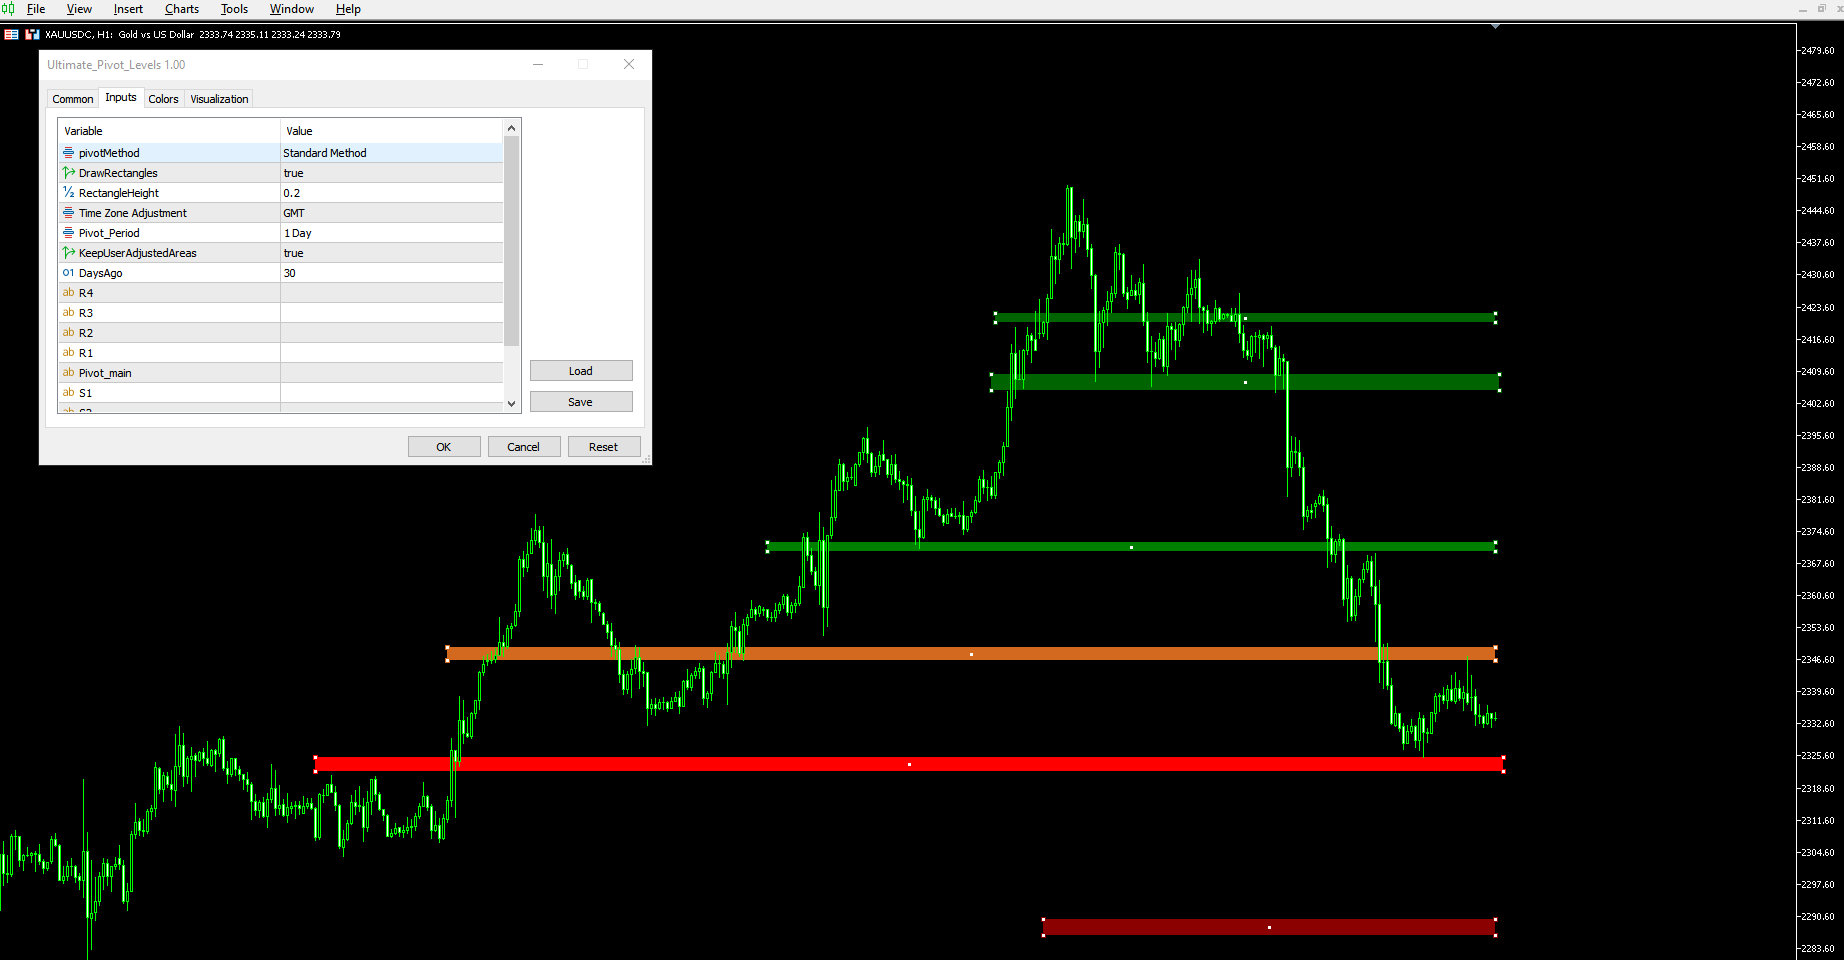
Ultimate_Pivot_Levels is versatile tool designed to enhance your trading experience by accurately plotting pivot levels on your charts. It allows entering your desired values manually or using well known pivot calculation methods to create pivot levels. It draws the levels in the background and allows you to customize levels, size and colors of areas, and it keeps your adjustments while extending the levels to every new bar. Whether you are a novice trader or a seasoned professional, this indicator provides the flexibility and precision you need to make informed trading decisions.

Key Features

1. Multiple Pivot Calculation Methods The Ultimate_Pivot_Levels  indicator supports various pivot calculation methods, allowing you to choose the one that best suits your trading strategy:

  • Manual Values: Input your custom pivot levels, or copy-paste from your desired channel or website
  • Standard Method: Classic pivot calculation based on the previous period’s high, low, and close prices.
  • Camarilla Method: A popular method known for its unique formula.
  • Woodie Method: A variation that gives more weight to the close price.
  • DeMark Method: A method developed by Tom DeMark, focusing on specific market conditions.
  • Fibonacci Method: Uses Fibonacci ratios for pivot levels.


2. Line and Rectangle Area Drawing The indicator allows you to draw either lines or rectangles on the pivot levels.The width and position of rectangles are then adjustable.

3. Customizable You can customize the color, style, and width of the rectangles to match your chart’s aesthetic. This level of customization ensures that your chart remains clean and easy to read. With the KeepUserAdjustedAreas feature, any manual adjustments you make to the pivot levels will be preserved, even if the timeframe changes. This ensures that your custom analysis remains intact.

4. Adjustable Timeframes The indicator can calculate pivot levels based on different timeframes, such as hourly, daily, or weekly. This flexibility allows you to analyze multiple timeframes and get a comprehensive view of the market.

4. Adjustable Time Zones: Since the Forex is a 24hr market there is an eternal debate on deciding at which time the open, the close, the high and the low from each 24-hour cycle should be taken to calculate pivot points. The majority of traders agree that the most accurate predictions are achieved when the pivot point is adjusted to the GMT or the Eastern (New York - EST) times. Here you can make such adjustments by setting Time Zone Adjustment

5. Multiple Pivot indicators: You can use multiple instances of Ulitmate_Pivots indicator on your chart to add more levels, or to keep track of multiple time frame pivots. For example add first instance based on D1 period and the second one based on H4 period.

6. Easy Integration The Ultimate_Pivot_Levels  indicator is designed to be easily integrated into your existing trading setup. Its intuitive input settings make it simple to configure and use.


Inputs and Customization

Input Parameters

  1. Pivot Calculation Method
    • MANUAL: Use manual values specified by the user.
    • STANDARD: Uses the standard pivot point calculation method.
    • FIBONACCI: Incorporates Fibonacci levels into the pivot point calculation.
    • CAMARILLA: Utilizes the Camarilla equation for more sensitive levels, ideal for intraday trading.
    • WOODIE: Applies Woodie's formula, placing more emphasis on the closing price of the previous period.
    • DEMARK: Features Tom DeMark's pivot points, focusing on recent price behaviors.
    • Description: Choose the method for calculating pivot points based on your trading strategy preferences.
  2. Draw Rectangles
    • Toggle to draw rectangles around pivot levels for better visualization. When set to false, pivot levels are indicated by lines.
  3. Rectangle Height
    • Adjust the height of the rectangles around the pivot levels. Larger values increase the rectangle's thickness, enhancing visibility but covering more chart space.
  4. Time Zone Adjustment:
    • NO_ADJUSTMENT: Uses local time to find High,Low,Close and Open of the previous period for pivot calculations.
    • NEW_YORK_EST: Adjusts the pivot calculation to align with the New York market hours (EST).
    • GMT: Adjusts the pivot calculation to Greenwich Mean Time (GMT).
    • Description:
  5. Pivot Period : Select the time frame(e.g., M1, M5, H1, H4, D1, W1) for which the High,Low,Close and Open  are obtained for pivot calculations. This choice determines the time span each pivot point covers.
  6. Keep User Adjusted Areas When enabled, any user modifications to pivot area boundaries (such as resizing of rectangles) are preserved across sessions and chart reloads, allowing for persistent custom settings.

The Ultimate_Pivot_Levels  indicator is a powerful tool for traders who rely on pivot levels for their trading strategies. Its flexibility, ease of use, and customization options make it a valuable addition to any trader’s toolkit. Download it now from the MetaTrader 5 Market and take your trading to the next level!

Please share your feedback and desired features in the comments or in the rating stars.


추천 제품
Pivot Points Buy Zones
Nils R M Peleman
4.86 (7)
Detailed Description: The   Pivot Points Indicator   is designed for traders who rely on pivot points, midpoints and support/resistance levels for their trading strategies. By automatically calculating and plotting these levels (based on   the   previous period's high, low, and close prices) , the indicator provides a clear, visual representation of critical price areas where the market may reverse or break out.The tool is particularly useful for day traders and swing traders looking to base th
FREE
Auto Fibo Retracement MT5
Nguyen Tuan Son
5 (10)
Auto Fibonacci Retracement Indicator — Flexible and Reliable This isn’t just another Auto Fibonacci Retracement indicator. It’s one of the most flexible and dependable tools available . If you find it useful, please consider leaving a review or comment — your feedback means a lot! Check out my other helpful tools below: Smart Alert Manager   - Set up advanced alerts and send them to Mobile, Telegram, Discord, Webhook... Timeframes Trend Scanner    - Scan the trend of assets in difference timefr
FREE
Pivot Points slim
Hiroyuki Sasaki
Pivot Point Slim Indicator Overview A professional-grade pivot point indicator equipped with 6 types of pivots. With a clean, easy-to-read design, it automatically displays important support and resistance levels on your chart. Customizable Display Settings Individual color settings for each level (P, S1-S5, R1-R5) Show/hide toggle for each level Label display on/off Price display on/off Label position (left/right) Label offset adjustment (spacing between lines and text) Line width adjustment Hi
FREE
Raymond Cloudy Day
The Hung Ngo
5 (3)
Raymond Cloudy Day Indicator for MT5 – Pivot-Based Reversal and Trend Levels Raymond Cloudy Day Indicator is a pivot-based level indicator for MetaTrader 5 (MT5). It was developed by Ngo The Hung based on Raymond’s original idea and is designed to give a structured view of potential reversal zones, trend extensions and support/resistance levels directly on the chart. The default settings are optimised for XAUUSD on the H1 timeframe, but the indicator can be tested and adjusted for other symbols
FREE
Dynamic Pivot Zones
Vincent Jose Proenca
Dynamic Pivot Zones – Your Level Assistant on the Chart This indicator is a bit like a GPS for your trading . It shows you where the price likes to hang out, where it gets nervous, and where it flies through. No more calculating pivots by hand or guessing support and resistance levels. What it does: Automatically plots H1, H4, and D1 pivots . Shows support and resistance zones : R1, R2, S1, S2. Lines are colored and easy to read , so you can instantly see what’s hot or cold. Why you’ll love it:
FREE
Draw Pivot Point
Rainer Schnoege
The utility draws pivot levels for the selected timefram in classic method. Pivot = (high + close + low) / 3 R1 = ( 2 * Pivot) - low S1 = ( 2 * Pivot) - high R2 = Pivot + ( high - low ) R3 = high + ( 2 * (Pivot - low)) S2 = Pivot - (high - low) S3 = low - ( 2 * (high - Pivot)) you can change the timeframe, colors and fontsize. also you can change the text for the levels. Have fun and give feedback...
FREE
This indicators automatically draws the   support and resistances   levels (key levels) for you once you've dropped it on a chart. It reduces the hustle of drawing and redrawing these levels every time you analyse prices on a chart. With it, all you have to do is drop it on a chart, adjust the settings to your liking and let the indicator do the rest. But wait, it gets better; the indicator is absolutely free! For more information:  https://youtu.be/rTxbPOBu3nY For more free stuff visit:  https:
FREE
Support Resistance Channels - Trading Guide *** Group support:  https://www.mql5.com/en/channels/vuongphamtrading Overview The Support Resistance Channels indicator automatically identifies and displays the strongest support and resistance zones based on pivot points. Unlike simple horizontal lines, this indicator creates channels (zones) which better represent real market behavior where support and resistance act as areas rather than precise levels. Key Features Automatic Detection : Identifie
FREE
All in One Pivot Point
Ali Gokay Duman
5 (7)
This indicator calculates support and resistance prices in multi-timeframe with different formulation and draw them on the chart that style do you choose. And If you want, Indicator can alert you when the current price arrive these pivot levels. Formulations: Classic, Camarilla, Woodie, Demark, Floor, Fibonacci Alert Options: Send Mobil Message, Send E-mail, Show Message, Sound Alert Levels: PP, S1, S2, S3, S4, S5, R1, R2, R3, R4, R5, TC, BC  and Middle Points Why do you need this indicator: Ti
FREE
This indicator is a **Pivot-Confluence Zone Identifier** that focuses exclusively on identifying key support and resistance levels where price clusters align with classic pivot points. Here's what it does: ## Core Functionality **Pivot Confluence Detection**:  - Only displays price zones that align with classic pivot point levels (R1, R2, R3, S1, S2, S3) - **Excludes the main pivot point** - focuses only on support and resistance levels - Uses a configurable pip range to detect confluence nea
FREE
Overview QuantumEdge Oscillator is a professional-grade trading indicator that combines advanced momentum analysis with sophisticated trend detection algorithms. This 30-day trial version provides full access to all features, allowing you to thoroughly test its capabilities in live market conditions before making a purchase decision. Key Features Dual-Signal System : Combines RSI moving average with smoothed ATR-based volatility bands Multi-Timeframe Analysis : Built-in support for higher timefr
FREE
The   Pivot Point indicator   automatically calculates and displays the pivot point line and support and resistance levels. Pivot can be calculated according to the Classic, Floor, Fibonacci, Woodie, Camarilla or DeMark formula. It is also possible to select the period for calculating the indicator. A trader can choose from daily, weekly, monthly, or user-defined periods. Types of pivots Classic Floor Fibonacci Woodie Camarilla DeMark Main features The indicator shows the current and historic
FREE
SnR Engine
Muhammad Tamimul Huda
SnR Engine Basically, this is a Support and Resistance indicator like most others that use fractals to determine support and resistance levels. The difference is that this indicator determines whether a support or resistance level has been broken based on ATR. Levels that have been broken will become “dead levels” and will be shown with dashed lines. Levels that have many rejections and fail to be broken will have increasingly thicker lines. For effective use, you need to understand the charac
FREE
Daily Open Line
Attila Radulovic
4.29 (7)
The indicator draws the daily open line. Parameters GMT shift (minutes) The time zone could be shifted. The value is given in minutes. Draw closest regular bar's open price This parameter could fine-tune the open price line when using GMT shift. Yes - Draw the open line based on the current chart period's closest regular bar No - Draw the open line based on the M1 chart's closest bar.  Let's assume that your shift is 10 minutes, and you are using H1 chart and the first candle in every day is 0
FREE
이전 버전의 인디케이터 개발 ZigZag WaveSize MT4 ZigZag WaveSize - 표준 ZigZag 인디케이터를 수정하여 포인트, 레벨 및 다양한 경고 로직에 대한 정보 추가 일반적인 개선 사항: MetaTrader 5 코드 적응 그래픽 객체 작업 최적화 새로운 기능: 극점에서의 수평 수준 수준 유형 선택: 수평/광선/세그먼트 유동성 수준 필터 (가격에 의해 돌파되지 않음) 돌파 버퍼: 거짓 돌파에 대한 민감도 설정 레이블 및 기능 설정: 수량, 외관, 오래된 레이블 삭제 구조 돌파 알림 (BoS) 움직임 성격 변경 알림 (ChoCH) 최적화: 극값 업데이트 로직 수정 새로운 객체의 동적 업데이트 바 출현 시 하중 감소 레이블의 중앙 집중 시스템 수정 사항: 배열 범위 초과 수정 레이블의 정확한 위치 지정 중복 파라미터 제거 ZigZag WaveSize 인디케이터를 귀하의 트레이딩 시스템의 보완재로 사용하세요   또한 시장에서의 나의 다른 제품도 시도해 보세요 
FREE
Strifor Pivot ATR Target
Strifor (Mauritius) Ltd
5 (2)
Strifor Pivot ATR Target MetaTrader 5용 ATR 목표 및 분석 패널 피봇 지표 Strifor Pivot ATR Target 는 일중 및 단기 거래를 위한 도구로, 고전적인 피봇 수준과 동적 ATR 목표, 확장 분석 패널을 결합합니다. 이 지표는 거래 범위, 가격 반응 가능 구역, 움직임 잠재력을 사전에 평가하여 수동 계산과 주관적 판단을 제거합니다. 주요 기능 피봇 레벨 자동 생성 (PP, R1–R3, S1–S3) 평균 변동성 기준 ATR 목표 계산 상승/하락 별 목표 (ATR Long / ATR Short) 정보 패널 표시: 현재 ATR 값 일간 범위 진행률 남은 잠재력 고점/저점 기준 움직임 평가 전일 데이터 반영 가능 라인 및 패널 표시 유연성 모든 자산 유형 지원: 지수, 통화, 원자재, 암호화폐 MT5 완전 호환 (헤지 및 넷팅) 작동 원리 지표는 전일 데이터를 기반으로 피봇 레벨을 계산하고 ATR(14) 목표를 설정합니다. ATR 목표는 통
FREE
Auto Fib Retracements
Ross Adam Langlands Nelson
4.2 (5)
Automatic Fibonacci Retracement Line Indicator. This indicator takes the current trend and if possible draws Fibonacci retracement lines from the swing until the current price. The Fibonacci levels used are: 0%, 23.6%, 38.2%, 50%, 61.8%, 76.4%, 100%. This indicator works for all charts over all timeframes. The Fibonacci levels are also recorded in buffers for use by other trading bots. Any comments, concerns or additional feature requirements are welcome and will be addressed promptly. 
FREE
Pivot Points are a classic technical analysis indicator that calculates the central pivot point (PP) as well as support (S1–S3) and resistance (R1–R3) levels based on the previous day’s High, Low, and Close. The indicator allows you to: • identify key zones where the price may bounce or break through • determine the direction of the trend • find good entry points, as well as set stop loss and take profit levels Indicator settings: • enable/disable PP, R1/S1, R2/S2, R3/S3 • enable/disable price l
FREE
ATR Dynamic Pivot Signals Indicator
SkyBlue Fintech Solutions LLP
Unlock Precision Trading: The ATR Dynamic Pivot System Download this free   ATR Pivot Signals   indicator and instantly gain an edge against market noise. This is the ultimate tool for traders who demand high-conviction entry points based on genuine market swing reversals, not guesswork. The   ATR Pivot Signals   system   is an innovative technical indicator that utilizes the Average True Range (ATR) to dynamically filter volatility, ensuring that a signal is triggered only when a price move is
FREE
Nexus Pivot Points
Mohammed Kaddour
Pivot Points are used by Forex traders to find support and resistance levels based on the previous day's price action. There are various ways to calculate pivot points, including averaging the open, high, low, and close of the previous day's chart price. Forex Traders use a combination of pivot points with moving averages to find trading opportunities in the currency markets. Pivot points are very useful tools that use the previous bars' highs, lows and closings to project support and resist
FREE
One of the simplest Pivot Point indicator, easy to operate, and most complete for a single chart in determining    Resistance   and   Support  level lines. In single chart,  it will show R&S Level Line with 5 popular types of Pivot Point, Highest&Lowest of closing price Include the Trend and up to 3 Time Frames. Five   types   (Floor, Woodie, Camarilla, DeMark, & Fibonacci)   of popular   Pivot Points   in determining   Resistance   and   Support   levels. With just using simple button on the
FREE
AliPivot Points
Alexandra Voicu
AliPivot Points is a Meta Trader 5 Indicator that draws you the latest pivot points. You can choose from timeframes ranging from 1 Minute to 1 Month. Calculation methods for pivot points includes: Classic Pivot Points Camarilla Pivot Points Fibonacci Pivot Points Woodie Pivot Points You can personalize the line colors, style, and width to suit your preference. The indicator displays values on the right side of the chart. AliPivot Points values can also be utilized by developers for creating Expe
FREE
-- 간단하지만 효과적입니다. 역전 지표 - 무엇인가요? 슈퍼트렌드(SuperTrend) 논리와 지수 곡선 기술을 결합한 추세 추종 오버레이 지표입니다. 추세 방향을 감지하고 차트에 동적 채널을 그리며, 추세가 반전될 때 실시간 알림을 보냅니다. 어떻게 작동하나요? 지표는 ATR과 슈퍼트렌드 계수를 사용해 지수형 기준선을 계산합니다. 가격이 이 기준선 위나 아래로 마감되면 추세 반전이 확인됩니다. 녹색 화살표는 매수 추세 시작을, 빨간색 화살표는 매도 추세 시작을 표시합니다. 주요 기능: ATR 기반 동적 채널을 적용한 지수 추세 기준선 녹색/적색으로 구분된 추세선 및 채워진 채널 추세 반전 시 매수/매도 화살표 신호 내장 알림: 팝업, 푸시 알림, 이메일, 소리 중복 알림 방지 (바당 하나의 알림) 완전 커스터마이징 가능: 색상, 선 두께, 화살표 크기, 채널 폭 지연 없는 깔끔한 차트 오버레이 입력값: 지수 추세율, 슈퍼트렌드 계수, ATR 기간, 채널 폭 토글 기능
FREE
Pivot MT5
Dmitrij Isaenko
The indicator draws daily support and resistance lines on the chart, as well as the Pivot level (reversal level). Adapted to work in MT5 The standard timeframe for calculating support and resistance levels is D1. You can choose other timeframes according to your strategy (for example, for M1-M15, the optimal timeframe for calculations is H1) The function for calculating support and resistance levels has been updated; in this calculation option, fibonacci levels are taken into account, respec
FREE
Fibo Pivot Optimus
Syamsurizal Dimjati
5 (1)
Ritz Smart FIBOPIVOT Optimus Pro Advanced Multi-Timeframe Fibonacci Trading System SMART PREDICTION & ACCURATE FORECAST Revolutionary Fibonacci Pivot Technology combines traditional pivot points with advanced Fibonacci extensions, creating a powerful predictive tool for professional traders. Our algorithm intelligently detects significant price levels across multiple timeframes, delivering laser-accurate support and resistance zones before the market moves . INTELLIGENT VOLUME-VALIDATED SIGNALS
FREE
Support Resistance Dynamic
Quang Huy Quach
5 (2)
The "Support Resistance Dynamic" indicator is a powerful technical analysis tool for the MetaTrader 5 platform, designed to automatically identify and plot dynamic Support and Resistance zones on price charts. This indicator helps traders easily recognize important price levels, potential reversal points, or breakout areas, thereby enabling more informed trading decisions. 2. Key Features Dynamic S/R Identification : Automatically identifies support and resistance zones based on an advanced Pivo
FREE
Free automatic Fibonacci is an indicator that automatically plots a Fibonacci retracement based on the number of bars you select on the BarsToScan setting in the indicator. The Fibonacci is automatically updated in real time as new highest and lowest values appears amongst the selected bars. You can select which level values to be displayed in the indicator settings. You can also select the color of the levels thus enabling the trader to be able to attach the indicator several times with differe
FREE
Support Resistance Indicator The "Support Resistance" indicator is a versatile tool designed to help traders identify key support and resistance levels based on an underlying algorithm. These levels indicate price points where an asset historically experiences buying (support) or selling (resistance) pressure. The indicator allows traders to visualize these levels on their charts, making it easier to make informed decisions. All Products   |   Contact PARAMETERS: Timeframe : Users can select the
FREE
Pivot Points Levels
Fillipe Dos Santos
2 (1)
Pivot Points Levels Description The Pivot Points Levels indicator is an advanced and comprehensive tool for technical analysis based on support and resistance levels calculated from pivot points. This free indicator combines 6 different calculation methods with support for multiple timeframes, offering a robust solution for identifying key price reversal and continuation areas. Key Features 6 Calculation Methods : Traditional, Fibonacci, Woodie, Classic, DeMark (DM), and Camarilla Multi-Timefram
FREE
B2U Market State System Part of the B2U Market State System A professional indicator suite designed to analyze market structure, trend state, and momentum. B2U Market State System 의 구성 요소입니다. 시장 구조, 추세 상태, 모멘텀을 입체적으로 분석하기 위한 전문 인디케이터 시스템입니다. Highlights structurally validated reaction zones after FVG inversion. The New Generation of Inversion Fair Value Gaps B2U IFVG BOX & Zone visually analyzes market reaction zones formed after Fair Value Gap (FVG) inversion. 차세대 Inversion Fair Value Gaps FVG 반
FREE
이 제품의 구매자들이 또한 구매함
SuperScalp Pro
Van Minh Nguyen
4.72 (18)
SuperScalp Pro – 고급 다중 필터 스캘핑 인디케이터 시스템 SuperScalp Pro는 클래식 Supertrend와 여러 지능형 확인 필터를 결합한 고급 스캘핑 인디케이터 시스템입니다. 해당 인디케이터는 M1부터 H4까지 모든 타임프레임에서 효율적으로 작동하며, 특히 XAUUSD, BTCUSD 및 주요 외환 통화쌍에 적합합니다. 독립형 시스템으로 사용하거나 기존 거래 전략에 유연하게 통합할 수 있습니다. 이 인디케이터는 11개 이상의 필터를 통합하며, 빠른/느린 EMA, 추세 판별용 3개의 EMA, EMA 기울기(EMA slope), RSI, ADX, 거래량(Volume), VWAP, 볼린저 밴드 돌파(Bollinger Bands Breakout) 및 MACD 다이버전스 필터 등을 포함합니다. 스마트 캔들 필터는 캔들 종가를 확인하여 약한 신호를 제거하고, 3 EMA와 MACD 다이버전스 필터를 결합한 추세 인식 메커니즘은 더 높은 승률의 신호를 선별하는 데 도움을 줍니
Azimuth Pro
Ottaviano De Cicco
5 (6)
LAUNCH PROMO Azimuth Pro price is initially set at 299$ for the first 100 buyers. Final price will be 499$ . THE DIFFERENCE BETWEEN RETAIL AND INSTITUTIONAL ENTRIES ISN'T THE INDICATOR — IT'S THE LOCATION. Most traders enter at arbitrary price levels, chasing momentum or reacting to lagging signals. Institutions wait for price to reach structured levels where supply and demand actually shift. Azimuth Pro maps these levels automatically: swing-anchored VWAP, multi-timeframe structure lines, an
Divergence Bomber
Ihor Otkydach
4.9 (86)
이 지표를 구매하신 분께는 다음과 같은 혜택이 무료로 제공됩니다: 각 거래를 자동으로 관리하고, 손절/익절 수준을 설정하며, 전략 규칙에 따라 거래를 종료하는 전용 도우미 툴 "Bomber Utility" 다양한 자산에 맞게 지표를 설정할 수 있는 셋업 파일(Set Files) "최소 위험", "균형 잡힌 위험", "관망 전략" 모드로 설정 가능한 Bomber Utility의 셋업 파일 이 전략을 빠르게 설치, 설정, 시작할 수 있도록 돕는 단계별 영상 매뉴얼 주의: 위의 모든 보너스를 받기 위해서는 MQL5 개인 메시지 시스템을 통해 판매자에게 연락해 주세요. 독창적인 커스텀 지표인 “Divergence Bomber(다이버전스 봄버)”를 소개합니다. 이 지표는 MACD 다이버전스(괴리) 전략을 기반으로 한 올인원(All-in-One) 거래 시스템입니다. 이 기술 지표의 주요 목적은 가격과 MACD 지표 간의 다이버전스를 감지하고, **향후 가격이 어느 방향으로 움직일지를 알려주는
Power Candles MT5
Daniel Stein
5 (7)
Power Candles – 모든 시장을 위한 강도 기반 진입 신호 Power Candles 는 Stein Investments의 검증된 강도 분석을 가격 차트에 직접 제공합니다. 가격 움직임에만 반응하는 대신, 각 캔들은 실제 시장 강도를 기준으로 색상화되어 모멘텀 형성, 강도 가속, 명확한 추세 전환을 즉시 파악할 수 있습니다. 모든 시장을 위한 단일 로직 Power Candles는 모든 거래 심볼 에서 자동으로 작동합니다. 현재 심볼이 Forex인지 비-Forex 시장인지 자동으로 감지하여 내부적으로 적절한 강도 모델을 적용합니다. Forex 및 Gold 는 FX Power Delta 값을 사용합니다 (절대값 범위 최대 100) 지수, 크립토 및 CFD 는 IX Power Strength 값을 사용합니다 (절대값 범위 최대 50) 필요한 강도 계산은 Power Candles에 완전히 내장되어 있습니다. 캔들 색상이나 신호 로직을 위해 추가 인디케이터는 필요하지 않습니다. 가격
Entry In The Zone and SMC Multi Timeframe is a real-time 2-in-1 market analysis tool that combines market structure analysis and a No Repaint BUY / SELL signal system into a single indicator, built on Smart Money Concepts (SMC) — a widely adopted framework used by professional traders to understand market structure. This indicator helps you see the market more clearly, make decisions based on structure rather than guesswork, and focus on high-probability zones where price is more likely to react
이 지표를 구매하면 제 프로페셔널 트레이드 매니저를 무료로 드립니다. 우선 이 거래 시스템이 리페인팅, 리드로잉 및 레이그 인디케이터가 아니라는 점을 강조하는 것이 중요합니다. 이는 수동 및 로봇 거래 모두에 이상적인 것으로 만듭니다. 온라인 강좌, 설명서 및 프리셋 다운로드. "스마트 트렌드 트레이딩 시스템 MT5"은 새로운 및 경험이 풍부한 트레이더를 위해 맞춤형으로 제작된 종합적인 거래 솔루션입니다. 10개 이상의 프리미엄 인디케이터를 결합하고 7개 이상의 견고한 거래 전략을 특징으로 하여 다양한 시장 조건에 대한 다목적 선택이 가능합니다. 트렌드 추종 전략: 효과적인 트렌드 추이를 타기 위한 정확한 진입 및 손절 관리를 제공합니다. 반전 전략: 잠재적인 트렌드 반전을 식별하여 트레이더가 범위 시장을 활용할 수 있게 합니다. 스캘핑 전략: 빠르고 정확한 데이 트레이딩 및 단기 거래를 위해 설계되었습니다. 안정성: 모든 인디케이터가 리페인팅, 리드로잉 및 레이그가 아니므로 신뢰
Gold Entry Sniper
Tahir Mehmood
5 (8)
Gold Entry Sniper – 골드 스캘핑 & 스윙 트레이딩을 위한 전문 다중 시간 프레임 ATR 대시보드 Gold Entry Sniper 는 XAUUSD 및 기타 종목에 대해 정확한 매수/매도 신호 를 제공하는 고급 MetaTrader 5 지표입니다. ATR 트레일링 스톱 로직 과 다중 시간 프레임 분석 을 기반으로 설계되어 스캘핑과 스윙 트레이딩 모두에 적합합니다. 주요 기능 및 장점 다중 시간 프레임 분석 – M1, M5, M15 추세를 한눈에 확인. ATR 기반 트레일링 스톱 – 변동성에 따라 자동 조정. 전문 차트 대시보드 – 신호 상태, ATR 레벨, 회귀선, 매매 방향 표시. 명확한 매수/매도 마커 – 자동 화살표와 텍스트 라벨. 종료 알림 & 거래 관리 – 수익 보호를 위한 자동 종료 감지. 완전 사용자 설정 가능 – 대시보드 위치, 색상, ATR/회귀선 파라미터 조정. 골드(XAUUSD) 최적화 – M1~M15 스캘핑에 완벽, 외환/지수/암호화폐에도 적용 가능.
OmniSync Projection
Antonio-alin Teculescu
5 (1)
Chronos Fractal Engine is an innovative price projection indicator for MetaTrader 5, designed to transform your technical analysis by intelligently identifying and projecting historical price patterns. Built upon an advanced correlation algorithm and the fractal principles of the market, this powerful tool visualizes potential future price movements, giving you a unique edge in your trading decisions. What is Chronos Fractal Engine? At its core, the Chronos Fractal Engine employs a sophisticat
Meridian Pro
Ottaviano De Cicco
5 (1)
Meridian Pro: Professional Multi-Timeframe Trend Matrix for MT5 Overview Meridian Pro is a multi-timeframe trend matrix by Merkava Labs that compresses directional state, strength, momentum condition and matrix agreement into one compact panel. One adaptive engine, applied consistently from M1 to W1. No per-symbol tuning. No indicator stacking. One structured readout across every asset and every timeframe. Launch Offer — Get Meridian Pro for USD 99 (introductory). Regular price: USD 149. 1. Why
Power Bar MT5
Daniel Stein
실제 자금을 투입하기 전에 어떤 전략이 내 심볼에서 효과적인지 확인하세요. Power Bar는 모든 심볼과 모든 타임프레임에서 극단적인 가격 바 를 감지한 다음, 3가지 다른 트레이딩 전략을 즉시 백테스트하여 승률, 수익 팩터, 손익을 나란히 비교할 수 있습니다. 모든 것이 하나의 인터랙티브 패널에 담겨 있습니다. 추측 없음. 커브 피팅 없음. 오직 데이터뿐입니다. Power Bar가 특별한 이유 대부분의 인디케이터는 신호를 주고 그것이 효과가 있는지는 추측에 맡깁니다. Power Bar는 한 걸음 더 나아갑니다 - 모든 신호를 세 가지 전략 에 대해 테스트하고 통계를 보여줍니다. FlipFlop, Momentum, Reversal을 원클릭으로 전환하고 숫자가 즉시 변하는 것을 확인하세요. FlipFlop - 항상 포지션 유지. 신호에 진입하고, 반대 신호에 청산. 당사의 연구에 따르면 US30, US500, DAX와 같은 추세가 있는 지수에서 가장 효과적입니다. Momentum
Trend Screener Pro MT5
STE S.S.COMPANY
4.85 (104)
트렌드 표시기, 트렌드 트레이딩 및 필터링을 위한 획기적인 고유 솔루션, 하나의 도구 안에 내장된 모든 중요한 트렌드 기능! Forex, 상품, 암호 화폐, 지수 및 주식과 같은 모든 기호/도구에 사용할 수 있는 100% 다시 칠하지 않는 다중 시간 프레임 및 다중 통화 표시기입니다. Trend Screener는 차트에 점이 있는 화살표 추세 신호를 제공하는 효율적인 지표 추세 추종 지표입니다. 추세 분석기 표시기에서 사용할 수 있는 기능: 1. 트렌드 스캐너. 2. 최대 이익 분석이 있는 추세선. 3. 추세 통화 강도 측정기. 4. 경고가 있는 추세 반전 점. 5. 경고가 있는 강력한 추세 점. 6. 추세 화살표 Trend Screener Indicator가 있는 일일 분석 예, 일일 신호 성능...등은 여기에서 찾을 수 있습니다. 여기를 클릭하십시오. LIMITED TIME OFFER : Trend Screener Indicator는 50$ 및 평생 동안만 사용할 수 있습니다.
FX Trend MT5 NG
Daniel Stein
5 (4)
FX Trend NG: 차세대 멀티 마켓 트렌드 인텔리전스 개요 FX Trend NG 는 다중 시간 프레임 기반의 전문 트렌드 분석 및 시장 모니터링 도구입니다. 몇 초 만에 전체 시장 구조를 파악할 수 있도록 설계되었습니다. 여러 차트를 일일이 전환할 필요 없이, 어떤 종목이 추세에 있는지, 어디에서 모멘텀이 약화되고 있는지, 그리고 어떤 시간 프레임이 서로 정렬되어 있는지 즉시 확인할 수 있습니다. 출시 기념 특별 혜택 – FX Trend NG 를 $30 (6개월) 또는 $80 평생 라이선스 로 이용할 수 있습니다. 이미 Stein Investments 고객이신가요? -> 메시지를 보내 전용 고객 그룹에 참여하세요. 설정이나 사용 방법이 필요하신가요? -> Stein Investments 공식 페이지 를 방문하세요. 1. FX Trend NG가 특별한 이유 3단계 추세 로직 – 단순한 Buy / Sell이 아닙니다 • 대부분의 지표는 Buy 또는 Sell 두 가지 상태만 제
Atomic Analyst MT5
Issam Kassas
3.94 (31)
우선적으로 언급할 점은이 거래 지표가 다시 그리지 않고 지연되지 않으며 이를 통해 수동 및 로봇 거래 모두에 이상적이라는 점입니다. 사용자 매뉴얼: 설정, 입력 및 전략. Atomic Analyst는 가격의 강도와 모멘텀을 활용하여 시장에서 더 나은 이점을 찾는 PA Price Action Indicator입니다. 고급 필터를 장착하여 잡음과 거짓 신호를 제거하고 거래 잠재력을 높이는 데 도움이 됩니다. 복잡한 지표의 다중 레이어를 사용하여 Atomic Analyst는 차트를 스캔하고 복잡한 수학적 계산을 간단한 신호와 색상으로 변환하여 초보 트레이더가 이해하고 일관된 거래 결정을 내릴 수 있도록합니다. "Atomic Analyst"는 새로운 및 경험이 풍부한 트레이더를위한 종합적인 거래 솔루션입니다. 프리미엄 지표와 최고 수준의 기능을 하나의 거래 전략에 결합하여 모든 종류의 트레이더에 대한 다재다능한 선택지가되었습니다. 인트라데이 거래 및 스캘핑 전략 : 빠르고 정확한 일일
RFI levels PRO MT5
Roman Podpora
3.67 (3)
이 지표는 추세 반전 지점과 가격 반등 영역을 정확하게 보여줍니다.       주요 투자자들   . 새로운 트렌드가 형성되는 곳을 파악하고 최대한 정확하게 의사결정을 내리며 모든 거래를 완벽하게 통제합니다. TREND LINES PRO   지표와 함께 사용할 때 최대의 잠재력을 발휘합니다.  VERSION MT4 지표가 보여주는 내용: 새로운 추세의 시작 시 활성화되는 반전 구조 및 반전 수준. 최소한의 위험 대비 수익률을 갖는 이익 실현   (TAKE PROFIT)   및   손절매(STOP LOSS)   레벨 표시       RR 1:2   . 지능형 손실 감소 로직이 적용된 손절매 기능. 지정된 지표에서 두 가지 추세 유형에 대한 반전 패턴을 표시합니다. 지표: 트렌드를 따라   트렌드 라인 프로   (글로벌 트렌드 변화) 트렌드 프로   (빠른 트렌드 변화) 간단하고 효과적입니다       스캐너       실시간 추세 (신규). 다중 시간 프레임 도구 필터링. 표시하다  
Trend indicator AI mt5
Ramil Minniakhmetov
5 (16)
트렌드 인공 지능 지표는 실행 가능한 진입 점 및 반전 경고와 추세 식별을 결합하여 상인의 시장 분석을 향상시킬 훌륭한 도구입니다. 이 표시기는 사용자가 자신감과 정밀도로 외환 시장의 복잡성을 탐색 할 수 있도록 지원합니다 기본 신호 외에도 트렌드 인공 지능 지표는 풀백 또는 되돌림 중에 발생하는 2 차 진입 점을 식별하여 거래자가 기존 트렌드 내에서 가격 수정을 활용할 수 있도록합니다. 중요한 장점: ·작동 4 및 5 *명확한 구매 또는 판매 신호 *다시 칠하지 않습니다 *모든 자산에서 작동 나는 전보 사기에 개 또는 세트를 판매하지 않도록주의. 모든 설정은 블로그에 여기에 무료.  중요! 지침 및 보너스를 얻기 위해 구입 후 즉시 저에게 연락! 진짜 가동 감시는 뿐 아니라 나의 다른 제품 여기에서 찾아낼 수 있습니다: https://www.mql5.com/en/users/mechanic/seller&nbsp ; 설정 및 입력: 모든 자산에 대해 기본 설정을 권
Crystal Heikin Ashi Signals
Muhammad Jawad Shabir
5 (2)
Crystal Heikin Ashi Signals - Professional Trend & Signal Detection Indicator Advanced Heikin Ashi Visualization with Intelligent Signal System for Manual & Automated Trading Final Price: $149 ---------> Price goes up $10 after every 10 sales . Limited slots available — act fast . Overview Crystal Heikin Ashi Signals is a professional-grade MetaTrader 5 indicator that combines pure Heikin Ashi candle visualization with an advanced momentum-shift detection system. Designed for both manual traders
Btmm state engine pro
Garry James Goodchild
5 (3)
BTMM State Engine Pro is a MetaTrader 5 indicator for traders who use the Beat The Market Maker approach: Asian session context, kill zone timing, level progression, peak formation detection, and a multi-pair scanner from a single chart. It combines cycle state logic with a built-in scanner dashboard so you do not need the same tool on many charts at once. What it does Draws the Asian session range; session times can follow broker server offset or be set in inputs. Tracks level progression (L
Gann Made Easy MT5
Oleg Rodin
5 (2)
Gann Made Easy 는 mr.의 이론을 사용하여 최고의 거래 원칙을 기반으로 하는 전문적이고 사용하기 쉬운 Forex 거래 시스템입니다. W.D. 간. 이 표시기는 Stop Loss 및 Take Profit Levels를 포함하여 정확한 BUY 및 SELL 신호를 제공합니다. PUSH 알림을 사용하여 이동 중에도 거래할 수 있습니다. 구매 후 거래 방법 안내 및 유용한 추가 지표를 무료로 받으시려면 저에게 연락주세요! 아마도 Gann 거래 방법에 대해 이미 여러 번 들었을 것입니다. 일반적으로 Gann의 이론은 초보자 거래자뿐만 아니라 이미 거래 경험이 있는 사람들에게도 매우 복잡한 것입니다. Gann의 거래 방식은 이론적으로 적용하기 쉽지 않기 때문입니다. 나는 그 지식을 연마하고 Forex 지표에 최고의 원칙을 적용하기 위해 몇 년을 보냈습니다. 표시기는 적용하기가 매우 쉽습니다. 차트에 첨부하고 간단한 거래 권장 사항을 따르기만 하면 됩니다. 지표는 지속적으로 시장 분석
Currency Strength Dashboard Pro
Anastasia Danilova
5 (1)
Currency Strength Dashboard Pro MetaTrader 5 를 위한 실시간 통화 강도 분석 전문 대시보드 입니다. 이 지표는 8개의 주요 통화 (EUR, USD, GBP, JPY, CHF, AUD, CAD, NZD)의 강도를 계산하고, 28개의 통화쌍 을 동시에 여러 시간 프레임에서 분석하여 표시합니다. 이 대시보드는 트레이더가 추가 계산이나 여러 차트 간 전환 없이 한눈에 시장 전체 상황을 파악 할 수 있도록 해줍니다. 계산 방법 이 지표는 고급 수학적 통화 강도 분석 방법 을 기반으로 합니다. 이는 유사한 지표에서 널리 사용되는 RSI 기반 방법 보다 더 정확하고 객관적인 결과를 제공합니다. 이 방법은 28개의 모든 통화쌍 간의 관계를 동시에 분석 하여 시장에서 실제로 형성되는 힘의 균형을 보다 명확하고 편향 없이 보여줍니다. 실시간 대시보드 메인 테이블에는 8개의 통화 에 대한 전체 데이터가 표시됩니다. Rank (순위) — 전체 강도 기준 통화 순위, 1
FX Power MT5 NG
Daniel Stein
5 (31)
FX Power: 통화 강세 분석으로 더 스마트한 거래 결정을 개요 FX Power 는 어떤 시장 상황에서도 주요 통화와 금의 실제 강세를 이해하기 위한 필수 도구입니다. 강한 통화를 매수하고 약한 통화를 매도함으로써 FX Power 는 거래 결정을 단순화하고 높은 확률의 기회를 발견합니다. 트렌드를 따르거나 극단적인 델타 값을 사용해 반전을 예측하고자 한다면, 이 도구는 귀하의 거래 스타일에 완벽히 적응합니다. 단순히 거래하지 말고, FX Power 로 더 스마트하게 거래하세요. 1. FX Power가 거래자에게 매우 유용한 이유 통화와 금의 실시간 강세 분석 • FX Power 는 주요 통화와 금의 상대적 강세를 계산하고 표시하여 시장 역학에 대한 명확한 통찰력을 제공합니다. • 어떤 자산이 앞서고 있고 어떤 자산이 뒤처지는지 모니터링하여 보다 현명한 거래 결정을 내릴 수 있습니다. 포괄적인 멀티 타임프레임 뷰 • 단기, 중기 및 장기 타임프레임에서 통화와 금의 강세를
RelicusRoad Pro MT5
Relicus LLC
5 (24)
RelicusRoad Pro: 퀀트 시장 운영 체제 70% 할인 평생 이용권 (한정 시간) - 2,000명 이상의 트레이더와 함께하세요 왜 대부분의 트레이더는 "완벽한" 지표를 가지고도 실패할까요? 진공 상태에서 단일 개념 만으로 거래하기 때문입니다. 문맥 없는 신호는 도박입니다. 지속적인 승리를 위해서는 컨플루언스(중첩) 가 필요합니다. RelicusRoad Pro는 단순한 화살표 지표가 아닙니다. 완전한 퀀트 시장 생태계 입니다. 독점적인 변동성 모델링을 사용하여 가격이 이동하는 "공정 가치 로드"를 매핑하고, 단순 노이즈와 실제 구조적 돌파를 구분합니다. 추측은 그만두세요. 기관급 로드 로직으로 거래를 시작하세요. 핵심 엔진: "Road" 알고리즘 시스템의 중심에는 시장 상황에 실시간으로 적응하는 동적 변동성 채널인 Road Algo 가 있습니다. 세이프 라인(평형) 과 가격이 수학적으로 반전될 가능성이 높은 확장 레벨 을 투영합니다. Simple Road: 일반적인 시장을 위
HFT Spike Detector
OMG FZE LLC
5 (2)
[ My Products ] , [ My Channel ]   ,  [ LIVE SIGNAL ] HFT Spike Detector HFT Spike Detector는 HFT로 인해 발생하는 급격한 가격 변동을 실시간으로 분석하고 측정하기 위해 개발된 전문적인 틱 모니터링 도구입니다. 목적은 브로커로 인해 발생하는 비정상적인 슬리피지, 유동성 공백 및 밀리초 단위 가격 스파이크를 수치 데이터로 감지할 수 있도록 하는 것입니다. 실시간 틱 흐름과 체결 조건을 분석하기 때문에 백테스트로는 정확하게 평가할 수 없습니다. 이 EA는 자동화를 위해 준비된 세트 파일과 함께 사용할 수 있도록 구매할 수 있습니다:  VolumeHedger EA 작동 원리 이 Expert Advisor는 들어오는 모든 틱을 실시간으로 분석하고: 가격 변화 속도 초당 틱 밀도 슬리피지 크기 같은 방향의 마이크로 흐름 측정하여 차트의 패널에 표시합니다. 이를 통해 스프레드를 제외한 실제 실행 품질을 확인할 수
ARICoins
Temirlan Kdyrkhan
ARICoin is a powerful trading companion designed to generate high-probability entry signals with dynamic TP/SL/DP levels based on volatility. Built-in performance tracking shows win/loss stats, PP1/PP2 hits, and success rates all updated live. Key Features: Buy/Sell signals with adaptive volatility bands Real-time TP/SL/DP levels based on ATR Built-in MA Filter with optional ATR/StdDev volatility Performance stats panel (Success, Profit/Loss, PP1/PP2) Alerts via popup, sound, push, or email Cust
Market Structure Order Block Dashboard MT5 는 MetaTrader 5용 MT5 인디케이터 로, 시장 구조 및 ICT / Smart Money Concepts에 기반합니다: HH/HL/LH/LL , BOS , ChoCH 뿐 아니라 Order Blocks , Fair Value Gaps (FVG) , 유동성 (EQH/EQL, sweeps), 세션 / Kill Zones , 그리고 Volume Profile 을 통합하여 콤팩트한 컨플루언스 대시보드를 제공합니다. 중요: 본 제품은 분석 도구 입니다. 자동 매매를 실행하지 않습니다( EA가 아님 ). 구매자 보너스 구매 후 제 스토어에서 보너스 인디케이터 2개 를 (선택하여) 무료로 받을 수 있습니다. 보너스 수령 방법: 1) 본 제품에 대한 솔직한 리뷰를 남겨주세요. 2) MQL5 메시지로 BONUS MSOB + 선택한 인디케이터 2개 이름 을 보내주세요. 주요 기능 시장 구조: HH/HL/LH/LL
Bill Williams Advanced
Siarhei Vashchylka
5 (11)
Bill Williams Advanced is designed for automatic chart analysis using Bill Williams' "Profitunity" system. The indicator analyzes four timeframes at once. Manual (Be sure to read before purchasing) Advantages 1. Analyzes the chart using Bill Williams' "Profitunity" system. Signals are displayed in a table in the corner of the screen and on the price chart. 2. Finds all known AO and AC signals, as well as zone signals. Equipped with a trend filter based on the Alligator. 3. Finds "Divergence Bar
CGE Trading Suite
Carl Gustav Johan Ekstrom
5 (1)
CGE Trading Suite delivers the analytical edge typically reserved for professional trading desks. The platform integrates a full suite of analytical tools into one seamless workflow: dynamic grid mapping, liquidity behavior analysis, ECM, trend lines, MIDAS, trade cycles, and directional channel projections. Together, these provide a unified view of market structure and momentum. Directional clarity is further enhanced by the capital flow index, which measures currency basket strength to identif
ARIPoint
Temirlan Kdyrkhan
ARIPoint is a powerful trading companion designed to generate high-probability entry signals with dynamic TP/SL/DP levels based on volatility. Built-in performance tracking shows win/loss stats, PP1/PP2 hits, and success rates all updated live. Key Features: Buy/Sell signals with adaptive volatility bands Real-time TP/SL/DP levels based on ATR Built-in MA Filter with optional ATR/StdDev volatility Performance stats panel (Success, Profit/Loss, PP1/PP2) Alerts via popup, sound, push, or email Cu
Gold Sniper Scalper Pro
Ich Khiem Nguyen
3.78 (9)
Gold Sniper Scalper Pro는 XAUUSD에서 허위 돌파 (false breakout) 패턴을 감지하기 위해 특별히 설계된 MetaTrader 5 지표입니다. 가격이 레인지 경계를 돌파하여 돌파 트레이더를 유인한 후 반전하는 4봉 트랩 구조를 식별합니다. 지표는 각 셋업을 17개 품질 요소로 평가하고, 4계층 합류 파이프라인을 통해 처리하며, 7타임프레임 추세 합의 엔진으로 검증하고, 금 변동성 상태 분류기로 필터링합니다. 이 모든 과정이 신호가 차트에 표시되기 전에 완료됩니다. 자세한 사용자 가이드는 작성자의   MQL5 블로그 에서 확인할 수 있습니다. 추가 업데이트는 작성자의   MQL5 채널 을 통해 제공됩니다. 현재 지원 정책에 따라 구매자는 저자가 개발한 선별된 보조 도구에 대한 추가 접근 권한을 받을 수 있습니다. Forex 쌍, 지수 및 암호화폐에서도 작동하지만, 감지 매개변수, 변동성 처리 및 필터 로직은 XAUUSD 특성에 최적화되어 있습니다.
Trend Lines PRO MT5
Roman Podpora
5 (1)
트렌드 라인즈 프로       이 지표는 시장이 실제로 어떤 방향으로 전환되는지 파악하는 데 도움이 됩니다. 실제 추세 반전 지점과 주요 시장 참여자들이 다시 진입하는 지점을 보여줍니다. 보시다시피       BOS 라인       복잡한 설정이나 불필요한 노이즈 없이 더 높은 시간대의 추세 변화와 주요 레벨을 확인할 수 있습니다. 신호는 차트에 다시 그려지지 않고 캔들이 마감된 후에도 계속 표시됩니다. MT4 버전   -   RFI LEVELS PRO   표시기   와 결합 시 최대 잠재력을 발휘합니다. 지표가 보여주는 내용: 실제 변화       추세(BOS 라인) 한 번 신호가 나타나면 그 신호는 계속 유효합니다! 이는 신호를 발생시킨 후 변경될 수 있는 리페인팅 방식의 지표와 중요한 차이점입니다. 리페인팅 방식의 지표는 잠재적으로 자금 손실로 이어질 수 있습니다. 이제 더욱 높은 확률과 정확도로 시장에 진입할 수 있습니다. 또한 화살표가 나타난 후 목표가(익절)에 도달하거나
PZ Trend Trading MT5
PZ TRADING SLU
3.8 (5)
Capture every opportunity: your go-to indicator for profitable trend trading Trend Trading is an indicator designed to profit as much as possible from trends taking place in the market, by timing pullbacks and breakouts. It finds trading opportunities by analyzing what the price is doing during established trends. [ Installation Guide | Update Guide | Troubleshooting | FAQ | All Products ] Trade financial markets with confidence and efficiency Profit from established trends without getting whip
필터:
Bijan Shj
20
Bijan Shj 2024.05.25 23:43 
 

사용자가 평가에 대한 코멘트를 남기지 않았습니다

리뷰 답변