• 미리보기
  • 리뷰 (32)
  • 코멘트 (35)
  • 새 소식

AW Classic MACD MT5

4.55

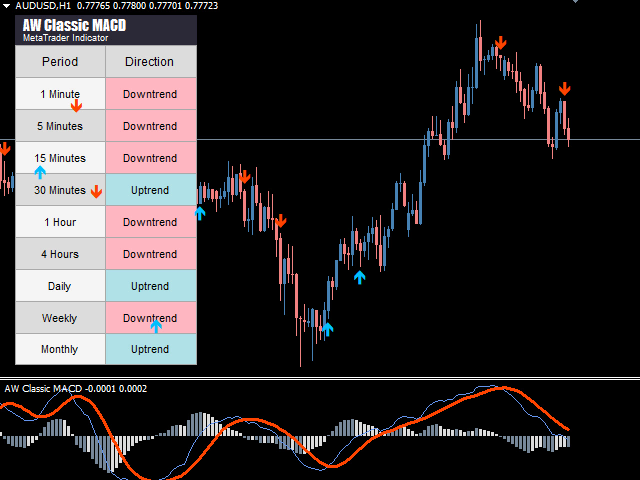
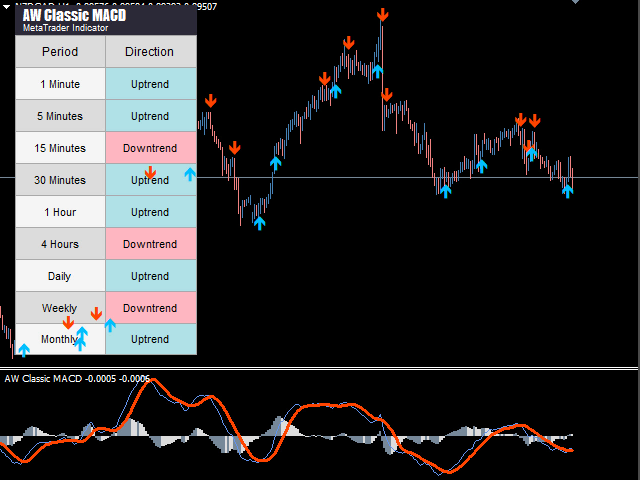
Modified oscillator MACD. A classic indicator that combines a trend indicator with an oscillator to detect entry points. Has a multi-timeframe panel and 3 types of notifications


Benefits:

  • Works on all instruments and timeseries
  • Trend indicator with   oscillator for inputs
  • Multi-period panel on all timeframes
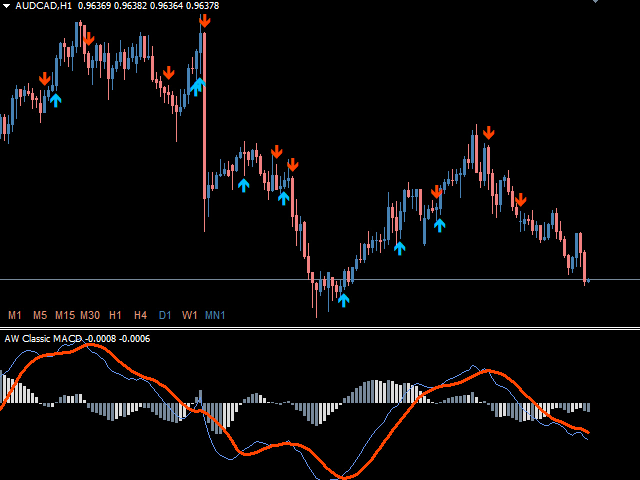
  • Pluggable arrows when signals appear
  • Three types of notifications: push, email, alert


MT4 version -> HERE / Our news -> HERE  


How the indicator works:

AW Classic MACD - Indicator of moving convergence or divergence, consists of two moving averages and a histogram.


Moving average lines:

- The blue thin line is the main fast line
- The red thick line is the signal, slow line

    The indicator lines are displayed in a separate window, they are not located on the chart, moving averages move relative to zero, and not relative to current prices.

    When two moving averages cross, a signal from the indicator will be received.

    When the blue line is above the red one is an uptrend, the red line is above the blue one is a downtrend.


    Bar graph:

    - The size of the histogram increases - it means that the current trend is strengthening, while the histogram turns dark
    - The size of the histogram decreases - means the end of the current dynamics, the color of the histogram changes to a lighter

      The histogram shows the ratio of the indicator lines to each other. The closer the lines are to each other, the shorter the histogram line. The further the indicator lines are from each other, the longer the line in the histogram.

      - The histogram is above the "0" mark - an upward trend
      - The histogram below the "0" mark - a downtrend


        Signals:

        1. Zero Level:

        - The blue line of the indicator crossed the "0" mark from bottom to top (that is, it was less than zero, and then became larger) - a buy signal
        - The blue line of the indicator crossed the "0" mark from top to bottom (was more than zero, and then dropped below zero) - a sell signal

          2. Cross Lines:

          - The main (blue) line crossed the signal (red) line from bottom to top - a buy signal
          - The main (blue) line crossed the signal (red) line from top to bottom - a sell signal

            3. When the histogram is below the "0" mark - this is a downtrend, the histogram is above the "0" mark - an uptrend


            Input settings:

            MAIN SETTINGS 

            Fast ema period MACD - period of the fast (blue) moving average

            Slow ema period MACD - period of the slow (red) moving average

            Signal period MACD - Signal moving period, not displayed on the chart, used for calculations

            Applied price MACD - The price used for indicator calculations

            Max Bars - The maximum number of candles on which the indicator will be calculated

            Signals Type - Adjust the display of signals
            - Both Signals - Both types of signals
            - Zero Level - Signals at zero crossing
            - Cross Lines - Signals at the intersection of slow and fast moving averages

              NOTIFICATIONS SETTINGS

              Notification candle number - Select on which candle to display notifications (0 - the current candle, 1 - work at the closing prices, then work on the previous candle)

              Send Push Notification - Use notifications of new signals to the mobile version of the trader's terminal

              Send Pop Up Alert - Use pop-up notifications

              Send Email - Use sending letters about the appearance of signals to the trader's e-mail

                GRAPHICS SETTINGS

                Multitimeframe dashboard - Panel display view, minimized or full

                Font size in panel - Text size in the indicator panel

                Y offset - move the multi-frame panel along the Y axis

                X offset - move the multi-frame panel along the X axis

                Uptrend Color Panel - Color of the upward direction in the panel

                Downtrend Color Panel - Color of the downward direction in the panel

                Up Color Main Panel - Color of the uptrend in the panel

                Down Color Main Panel - Color of the downtrend in the panel

                Buy Signal Color - Arrow color when a buy signal arrives

                Sell Signal Color - Color of the arrow when a sell signal arrives


                  Support:

                  We are happy to provide our developments for free, but due to the limited time available, all free products are provided without any support.

                  Thank you for understanding.


                  리뷰 20
                  Gloria Sarpong
                  724
                  Gloria Sarpong 2024.04.08 15:15 
                   

                  great

                  G Trader
                  24
                  G Trader 2023.10.02 22:43 
                   

                  This is just what I was looking for as it gives you both the Signal Line and the Main Line, which is very important. Only annoying thing is changing the colours and thickness of the lines doesn't always work, but no big deal especially considering it is free. Many thanks to the developer!

                  Mutamanakiri
                  25
                  Mutamanakiri 2023.07.03 16:30 
                   

                  good indicator. But I am wondering how to access the information on the panel to use this in an EA

                  추천 제품
                  News Clock
                  Victor Klenov
                  The professional   browser  of News and Trading Sessions is now available in MetaTrader 5. Now all the most important market information is collected on one dial! News located on the Time scale. Planning your working time has never been so easy and convenient ... The news scale can be switched a day, two, a week, a month forward or backward (see the details in the short video). All news updates in real time. Thanks to the built-in filters, you can configure the display of news by importanc
                  IVolX 2 DPOC mt5
                  Denis Chebatarev
                  Vol 2 DPOC volume vol 2 DOC-dynamic horizontal volume indicator for any time periods Main settings of the indicator: Volume Source -selecting data for volumes (tick or real) DPOCOn -enabling / disabling the indicator DPOCFrom -calculation start date DPOCTo -settlement end date The indicator allows you to manually select areas on the chart to analyze changes in the maximum volume over time. You can do this by using vertical lines and moving them along the chart. Or by setting specific dates
                  Marker Lines of Day
                  Luis Paulo Rodrigues Pastor
                  4 (1)
                  Indicator that allows the maximum and minimum of days to be marked, with real time update, closing of the previous day and beginning of the day. It is possible to define which markings will be made and also the colors for each mark.      The values ​​of each tick are displayed in the upper left corner of the screen, below the trading panel within the chart.      Maximum and Minimum of the Day and Closing of the Previous Day are marked with a horizontal line, while the beginning of the day with a
                  FREE
                  This system is good at identifying short term reversals in the market. It is based on a machine learning study on market structure, and can be a great tool to scan the market or direct trades. With everything, there isn't a 100% win-rate, but this indicator is sometimes always accurate.   When it thinks a reversal will happen, it will color the candle a specific color, draw an arrow and then alert you on whether to buy or sell the upcoming candle.   Simple Setup Drag and drop onto any chart, at
                  MAs Multi Tiempo
                  Juan Manuel Rojas Perez
                  El indicador técnico propuesto es un sistema de medias móviles de múltiples marcos temporales diseñado para ayudar a los operadores del mercado financiero a seguir de cerca los movimientos tendenciales. Al combinar medias móviles de diferentes períodos, este indicador ofrece una visión más completa de la dirección de la tendencia, lo que permite a los traders identificar oportunidades de trading con mayor precisión. Al utilizar este indicador, los operadores pueden maximizar sus ganancias al tom
                  FREE
                  Ultimate Trend Trader MT5
                  Thibauld Charles Ghislain Robin
                  Embrace the Power With Ultimate Trend Trader Indicator. Facing the reality of individual traders, we are far from harnessing the capabilities of AI and high-frequency trading algorithms that dominate today's markets. Without access to massive data centers or infrastructure to compete on microseconds, the battle seems skewed. Yet, the true advantage lies not in technological arms but in leveraging human intellect to outsmart the competition. The Ultimate Trend Trader Indicator embodies this appr
                  - This is an indicator of directional movement that allows you to determine the trend at the time of its inception and set the levels of a protective stop. Trailing can be carried out both from below, when the stop level is below the current price and is pulled up behind the price if it increases, and above, when stop levels are above the current price. Unlike trailing with a constant distance, the stop level is set at the lower boundary of the quadratic regression channel (in the case of t
                  SourcePoint是一个很好的中长线交易指示器,他能独立使用,也可以去其他趋势型指标独立使用,可以很好的指出最佳的buy和sell位置,指标不含有未来函数,不会重新绘制,不仅能够应用到自己的手动交易过程中,还能完全可以写入到自己的EA中。建议配合BS TrendLine( https://www.mql5.com/zh/market/product/96476?source=Site+Market+My+Products+Page ) 一起使用。 (如果你感觉到这个指标能够帮助你进行更准确的交易,请帮忙给个好评,希望我的作品能够帮助更多有需要的人) ===================参数列表===================== fastP: 12 slowP:26 avgP:9 =================参考使用方法=================== 此指标可以适用于任何交易品种,能够用在任何周期。 每次形成一个交点,就是一个交易机会,同时也是一个持仓平仓点位。建议配合大小周期一起使用,这样更容易让你找到更精准的入场位置和出场位置
                  This easy to setup indicator shows you the market volumes in a different way, with support and resistance as showed. You can setup: - Backdays volume to show - Heiken Ashi candle view It works for every kind of graph and every kind of period. The program shows the volumes based on the number of candles displayed in the chart: the more candles the more volumes. Enjoy this very useful indicator. Please feel free to message me to report any kind of improvements! :D
                  Trade Area
                  Jinsong Zhang
                  Most time the market is in a small oscillation amplitude. The Trade Area indicator helps users to recognize that time. There are 5 lines in this indicator: Area_high, Area_middle, Area_Low, SL_high and SL_low. Recommendations: When price is between Area_high and Area_Low, it's time to trade. Buy at Area_Low level and sell at Area_high level. The SL_high and SL_low lines are the levels for Stop Loss. Change the Deviations parameter to adjust SL_high and SL_low.
                  This Indicator is based on Mr. Dan Valcu ideas. Bodies of candles(open-close) are the main component used to indicate and assess trend direction, strength, and reversals. The indicator measures difference between Heikin Ashi close and open. Measuring the height of candle bodies leads to extreme values that point to trend slowdowns. Thus quantifies Heikin Ashi to get earlier signals. I used this indicator on Heiken Ashi charts but, it's possible to choose to calculate Body size based on
                  FREE
                  AdvancedCandleWrapper
                  Douglas Mbogo Ntongai
                  Draw as many custom candles as possible on a single chart with this special indicator. Your analysis skill will never be the same again for those who know the power that having a hawkeye view of all price action at once provides. Optimized for performance and allows customization on the appearance of candle bodies and wicks. This is an integral part of analysis at our desks, we hope it will never leave your charts too once you can use it to its full potential.
                  The third indicator from the set for market analysis. The first one is here:  https://www.mql5.com/ru/market/product/65258 The second one is here: https://www.mql5.com/ru/market/product/65347 The indicator builds a channel of maximum price fluctuations for a specified period. Additionally, the middle of the channel is drawn. All color settings, line types are customizable. The indicator allows you to see the picture of price movement from a slightly different angle. You can use several in
                  USA Indexes Quant Indicator
                  Thunder Investment Group Limited
                  Property of Vertical Capital Edition:  Gugol_Quants   About USA INDEXES QUANT_INDICATOR: This is a indicator created by math modulation to be used as a trading tool, which was developed in MQL. (MT5) This indicator is for use only with US500(S&P500), NAS100(Nasdaq Composite) and US30(Dow Jones). Signals are activated on "Open" Candle. It’s based on Intraday/Swing Trades whose main timeframe is H1, H2, H3 and H4. However you can use it with other assets by testing with the appropriate settings. *
                  FREE
                  Day Trade System
                  Nardus Van Staden
                  5 (1)
                  Introducing The Day Trader System: Your Shortcut to Day Trading Success! Are you a day trader seeking simplicity without compromising profitability? Look no further! We present The Day Trader System – your go-to solution for identifying lucrative opportunities in the fast-paced world of Forex. Simple Yet Powerful: The Day Trader System is a straightforward yet highly effective indicator designed exclusively for day traders. Say goodbye to complexity and hello to a system that simplifies
                  FREE
                  This indicator let user clearly see Buy/Sell signals. When a bar is closed and conditions meet, arrow signal will come up at Close Price, up is Buy and down is Sell. It works on all Timeframes. And you can set sound alert when signals come up.
                  The indicator determines a special pattern of Joe Dinapoli. It gives very high probability buy and sell signals. Indicator does not repaint. Indicator Usage Buy Signal ''B'' Entry : Market buy order at signal bar close Stop : Low of signal bar Take Profit : First swing high Sell Signal ''S'' Entry : Market sell order at signal bar close Stop : High of signal bar Take Profit : First swing low Indicator Parameters Fast EMA : External Parameter (should be kept as default) Slow EMA: External Param
                  AngleX
                  Hiroaki Mitsuta
                  移動平均線の傾斜角度をラベルに表示するだけのシンプルなインジケーターです。ラベルのフォントサイズ、色の調整、移動平均線の設定など全て行えます。また、移動平均線の傾斜角度というものは、MT5のウインドウサイズを変更すると、移動平均線自体の傾斜角度も変更されてしまうことをご了承ください。これは、インジケーターの仕様ではなく、移動平均線の傾斜角度というもの自体の仕様です。 また、MT5には、OnCalculateから値を取得してしまうと、インジケーターを削除する際にオブジェクトが残ってしまうという公式のバグが存在します。その為、当インジケーターでは、OnCalculateから移動平均線の傾斜角度の値を取得し、それを、OnTimer関数で1秒毎に評価し、オブジェクトに傾斜角度を出力しております。なので、傾斜角度の出力レベルはほぼティック毎と変わりませんことをご理解下さい。 また、今後のアップデートで、時間足毎に移動平均線の傾斜角度を評価できるようアップデートして参ります。
                  BinaWin NoTouch
                  Juan Fernando Urrego Alvarez
                  BinaWin NoTouch is an indicator that sends an alert signal when the trade is in the right position to wait for the breakdown of a side market. It is specially designed to trade under the “No Touch” strategy of the Binary.Com platform with synthetic indexes N.10, N.25, N.50, N.75 and N.100 Similarly, trading can be done with the conventional CALL and PUT strategy of any Binary Options platform. Requirements to use the indicator: 1. Have an account at Binary.Com 2. Configure the Binary.
                  FREE
                  Didi Index
                  Flavio Javier Jarabeck
                  4.77 (22)
                  The famous brazilian trader and analyst Didi Aguiar created years ago a study with the crossing of 3 Simple Moving Averages called "Agulhada do Didi", then later was also named Didi Index, as a separate indicator. The period of those SMAs are 3, 8 and 20. As simple as that, this approach and vision bring an easy analysis of market momentum and trend reversal to those traders looking for objective (and visual) information on their charts. Of course, as always, no indicator alone could be used wit
                  FREE
                  PAX BDB Trade Chaos system of Bill Williams   (Bearish/Bullish divergent bar). One of the signals of the "Trade Chaos" system of Bill Williams. (First wiseman) When bar moving away from the  "Alligator" indicator and there is divergence on the Awesome Oscillator indicator, it shows a potential point of movement change. It is based on the opening/closing of the bar, the position relative to the previous ones, the Alligator and AO. When trading, the entrance is at the breakthrough of the bar(sh
                  RSImaxmin
                  Carlos Andrés Moya Erazo
                  4.5 (10)
                  The indicator shows when there are overprice and divergences on the RSI. In addition, it has configurable alerts, dynamic overprice levels and a special “RSI cleaner” function. The indicator that automatically calculates the premium rates! RSImaxmin is an indicator based on the Relative Strength Index (RSI) oscillator that effectively identifies changes in price trends as it reflects the relative strength of bullish movements compared to bearish movements. It is widely used by traders to measur
                  DeltaBook
                  Thalles Nascimento De Carvalho
                  델타 북(Delta Book) 지표는 주식, 선물 및 암호화폐와 같은 금융 시장에서 가격 흐름을 감지하기 위해 볼륨 델타와 오더북(order book) 정보를 결합하는 강력한 시장 분석 도구입니다. 델타 북은 그 최대 잠재력을 실현하기 위해 실시간 볼륨 데이터와 오더북 정보에 액세스해야 한다는 점을 주목해야 합니다. 델타 북의 주요 특징은 시장 참가자의 행동에 대한 상세한 정보를 기반으로 트렌드와 거래 기회를 식별할 수 있는 고급 시장 분석 전략입니다. 델타 북 지표를 설명하기 위한 몇 가지 팁과 중요한 측면은 다음과 같습니다: 볼륨 델타: 볼륨 델타는 특정 시간 내에 매수(수요)와 매도(공급)된 볼륨의 차이입니다. 이 지표는 매수자와 매도자 간의 불균형을 양적으로 나타내며 시장에서 매수 및 매도 압력의 변화를 식별하는 데 도움을 줍니다. 오더북: 오더북은 시장에서 모든 매수 및 매도 주문의 실시간 레코드입니다. 이것은 트레이더들이 자산을 구매하고 판매하려는 가격 및 해당 가격에서
                  This Indicator adding power to traditional zigzag indicator. With High-Low numbers in vision it will be easier to estimate change of trend by knowing the depth of each wave. Information including points, pips, percentage%, and #bars can be displayed based on configuration. All information is real-time update. This indicator is especially useful in sideway market to buy low sell high.
                  The indicator helps to enter a trade following the trend, at the same time, after some correction. It finds strong trending movements of a currency pair on a given number of bars, and also finds correction levels to this trend. If the trend is strong enough, and the correction becomes equal to the one specified in the parameters, then the indicator signals this. You can set different correction values, 38, 50 and 62 (Fibonacci levels) are better. In addition, you can set the minimum trend lengt
                  Xtrade Trend Detector
                  Dago Elkana Samuel Dadie
                  Xtrade Trend Detector is an indicator capable of finding the best opportunities to take a position in any stock market. Indeed, it is a great tool for scalpers but also for Daytraders. You could therefore use it to identify areas to trade, it fits easily on a chart. I use it to detect trends on Big timeframes and take positions on Small timeframes. Don't hesitate to give me a feedback if you test it.
                  ShortBS
                  Yan Qi Zhu
                  ShortBS是一个很好的短线交易指示器,能很好与 BestPointOfInitiation ( https://www.mql5.com/zh/market/product/96671 )配合,能让你找到最合适的buy和sell位置,指标不含有未来函数,不会重新绘制。是一个针对(如果你感觉到这个指标能够帮助你进行更准确的交易,请帮忙给个好评,希望我的作品能够帮助更多有需要的人) ===================参数列表===================== maPeriod: 25 slowPeriod:20 fastPeriod:10 stepPeriod:5 =================参考使用方法=================== 此指标可以适用于任何交易品种,能够用在任何周期。
                  Setup 92 Larry Williams
                  Luigi Nunes Labigalini
                  Buy and sell signals based on Larry Williams's exponential moving average strategy Setup 9.2 for trend continuation. How does it work? The indicator activates the buy signal when a candle closes below the previous low while maintaining the 9 period EMA's upwards.  For a sell signal, we need a candle closing above the previous high while maintaining the 9 period EMA's downwards. How to use it? One way of using it, proposed by Larry Williams, is to enter a trade with a buy stop order one ti
                  ClearArrows MT5
                  Pavel Krysanov
                  For any trader, the result of market analysis is the correct determination of entry and exit points from the market. The ClearArrows indicator does not display any unnecessary information that may distract or mislead the trader, but only the most important thing. The indicator is very easy to use, when a down arrow appears, you need to open a SELL deal, when an up arrow appears you need to open a BUY deal. The ClearArrows indicator, despite its outward simplicity, has a large analytical algor
                  이 제품의 구매자들이 또한 구매함
                  우선 이 거래 시스템이 리페인팅, 리드로잉 및 레이그 인디케이터가 아니라는 점을 강조하는 것이 중요합니다. 이는 수동 및 로봇 거래 모두에 이상적인 것으로 만듭니다. "스마트 트렌드 트레이딩 시스템 MT5"은 새로운 및 경험이 풍부한 트레이더를 위해 맞춤형으로 제작된 종합적인 거래 솔루션입니다. 10개 이상의 프리미엄 인디케이터를 결합하고 7개 이상의 견고한 거래 전략을 특징으로 하여 다양한 시장 조건에 대한 다목적 선택이 가능합니다. 트렌드 추종 전략: 효과적인 트렌드 추이를 타기 위한 정확한 진입 및 손절 관리를 제공합니다. 반전 전략: 잠재적인 트렌드 반전을 식별하여 트레이더가 범위 시장을 활용할 수 있게 합니다. 스캘핑 전략: 빠르고 정확한 데이 트레이딩 및 단기 거래를 위해 설계되었습니다. 안정성: 모든 인디케이터가 리페인팅, 리드로잉 및 레이그가 아니므로 신뢰할 수 있는 신호를 보장합니다. 맞춤화: 개별 거래 선호도를 고려한 맞춤형 전략을 지원합니다. 최상의 전략을 찾는
                  Atomic Analyst MT5
                  Issam Kassas
                  5 (11)
                  우선적으로 언급할 점은이 거래 지표가 다시 그리지 않고 지연되지 않으며 이를 통해 수동 및 로봇 거래 모두에 이상적이라는 점입니다. Atomic Analyst는 가격의 강도와 모멘텀을 활용하여 시장에서 더 나은 이점을 찾는 PA Price Action Indicator입니다. 고급 필터를 장착하여 잡음과 거짓 신호를 제거하고 거래 잠재력을 높이는 데 도움이 됩니다. 복잡한 지표의 다중 레이어를 사용하여 Atomic Analyst는 차트를 스캔하고 복잡한 수학적 계산을 간단한 신호와 색상으로 변환하여 초보 트레이더가 이해하고 일관된 거래 결정을 내릴 수 있도록합니다. "Atomic Analyst"는 새로운 및 경험이 풍부한 트레이더를위한 종합적인 거래 솔루션입니다. 프리미엄 지표와 최고 수준의 기능을 하나의 거래 전략에 결합하여 모든 종류의 트레이더에 대한 다재다능한 선택지가되었습니다. 인트라데이 거래 및 스캘핑 전략 : 빠르고 정확한 일일 거래 및 단기 거래를 위해 설계
                  FX Volume MT5
                  Daniel Stein
                  4.94 (17)
                  모닝 브리핑을 통해 세부 정보와 스크린샷으로 매일 시장 업데이트를 받으세요 여기 mql5 및 텔레그램에서 FX 거래량은 브로커의 관점에서 시장 심리에 대한 실제 통찰력을 제공하는 최초이자 유일한 거래량 지표입니다. 브로커와 같은 기관 시장 참여자가 외환 시장에서 어떤 포지션을 취하고 있는지에 대한 훌륭한 통찰력을 COT 보고서보다 훨씬 빠르게 제공합니다. 차트에서 이 정보를 직접 확인하는 것은 트레이딩의 진정한 판도를 바꾸고 획기적인 솔루션입니다. 다음과 같은 고유한 시장 데이터 인사이트의 이점 비율 는 통화의 매수/매도 포지션 비율을 백분율로 표시 비율 변화 는 선택한 기간 내 매수 비율과 비율 변화를 표시 총 거래량 는 해당 통화의 총 거래량(롱 및 숏)을 로트 단위로 보여줍니다 Volumes Long 는 해당 통화의 모든 롱 포지션의 거래량을 보여줍니다 Volumes Short 는 해당 통화의 모든 숏 포지션의 거래량을 보여줍니다 Net Long 는 순 롱 포지션의 거래량
                  Quantum Trend Sniper
                  Bogdan Ion Puscasu
                  5 (37)
                  소개       Quantum Trend Sniper Indicator는   추세 반전을 식별하고 거래하는 방식을 변화시키는 획기적인 MQL5 지표입니다! 13년 이상의 거래 경험을 가진 숙련된 트레이더 팀이 개발한       Quantum Trend Sniper 표시기       매우 높은 정확도로 추세 반전을 식별하는 혁신적인 방법으로 거래 여정을 새로운 차원으로 끌어올리도록 설계되었습니다. ***Quantum Trend Sniper Indicator를 구입하면 Quantum Breakout Indicator를 무료로 받을 수 있습니다!*** Quantum Trend Sniper Indicator는 추세 반전을 식별하고 세 가지 이익실현 수준을 제안할 때 경고, 신호 화살표를 제공합니다. 초보자 거래자와 전문 거래자 모두에게 적합합니다. Quantum EA 채널:       여기를 클릭하세요 MT4 버전:       여기를 클릭하세요
                  Gold Stuff mt5
                  Vasiliy Strukov
                  4.89 (166)
                  Gold Stuff mt5는 금을 위해 특별히 설계된 추세 지표이며 모든 금융 상품에서도 사용할 수 있습니다. 표시기가 다시 그려지지 않고 지연되지 않습니다. 권장 기간 H1. 설정 및 개인 보너스를 받으려면 구매 후 즉시 저에게 연락하십시오!   설정 화살표 그리기 - 켜기 끄기. 차트에 화살표 그리기. 경고 - 가청 경고를 끕니다. 이메일 알림 - 켜기 끄기. 이메일 알림. Puch-notification - 켜기 끄기. 푸시 알림. 다음으로 색 영역을 조정합니다. Gold Stuff mt5는 금을 위해 특별히 설계된 추세 지표이며 모든 금융 상품에서도 사용할 수 있습니다. 표시기가 다시 그려지지 않고 지연되지 않습니다. 권장 기간 H1. 설정 및 개인 보너스를 받으려면 구매 후 즉시 저에게 연락하십시오!   설정 화살표 그리기 - 켜기 끄기. 차트에 화살표 그리기. 경고 - 가청 경고를 끕니다. 이메일 알림 - 켜기 끄기. 이메일 알림. Puch-noti
                  Trend Screener Pro MT5
                  STE S.S.COMPANY
                  4.89 (61)
                  트렌드 표시기, 트렌드 트레이딩 및 필터링을 위한 획기적인 고유 솔루션, 하나의 도구 안에 내장된 모든 중요한 트렌드 기능! Forex, 상품, 암호 화폐, 지수 및 주식과 같은 모든 기호/도구에 사용할 수 있는 100% 다시 칠하지 않는 다중 시간 프레임 및 다중 통화 표시기입니다. Trend Screener는 차트에 점이 있는 화살표 추세 신호를 제공하는 효율적인 지표 추세 추종 지표입니다. 추세 분석기 표시기에서 사용할 수 있는 기능: 1. 트렌드 스캐너. 2. 최대 이익 분석이 있는 추세선. 3. 추세 통화 강도 측정기. 4. 경고가 있는 추세 반전 점. 5. 경고가 있는 강력한 추세 점. 6. 추세 화살표 Trend Screener Indicator가 있는 일일 분석 예, 일일 신호 성능...등은 여기에서 찾을 수 있습니다. 여기를 클릭하십시오. LIMITED TIME OFFER : Trend Screener Indicator는 50$ 및 평생 동안만 사용할 수 있습니다
                  FX Power MT5 NG
                  Daniel Stein
                  5 (4)
                  모닝 브리핑 여기 mql5 와 텔레그램에서 FX Power MT5 NG 는 오랫동안 인기 있는 통화 강도 측정기인 FX Power의 차세대 버전입니다. 이 차세대 강도 측정기는 무엇을 제공합니까? 기존 FX Power에서 좋아했던 모든 것 PLUS GOLD/XAU 강도 분석 더욱 정밀한 계산 결과 개별 구성 가능한 분석 기간 더 나은 성능을 위한 사용자 정의 가능한 계산 한도 특별 멀티더 많은 것을보고 싶은 사람들을위한 특별한 다중 인스턴스 설정 모든 차트에서 좋아하는 색상을위한 끝없는 그래픽 설정 수많은 알림 옵션, 중요한 것을 다시는 놓치지 않도록 Windows 11 및 macOS 스타일의 둥근 모서리가 있는 새로운 디자인 마법처럼 움직이는 인디케이터 패널 FX 파워 키 특징 모든 주요 통화의 완전한 강세 이력 모든 시간대에 걸친 통화 강세 이력 모든 브로커 및 차트에서 고유 계산 결과 100% 신뢰할 수있는 실시간100 % 신뢰할 수있는 실시간 계산-> 다시 칠하지 않음
                  Entry Points Pro for MT5
                  Yury Orlov
                  4.54 (157)
                  다시 색을 칠하지 않고 거래에 진입할 수 있는 정확한 신호를 제공하는 MT5용 지표입니다. 외환, 암호화폐, 금속, 주식, 지수 등 모든 금융 자산에 적용할 수 있습니다. 매우 정확한 추정값을 제공하고 매수와 매도의 가장 좋은 시점을 알려줍니다. 하나의 시그널로 수익을 내는 지표의 예와 함께 비디오 (6:22)시청하십시오! 대부분의 거래자는 Entry Points Pro 지표의 도움으로 첫 거래 주 동안 트레이딩 결과를 개선합니다. 저희의   Telegram Group 을 구독하세요! Entry Points Pro 지표의 좋은점. 재도색이 없는 진입 신호 신호가 나타나고 확인되면(시그널 캔들이 완성된 경우) 신호는 더 이상 사라지지 않습니다. 여타 보조지표의 경우 신호를 표시한 다음 제거되기 때문에 큰 재정적 손실로 이어집니다. 오류 없는 거래 게시 알고리즘을 통해 트레이드(진입 또는 청산)를 할 이상적인 순간을 찾을 수 있으며, 이를 통해 이를 사용하는 모든 거래자의
                  우선적으로, 이 거래 도구는 전문적인 거래에 이상적인 비-다시 그리기 및 지연되지 않는 지표입니다.  스마트 가격 액션 컨셉트 인디케이터는 신규 및 경험 많은 트레이더 모두에게 매우 강력한 도구입니다. Inner Circle Trader Analysis 및 Smart Money Concepts Trading Strategies와 같은 고급 거래 아이디어를 결합하여 20가지 이상의 유용한 지표를 하나로 결합합니다. 이 인디케이터는 스마트 머니 컨셉트에 중점을 두어 대형 기관의 거래 방식을 제공하고 이동을 예측하는 데 도움을 줍니다.  특히 유동성 분석에 뛰어나 기관이 어떻게 거래하는지 이해하는 데 도움을 줍니다. 시장 트렌드를 예측하고 가격 변동을 신중하게 분석하는 데 탁월합니다. 귀하의 거래를 기관 전략에 맞추어 시장의 동향에 대해 더 정확한 예측을 할 수 있습니다. 이 인디케이터는 시장 구조를 분석하고 중요한 주문 블록을 식별하고 다양한 패턴을 인식하는 데 뛰어납니다. 
                  RelicusRoad Pro MT5
                  Relicus LLC
                  4.82 (22)
                  이제 $ 147 (몇 가지 업데이트 후 $ 499 증가) - 무제한 계정 (PCS 또는 MACS) RelicusRoad 사용 설명서 + 교육 비디오 + 비공개 Discord 그룹 액세스 + VIP 상태 시장을 보는 새로운 방법 RelicusRoad는 외환, 선물, 암호화폐, 주식 및 지수에 대한 세계에서 가장 강력한 거래 지표로서 거래자에게 수익성을 유지하는 데 필요한 모든 정보와 도구를 제공합니다. 우리는 초보자부터 고급까지 모든 거래자가 성공할 수 있도록 기술적 분석 및 거래 계획을 제공합니다. 미래 시장을 예측할 수 있는 충분한 정보를 제공하는 핵심 거래 지표입니다. 우리는 차트에서 말이 안 되는 여러 지표 대신 완전한 솔루션을 믿습니다. 타의 추종을 불허하는 매우 정확한 신호, 화살표 + 가격 조치 정보를 표시하는 올인원 표시기입니다. 강력한 AI를 기반으로 하는 RelicusRoad는 누락된 정보와 도구를 제공하여 교육하고 성공적인 트레이더인 트레이딩 전문
                  Auto Order Block with break of structure based on ICT and Smart Money Concepts Futures Break of Structure ( BoS )             Order block ( OB )            Higher time frame Order block / Point of Interest ( POI )    shown on current chart           Fair value Gap ( FVG ) / Imbalance   ,  MTF      ( Multi Time Frame )    Volume Imbalance     ,  MTF          vIMB Gap’s Equal High / Low’s     ,  MTF             EQH / EQL Liquidity               Current Day High / Low           HOD /
                  XQ Indicator MetaTrader 5
                  Marzena Maria Szmit
                  5 (1)
                  Step into the realm of Forex trading with confidence and precision using XQ, a cutting-edge Forex indicator designed to elevate your trading game to unprecedented heights. Whether you're a seasoned trader or just stepping into the world of currency exchange, XQ Forex Indicator empowers you with the insights and signals needed to make informed trading decisions. The signal conditions are a combination of three indicators, and XQ Forex Indicator only display  medium and long-term trends . The ind
                  Blahtech Supply Demand MT5
                  Blahtech Limited
                  4.57 (14)
                  Was: $299  Now: $99   Supply Demand uses previous price action to identify potential imbalances between buyers and sellers. The key is to identify the better odds zones, not just the untouched ones. Blahtech Supply Demand indicator delivers functionality previously unavailable on any trading platform. This 4-in-1 indicator not only highlights the higher probability zones using a multi-criteria strength engine, but also combines it with multi-timeframe trend analysis, previously confirmed swings
                  Advanced Supply Demand MT5
                  Bernhard Schweigert
                  4.53 (15)
                  현재 33% 할인! 초보자나 전문 트레이더를 위한 최고의 솔루션! 이 보조지표는 우리가 다수의 독창적 기능과 새로운 공식을 통합한 독특하고 고품질이며 저렴한 거래 도구입니다. 이 업데이트를 통해 이중 시간대를 표시할 수 있습니다. 더 높은 TF를 표시할 수 있을 뿐만 아니라 차트 TF와 더 높은 TF 모두를 표시할 수 있습니다: 중첩 영역 표시. 모든 Supply Demand 트레이더들이 좋아할 것입니다. :) 중요한 정보 공개 Advanced Supply Demand의 잠재력을 극대화하려면 다음을 방문하십시오. https://www.mql5.com/ko/blogs/post/720245   진입 또는 목표의 명확한 트리거 포인트를 정확히 찾아냄으로 해서 거래가 어떻게 개선될지 상상해 보십시오. 새로운 알고리즘을 기반으로 매수자와 매도자 간의 잠재적인 불균형을 훨씬 더 쉽게 분간할 수 있습니다. 왜냐하면 가장 강한 공급영역과 가장 강한 수요 영역과 과거에 어떻게 진행 되었는지를(이
                  AW Trend Predictor MT5
                  AW Trading Software Limited
                  4.76 (54)
                  하나의 시스템에서 추세와 고장 수준의 조합입니다. 고급 지표 알고리즘은 시장 노이즈를 필터링하고 추세, 진입점 및 가능한 출구 수준을 결정합니다. 표시기 신호는 통계 모듈에 기록되어 가장 적합한 도구를 선택하여 신호 기록의 효율성을 보여줍니다. 이 표시기는 이익 실현 및 손절매 표시를 계산합니다. 매뉴얼 및 지침 ->   HERE   / MT4 버전 ->   HERE 지표로 거래하는 방법: Trend Predictor로 거래하는 것은 3단계로 간단합니다. 1단계 - 포지션 열기 70% 이상의 성공률로 매수 신호를 받았습니다. 2단계 - StopLoss 결정 반대 신호로 트렁크 선택 3단계 - 이익 실현 전략 정의 전략 1: TP1 도달 시 전체 포지션 청산 전략 2: TP1 도달 시 포지션의 50% 청산 및 TP2 도달 시 나머지 50% 청산 전략 3: 추세 반전 시 전체 포지션 청산 이익: 결과를 다시 그리지 않음, 신호는 엄격하게 양초가 닫힐 때 어드바이저에서 사용할 수 있습니
                  ICT, SMC, SMART MONEY CONCEPTS, SMART MONEY, Smart Money Concept, Support and Resistance, Trend Analysis, Price Action, Market Structure, Order Blocks, BOS/CHoCH,   Breaker Blocks ,  Momentum Shift,   Supply&Demand Zone/Order Blocks , Strong Imbalance,   HH/LL/HL/LH,    Fair Value Gap, FVG,  Premium  &   Discount   Zones, Fibonacci Retracement, OTE, Buy Side Liquidity, Sell Side Liquidity, BSL/SSL Taken, Equal Highs & Lows, MTF Dashboard, Multiple Time Frame, BigBar, HTF OB, HTF Market Structure
                  TPSproTREND PrO MT5
                  Roman Podpora
                  5 (5)
                  TPSpro TRENDPRO  - is a trend indicator that automatically analyzes the market and provides information about the trend and each of its changes, as well as giving signals for entering trades without redrawing! The indicator uses each candle, analyzing them separately. referring to different impulses - up or down impulse. Exact entry points into transactions for currencies, crypto, metals, stocks, indices!  -  Version MT4                  DETAILED DESCRIPTION        /       TRADING SETUPS       
                  ON Trade Gann Squares MT5
                  Abdullah Alrai
                  5 (1)
                  간 스퀘어 지표는 W.D. 간이 쓴 "시장 예측을 위한 수학적 공식" 기사에 기반한 강력한 시장 분석 도구입니다. 이 도구는 수학적 개념과 간 이론을 사용하여 정확한 시장 분석을 수행합니다. 144, 90, 52의 제곱과 9의 제곱을 사용합니다. 또한 의 9의 제곱근 및 해당 제곱의 채널 및 스타 패턴과의 관련성을 통합합니다. 사용자 메뉴얼 및 적용: 이 지표를 사용하기 전에 사용자 메뉴얼을 읽고 질문이 있을 경우 문의하시기 바랍니다. 전체 메뉴얼은 웹사이트에서 제공됩니다. MT5의 전체 버전을 구매하거나 MT4의 무료 버전을 테스트할 수 있습니다. 두 버전 모두 링크에서 확인하실 수 있습니다. 주요 기능 및 기능: 간 스퀘어 지표는 정확한 결정을 위해 기하학적 개념과 간 이론을 활용하는 시장 분석을 위한 포괄적인 도구 집합을 제공합니다. 주요 기능은 다음과 같습니다. 9의 제곱 분석:   이 지표는 9의 제곱에 대한 수평 선, 스타 패턴, 그리드 및 간 팬을 그릴 수 있습니다. 간
                  가격이 역전되고 후퇴함에 따라 시장 구조가 변경됩니다. 시장 구조 반전 경고 표시기는 추세 또는 가격 움직임이 고갈에 가까워지고 반전할 준비가 되었음을 식별합니다. 일반적으로 반전이나 큰 하락이 일어나려고 할 때 발생하는 시장 구조의 변화를 알려줍니다. 지표는 가능한 고갈 지점 근처에서 새로운 고점 또는 저점이 형성될 때마다 초기에 돌파와 가격 모멘텀을 식별합니다. 표시기는 반대쪽에 있는 마지막 촛불에 직사각형을 그립니다. 그런 다음 현재의 단기 추세에서 계속 움직이기 때문에 가격과 함께 직사각형을 따라갈 것입니다. 가격이 사각형 위나 아래로 다시 닫힐 정도로 약해지면 시장 구조에 잠재적인 변화가 일어나고 있음을 나타냅니다. 그런 다음 표시기는 방향의 잠재적인 이동과 추세 또는 주요 하락의 가능한 반전 시작에 대해 경고합니다. 작동 방식을 보려면 아래의 작동 표시기를 참조하십시오! 모든 쌍 및 주요 기간을 모니터링하는 대시보드: https://www.mql5.com/
                  차트에 지지 및 저항 수준과 추진 캔들 갭을 자동으로 그려주므로 다음 가격 방향 및/또는 잠재적 반전 가능성을 확인할 수 있습니다. 이 보조지표는 제 웹사이트(시장 구조 트레이더)에서 가르치는 포지션 트레이딩 방법론의 일부로 사용하도록 설계되었으며 타겟팅 및 잠재적 진입을 위한 주요 정보를 표시합니다. MT4 Version:  https://www.mql5.com/en/market/product/97246/ 이 보조지표에는 2가지 핵심 기능과 4가지 추가 기능이 있습니다: 핵심 기능 1 - 일일, 주간 및 월간 시간대의 자동 지지선 및 저항선 이 인디케이터는 지난 2일에서 최대 6주 및 몇 달 전의 가장 최근 지원 및 저항 수준을 자동으로 가져옵니다. 이러한 레벨의 모양을 원하는 대로 완전히 사용자 지정하고 표시되는 레벨 수를 표시할 수 있습니다. 이러한 주요 레벨은 종종 가격이 하락하거나 반전되는 주요 지지 및 저항 구간으로 작용합니다. 또한 가격이 향할 목표가 되기도 하므로
                  TPSpro RFI Levels MT5
                  Roman Podpora
                  5 (5)
                  A key element in trading is zones or levels from which decisions to buy or sell a trading instrument are made. Despite attempts by major players to conceal their presence in the market, they inevitably leave traces. Our task was to learn how to identify these traces and interpret them correctly. Reversal First Impulse levels (RFI)   -  Version MT4                  INSTRUCTIONS                 RUS                 ENG                         R ecommended to use with an indicator   -  TREND PRO  
                  소개       Quantum Breakout PRO   , 브레이크아웃 존 거래 방식을 변화시키는 획기적인 MQL5 지표! 13년 이상의 거래 경험을 가진 숙련된 트레이더 팀이 개발한       퀀텀 브레이크아웃 PRO       혁신적이고 역동적인 브레이크아웃 존 전략으로 거래 여정을 새로운 차원으로 끌어올리도록 설계되었습니다. Quantum Breakout Indicator는 5개의 이익 목표 영역이 있는 브레이크아웃 영역의 신호 화살표와 브레이크아웃 상자를 기반으로 한 손절 제안을 제공합니다. 초보자 거래자와 전문 거래자 모두에게 적합합니다. Quantum EA 채널:       여기를 클릭하세요 중요한! 구매 후 설치 매뉴얼을 받으려면 개인 메시지를 보내주십시오. 추천: 기간: M15 통화쌍: GBPJPY, EURJPY, USDJPY,NZDUSD, XAUUSD 계정 유형: 스프레드가 매우 낮은 ECN, Raw 또는 Razor 브로커 시간: GM
                  Volume by Price MT5
                  Brian Collard
                  5 (3)
                  The Volume by Price Indicator for MetaTrader 5 features Volume Profile and Market Profile TPO (Time Price Opportunity). Get valuable insights out of currencies, equities and commodities data. Gain an edge trading financial markets. Volume and TPO histogram bar and line charts. Volume Footprint charts. TPO letter and block marker charts including split structures. Versatile segmentation and compositing methods. Static, dynamic and flexible ranges with relative and/or absolute visualizations. Lay
                  Owl Smart Levels MT5
                  Sergey Ermolov
                  4.47 (36)
                  MT4 버전  |  FAQ Owl Smart Levels Indicator 는 Bill Williams 의 고급 프랙탈, 시장의 올바른 파동 구조를 구축하는 Valable ZigZag, 정확한 진입 수준을 표시하는 피보나치 수준과 같은 인기 있는 시장 분석 도구를 포함하는 하나의 지표 내에서 완전한 거래 시스템입니다. 시장과 이익을 취하는 장소로. 전략에 대한 자세한 설명 표시기 작업에 대한 지침 고문-거래 올빼미 도우미의 조수 개인 사용자 채팅 ->구입 후 나에게 쓰기,나는 개인 채팅에 당신을 추가하고 거기에 모든 보너스를 다운로드 할 수 있습니다 힘은 단순함에 있습니다! Owl Smart Levels 거래 시스템은 사용하기 매우 쉽기 때문에 전문가와 이제 막 시장을 연구하고 스스로 거래 전략을 선택하기 시작한 사람들 모두에게 적합합니다. 전략 및 지표에는 눈에 보이지 않는 비밀 공식 및 계산 방법이 없으며 모든 전략 지표는 공개되어 있습니다. Owl Smart Levels를
                  TrendLine PRO MT5
                  Evgenii Aksenov
                  4.78 (49)
                  The Trend Line PRO indicator is an independent trading strategy. It shows the trend change, the entry point to the transaction, as well as automatically calculates three levels of Take Profit and Stop Loss protection Trend Line PRO is perfect for all Meta Trader symbols: currencies, metals, cryptocurrencies, stocks and indices Advantages of Trend Line PRO Never redraws its signals The possibility of using it as an independent strategy It has three automatic levels Take Profit and Stop Loss lev
                  Gartley Hunter Multi
                  Siarhei Vashchylka
                  5 (5)
                  Gartley Hunter Multi - An indicator for searching for harmonic patterns simultaneously on dozens of trading instruments and on all classic timeframes: (m1, m5, m15, m30, H1, H4, D1, Wk, Mn). Manual (Be sure to read before purchasing) | Version for MT4 Advantages 1. Patterns: Gartley, Butterfly, Shark, Crab. Bat, Alternate Bat, Deep Crab, Cypher 2. Simultaneous search for patterns on dozens of trading instruments and on all classic timeframes 3. Search for patterns of all possible sizes. Fr
                  Trend Line Map Pro MT5
                  STE S.S.COMPANY
                  4.67 (9)
                  트렌드 라인 맵 표시기는 트렌드 스크리너 표시기의 애드온입니다. Trend screener(Trend Line Signals)에 의해 생성된 모든 신호에 대한 스캐너로 작동합니다. Trend Screener Indicator 기반의 Trend Line Scanner입니다. Trend Screener Pro 표시기가 없으면 Trend Line Map Pro가 작동하지 않습니다. It's a Trend Line Scanner based on Trend Screener Indicator. If you don't have Trend Screener Pro Indicator,     the Trend Line Map Pro will not work . MQL5 블로그에 액세스하여 추세선 지도 표시기의 무료 버전을 다운로드할 수 있습니다. Metatrader Tester 제한 없이 구매하기 전에 사용해 보십시오. : 여기를 클릭하세요 1. 쉽게 얻을 수 있는 이점 통화 및
                  TrendDecoder Premium MT5
                  Christophe, Pa Trouillas
                  5 (1)
                  이제 메타트레이더에서 사용 가능 범위 및 다음 가능한 움직임 식별       |      추세의 초기 신호와 강도를 확인하세요       |      반전 전 명확한 출구 확보       |      가격이 테스트 할 피보 레벨 파악 비추적, 비지연 지표 - 수동 및 자동 거래에 이상적 - 모든 자산 및 모든 시간 단위에 적합 - 출시 시 50% 할인   - 이후 >> $149로 복귀 구매 후   이 채널로 문의 하여 권장 설정을 확인하세요. MT4 버전:   여기를 클릭하세요 BladeSCALPER 및 PowerZONES 로 전체 방법을 확인하세요. 어떤 서비스인가요? 트렌드디코더는 추세 모니터링을 간단하고 쉽게 하기 위한 여러 혁신 기술의 집약체입니다. 투영 추세선(투영 추세선)   - 다가오는 추세의 속도 기준 실시간 추세선과 투영 추세선 비교   - 시장이 이전과 같은 방향으로 움직이고 있는지, 아니면 둔화되고 있는지? 실시간 추세선 교차   - 추세가 궤
                  MetaBands M5
                  Vahidreza Heidar Gholami
                  4.67 (3)
                  MetaBands uses powerful and unique algorithms to draw channels and detect trends so that it can provide traders with potential points for entering and exiting trades. It’s a channel indicator plus a powerful trend indicator. It includes different types of channels which can be merged to create new channels simply by using the input parameters. MetaBands uses all types of alerts to notify users about market events. Features Supports most of the channel algorithms Powerful trend detection algorith
                  Blahtech Market Profile MT5
                  Blahtech Limited
                  5 (8)
                  Was: $249  Now: $99   Market Profile defines a number of day types that can help the trader to determine market behaviour. A key feature is the Value Area, representing the range of price action where 70% of trading took place. Understanding the Value Area can give traders valuable insight into market direction and establish the higher odds trade. It is an excellent addition to any system you may be using. Inspired by Jim Dalton’s book “Mind Over Markets”, this indicator is designed to suit the
                  제작자의 제품 더 보기
                  AW Recovery EA MT5
                  AW Trading Software Limited
                  4.22 (36)
                  Expert Advisor는 수익성이 없는 포지션을 회수하도록 설계된 시스템입니다.   작성자의 알고리즘은 손실 위치를 잠그고 여러 부분으로 분할하고 각 부분을 별도로 닫습니다. 손쉬운 설정, 하락 시 지연된 시작, 다른 Expert Advisors 잠금, 비활성화, 추세 필터링을 통한 평균화 및 손실 위치의 부분 마감이 하나의 도구에 내장되어 있습니다. 전체 그룹에서만 주문을 마감하는 그리드 전략과 달리 더 낮은 예금 부하로 손실을 줄일 수 있는 부분에서 마감 손실을 사용하여 손실과 함께 더 안전한 작업을 보장합니다. 주문이 복원되는 방법: 1 EA는 선택한 상품의 다른 창을 닫아 수익성이 없는 EA를 끕니다(선택 사항). 2 EA는 처리된 모든 주문에 대해 TakeProfit 및 StopLoss 수준을 재설정하고 해당 식별자가 있는 보류 주문을 삭제합니다. 3 EA는 수익성이 없는 주문의 일부를 충당하고 총 포지션 볼륨을 줄이기 위해 이익을 사용하기 위해 처리된 모든 수익성 있
                  AW Recovery EA
                  AW Trading Software Limited
                  4.29 (69)
                  Expert Advisor는 수익성이 없는 포지션을 회수하도록 설계된 시스템입니다.   작성자의 알고리즘은 손실 위치를 잠그고 여러 부분으로 분할하고 각 부분을 별도로 닫습니다. 손쉬운 설정, 하락 시 지연된 시작, 다른 Expert Advisors 잠금, 비활성화, 추세 필터링을 통한 평균화 및 손실 위치의 부분 마감이 하나의 도구에 내장되어 있습니다. 전체 그룹에서만 주문을 마감하는 그리드 전략과 달리 더 낮은 예금 부하로 손실을 줄일 수 있는 부분에서 마감 손실을 사용하여 손실과 함께 더 안전한 작업을 보장합니다. 주문이 복원되는 방법: 1 EA는 선택한 상품의 다른 창을 닫아 수익성이 없는 EA를 끕니다(선택 사항). 2 EA는 처리된 모든 주문에 대해 TakeProfit 및 StopLoss 수준을 재설정하고 해당 식별자가 있는 보류 주문을 삭제합니다. 3 EA는 수익성이 없는 주문의 일부를 충당하고 총 포지션 볼륨을 줄이기 위해 이익을 사용하기 위해 처리된 모든 수익성 있
                  AW Swing Trading EA
                  AW Trading Software Limited
                  5 (1)
                  수정 가격 움직임에 대한 스윙 거래를 위한 고급 도구입니다. 그것은 계속되는 방향으로 추세 롤백에서 작동하며 필요한 수정의 크기는 상품의 현재 변동성에 의해 결정되거나 거래자가 수동으로 결정합니다. 현재 추세를 따라 수정을 감지한 후 EA는 신호가 수정을 완료하고 추세를 계속할 때까지 기다렸다가 포지션을 엽니다. 어드바이저 작동 방법 ->   HERE   /  MT5 version ->  HERE 이익: 내장 오토롯 주문 개시 신호 커스터마이징 수동 주문을 추가할 수 있는 완전 자동화된 거래 시스템 트렌드 필터링 바구니의 동적 피치 다양한 유형의 주문 애니메이션 내장 오버랩 모든 유형의 알림 변동성을 기반으로 한 동적 되돌림 크기. 입력 설정: 주요 설정 첫 번째 주문의 크기 - 첫 번째 주문을 여는 볼륨 Autolot 계산 활성화 - Autolot 활성화 0.01랏당 Autolot 입금 - autolot 사용시 0.01당 입금량 SIGNAL - 작동 신호 설정 최소 진입 단계 -
                  AW Breakout Catcher EA MT5
                  AW Trading Software Limited
                  5 (1)
                  지표 신호에 대한 고문 거래 AW Breakout Catcher는 동적 지원 및 저항 수준의 전략 돌파를 위해 노력하고 있습니다. 주문에는 StopLoss 및 TakeProfit이 고정되어 있습니다. 선택적으로 평균화를 사용할 수 있습니다. 선택한 기간에 작동하는 기능과 3가지 유형의 알림이 있습니다. 장점: 모든 유형의 거래 상품 및 모든 시간대에서 작동 그것은 제 시간에 작동하여 미끄러짐과 최대 확산을 제한하는 기능을 가지고 있습니다. 쉬운 설정과 직관적인 패널 인터페이스 수동으로 열린 위치 추적에 적합 다양한 사용자 정의 옵션 손절매 및 이익 실현 선택적으로 평균화를 사용할 수 있습니다. 사용법 및 설명 ->   여기   / MT4 버전 ->   여기 입력 설정: 주요 설정 성공률 - 주문을 여는 성공률입니다. 표시기가 지정한 것보다 작으면 고문이 주문을 열지 않습니다. 주문 로트 - 개설할 주문량 자동 로트 계산 활성화 - 자동 로트 계산을 사용합니다. 이 기능을 사용하면
                  AW Gold Trend Trading EA
                  AW Trading Software Limited
                  3.67 (6)
                  능동적인 전략과 고급 평균화 시스템을 갖춘 완전 자동화된 추세 EA. 더 큰 신호 보안을 위해 오실레이터를 사용하는 추세 필터에 따라 주문이 열립니다. 간단하고 명확한 설정이 있습니다. EA는 모든 악기와 기간에 사용하기에 적합합니다. 장점: 수동 주문을 추가할 수 있는 자동화된 시스템 조정 가능한 중복 복구 알고리즘 한 방향 또는 양방향 거래 능력 반대 방향으로 이동할 때 평균화 사용 플러그형 자동 볼륨 계산 추세 표시기의 기간 조정 모든 유형의 알림을 보내는 내장 기능 MT5 version ->  HERE  / Problem solving ->   HERE 입력 변수: MAIN SETTING Size of the first order - Volume of orders to open Enable Autolot calculation - Use automatic lot calculation. Autolot allows you to save risk settings when chang
                  AW Trend Predictor MT5
                  AW Trading Software Limited
                  4.76 (54)
                  하나의 시스템에서 추세와 고장 수준의 조합입니다. 고급 지표 알고리즘은 시장 노이즈를 필터링하고 추세, 진입점 및 가능한 출구 수준을 결정합니다. 표시기 신호는 통계 모듈에 기록되어 가장 적합한 도구를 선택하여 신호 기록의 효율성을 보여줍니다. 이 표시기는 이익 실현 및 손절매 표시를 계산합니다. 매뉴얼 및 지침 ->   HERE   / MT4 버전 ->   HERE 지표로 거래하는 방법: Trend Predictor로 거래하는 것은 3단계로 간단합니다. 1단계 - 포지션 열기 70% 이상의 성공률로 매수 신호를 받았습니다. 2단계 - StopLoss 결정 반대 신호로 트렁크 선택 3단계 - 이익 실현 전략 정의 전략 1: TP1 도달 시 전체 포지션 청산 전략 2: TP1 도달 시 포지션의 50% 청산 및 TP2 도달 시 나머지 50% 청산 전략 3: 추세 반전 시 전체 포지션 청산 이익: 결과를 다시 그리지 않음, 신호는 엄격하게 양초가 닫힐 때 어드바이저에서 사용할 수 있습니
                  AW Trend Predictor EA MT5
                  AW Trading Software Limited
                  5 (2)
                  AW Trend Predictor EA - 추세 표시기 신호 AW Trend Predictor를 사용하여 거래하는 Expert Advisor입니다. 지표 전략 TakeProfit 및 StopLoss를 사용합니다. 다중 시간 프레임 필터링을 사용할 수 있습니다. 표시기에 의해 계산된 고정 StopLoss 또는 StopLoss가 있습니다. 시간 기반 작업 및 평균화가 기능적으로 가능합니다. 지침 및 설명 ->   HERE   / MT4 버전 ->   HERE 이익: 현재 변동성을 기반으로 지표에 의해 계산된 고정 손절매 또는 동적 손절매를 사용합니다. 정시에 작동하여 미끄러짐과 최대 확산을 제한하는 기능이 있습니다. 모든 유형의 거래 수단에서 작동 수동으로 열린 위치 추적에 적합 모든 시간대에서 작동하며 M15보다 낮지 않은 시간대에서 작업하는 것이 좋습니다. 더 높은 기간 또는 긴 기간의 지표로 추세를 필터링하는 기능이 포함되어 있습니다. 선택적으로 평균화를 사용할 수 있습니다.
                  AW Breakout Catcher EA
                  AW Trading Software Limited
                  4.5 (6)
                  지표 신호에 대한 고문 거래 AW Breakout Catcher는 동적 지원 및 저항 수준의 전략 돌파를 위해 노력하고 있습니다. 주문에는 StopLoss 및 TakeProfit이 고정되어 있습니다. 선택적으로 평균화를 사용할 수 있습니다. 선택한 기간에 작동하는 기능과 3가지 유형의 알림이 있습니다. 장점: 모든 유형의 거래 상품 및 모든 시간대에서 작동 그것은 제 시간에 작동하여 미끄러짐과 최대 확산을 제한하는 기능을 가지고 있습니다. 쉬운 설정과 직관적인 패널 인터페이스 수동으로 열린 위치 추적에 적합 다양한 사용자 정의 옵션 손절매 및 이익 실현 선택적으로 평균화를 사용할 수 있습니다. 사용법 및 설명 ->   여기   / MT5 버전 ->   여기 입력 설정: 주요 설정 성공률 - 주문을 여는 성공률입니다. 표시기가 지정한 것보다 작으면 고문이 주문을 열지 않습니다. 주문 로트 - 개설할 주문량 자동 로트 계산 활성화 - 자동 로트 계산을 사용합니다. 이 기능을 사용하면
                  AW Double Grids EA
                  AW Trading Software Limited
                  4.56 (9)
                  AW Double Grids MT4 Expert Advisor는 정보 거래 패널과 쉬운 설정을 갖춘 공격적이고 완전 자동화된 그리드 기반 Expert Advisor입니다. 이 전략은 한 방향의 볼륨을 곱하는 동시 양면 작업으로 구성됩니다. 주문 곱셈의 변형뿐만 아니라 로트의 내장 자동 계산. Problem solving  ->   HERE  / MT5 version ->  HERE 고문이 거래하는 방법: EA는 두 개의 반대 주문을 열어 거래를 시작합니다. 수익성 있는 주문을 마감한 후 EA는 두 개의 주문을 다시 열어 오픈 방향의 볼륨을 곱합니다. 미결 주문이 있는 경우 EA는 TakeProfit을 포인트 단위로 변경합니다. TakeProfit은 동적이며 반대 방향의 열린 주문 수에 따라 조정됩니다. 주문 그리드의 추가 열기에는 현재 방향의 열린 주문 수에 따라 변경되는 동적 단계가 있습니다. 입력 매개변수: Main settings Size of the first order
                  AW Double Grids MT5
                  AW Trading Software Limited
                  4.83 (6)
                  AW Double Grids MT5 Expert Advisor는 정보 거래 패널과 쉬운 설정을 갖춘 공격적이고 완전 자동화된 그리드 기반 Expert Advisor입니다. 이 전략은 한 방향의 볼륨을 곱하는 동시 양면 작업으로 구성됩니다. 주문 곱셈의 변형뿐만 아니라 로트의 내장 자동 계산. 문제해결 ->   HERE   / MT4 버전 ->   HERE 고문이 거래하는 방법: EA는 두 개의 반대 주문을 열어 거래를 시작합니다. 수익성 있는 주문을 마감한 후 EA는 두 개의 주문을 다시 열어 오픈 방향의 볼륨을 곱합니다. 미결 주문이 있는 경우 EA는 TakeProfit을 포인트 단위로 변경합니다. TakeProfit은 동적이며 반대 방향의 열린 주문 수에 따라 조정됩니다. 주문 그리드의 추가 열기에는 현재 방향의 열린 주문 수에 따라 변경되는 동적 단계가 있습니다. 입력 매개변수: Main settings Size of the first order - Variable def
                  Trend Predictor EA
                  AW Trading Software Limited
                  5 (13)
                  AW Trend Predictor EA - 추세 표시기 신호 AW Trend Predictor를 사용하여 거래하는 Expert Advisor입니다. 지표 전략 TakeProfit 및 StopLoss를 사용합니다. 다중 시간 프레임 필터링을 사용할 수 있습니다. 표시기에 의해 계산된 고정 StopLoss 또는 StopLoss가 있습니다. 시간 기반 작업 및 평균화가 기능적으로 가능합니다. Instruction and description ->  HERE  / MT5 version ->  HERE   이익: 현재 변동성을 기반으로 지표에 의해 계산된 고정 손절매 또는 동적 손절매를 사용합니다. 정시에 작동하여 미끄러짐과 최대 확산을 제한하는 기능이 있습니다. 모든 유형의 거래 수단에서 작동 수동으로 열린 위치 추적에 적합 모든 시간대에서 작동하며 M15보다 낮지 않은 시간대에서 작업하는 것이 좋습니다. 더 높은 기간 또는 긴 기간의 지표로 추세를 필터링하는 기능이 포함되어 있습니다
                  AW Trend Predictor
                  AW Trading Software Limited
                  4.74 (39)
                  하나의 시스템에서 추세와 고장 수준의 조합입니다. 고급 지표 알고리즘은 시장 노이즈를 필터링하고 추세, 진입점 및 가능한 출구 수준을 결정합니다. 표시기 신호는 통계 모듈에 기록되어 가장 적합한 도구를 선택하여 신호 기록의 효율성을 보여줍니다. 이 표시기는 이익 실현 및 손절매 표시를 계산합니다. 매뉴얼 및 설명 ->   여기   / MT5 버전 ->   여기 지표로 거래하는 방법: Trend Predictor로 거래하는 것은 3단계로 간단합니다. 1단계 - 포지션 열기 70% 이상의 성공률로 매수 신호를 받았습니다. 2단계 - StopLoss 결정 반대 신호로 트렁크 선택 3단계 - 이익 실현 전략 정의 전략 1: TP1 도달 시 전체 포지션 청산 전략 2: TP1 도달 시 포지션의 50% 청산 및 TP2 도달 시 나머지 50% 청산 전략 3: 추세 반전 시 전체 포지션 청산 이익: 결과를 다시 그리지 않음, 신호는 엄격하게 양초가 닫힐 때 어드바이저에서 사용할 수 있습니다. 이
                  AW Scalping Dynamics EA
                  AW Trading Software Limited
                  4.73 (11)
                  추세 반전을 기반으로 작동하는 완전 자동 고급 거래 로봇입니다. 필요한 경우 그리드 전략을 사용할 수도 있습니다. 최대 카트 적재량에 도달하면 3가지 유형의 알림 및 위치 잠금 기능이 내장되어 있습니다. 기본 설정은 M15 시간대의 EURUSD에 권장됩니다. 기능 및 이점: 동시에 두 방향으로 작업할 수 있는 능력 여러 단계에서 정시에 작업하는 내장 기능 브로커가 볼 수 없는 가상 StopLoss를 사용합니다. 현재 추세의 활동을 기반으로 한 작업 알고리즘 자동 로트 계산 내장 모든 유형의 알림 사용 위치를 자동으로 잠그고 어드바이저를 비활성화하는 기능 장바구니의 후속 주문에 대한 TakeProfit 감소 현재 추세 또는 단계별로 개시 주문 조정 MT5 version ->   HERE  / Problem solving ->  HERE   입력 변수에 대한 자세한 설명 및 설명       ->   여기 고문이 거래하는 방법: - 우선 거래 시 현재 추세 활동을 고려합니다("주요 추세
                  AW Scalping Dynamics MT5
                  AW Trading Software Limited
                  추세 반전을 기반으로 작동하는 완전 자동 고급 거래 로봇입니다. 필요한 경우 그리드 전략을 사용할 수도 있습니다. 최대 카트 적재량에 도달하면 3가지 유형의 알림 및 위치 잠금 기능이 내장되어 있습니다. 기본 설정은 M15 시간대의 EURUSD에 권장됩니다. 기능 및 이점: 동시에 두 방향으로 작업할 수 있는 능력 여러 단계에서 정시에 작업하는 내장 기능 브로커가 볼 수 없는 가상 StopLoss를 사용합니다. 현재 추세의 활동을 기반으로 한 작업 알고리즘 자동 로트 계산 내장 모든 유형의 알림 사용 위치를 자동으로 잠그고 어드바이저를 비활성화하는 기능 장바구니의 후속 주문에 대한 TakeProfit 감소 현재 추세 또는 단계별로 개시 주문 조정 MT4 버전 ->       여기       / 문제 해결 ->       여기       입력 변수에 대한 자세한 설명 및 설명       ->   여기 고문이 거래하는 방법: - 우선 거래 시 현재 추세 활동을 고려합니다("주요 추세
                  AW RSI based EA
                  AW Trading Software Limited
                  5 (5)
                  EA는 과매도 또는 과매수 상태에서 발생하는 가격 수익에 대해 거래하고 RSI 오실레이터에서 신호를 받으면 포지션을 엽니다. 시스템에는 많은 시나리오와 유연한 구성이 있습니다. 평균화, 첫 번째 및 마지막 바스켓 주문 마감 기능 및 자동 로트 계산 기능을 사용합니다. 고급 대시보드와 세 가지 유형의 알림이 있습니다. Problem solving ->  HERE  /  MT5 version ->  HERE  /  Instruction  ->   HERE   이점: 쉬운 설정 및 직관적인 패널 인터페이스 구성 가능한 표시기 신호 모든 유형의 악기 및 모든 기간에 적합 필요한 경우 평균화 사용 내장된 자동 로트 계산 첫 번째 및 마지막 바구니 주문을 마감하기 위한 내장 시스템 세 가지 유형의 알림: 푸시, 이메일, 경고 전략: EA는 과매도 또는 과매수 상태에서 발생하는 가격 수익에 따라 거래하고 RSI 오실레이터에서 신호를 받으면 포지션을 엽니다. 거래 행동을 위한 다양한 옵션 구
                  AW Three MA MT5
                  AW Trading Software Limited
                  4.5 (2)
                  두 이동 평균의 교차점에서 거래하는 Expert Advisor는 세 번째 이동 평균을 사용하여 현재 추세 방향을 필터링합니다. 유연하지만 동시에 간단한 입력 설정이 있습니다. 문제 해결 ->   HERE   / MT4 버전 ->   HERE   / 지침   ->     여기     이익: 직관적인 쉬운 설정 모든 유형의 악기 및 모든 기간에 적합 세 가지 유형의 알림이 있습니다. 첫 번째 주문을 마지막 주문과 겹치는 플러그형 시스템 거래량을 자동으로 계산하는 기능 전문가 고문 전략. EA는 3개의 이동 평균을 사용하여 포지션을 엽니다. 주요한 것은 빠르고 느린 두 개의 움직이는 것입니다. 세 번째는 시장 소음을 걸러내는 슬라이드입니다. 빠르게 움직이는 것이 느린 것을 아래에서 위로 교차하면 이것은 매수 신호입니다. 빠르게 움직이는 것이 느린 것을 위에서 아래로 교차하면 이것은 매도 신호입니다. 세 번째 슬라이딩을 사용하는 경우: 빠르고 느린 이동 평균이 필터링된 이동 평균(하향 추세
                  AW Three MA EA
                  AW Trading Software Limited
                  1 (1)
                  두 이동 평균의 교차점에서 거래하는 Expert Advisor는 세 번째 이동 평균을 사용하여 현재 추세 방향을 필터링합니다. 유연하지만 동시에 간단한 입력 설정이 있습니다. 문제 해결 ->   HERE   / MT5 버전 ->   HERE   / 지침   ->       여기     이익: 직관적인 쉬운 설정 모든 유형의 악기 및 모든 기간에 적합 세 가지 유형의 알림이 있습니다. 첫 번째 주문을 마지막 주문과 겹치는 플러그형 시스템 거래량을 자동으로 계산하는 기능 전문가 고문 전략. EA는 3개의 이동 평균을 사용하여 포지션을 엽니다. 주요한 것은 빠르고 느린 두 개의 움직이는 것입니다. 세 번째는 시장 소음을 걸러내는 슬라이드입니다. 빠르게 움직이는 것이 느린 것을 아래에서 위로 교차하면 이것은 매수 신호입니다. 빠르게 움직이는 것이 느린 것을 위에서 아래로 교차하면 이것은 매도 신호입니다. 세 번째 슬라이딩을 사용하는 경우: 빠르고 느린 이동 평균이 필터링된 이동 평균(하향
                  AW Workpad MT5
                  AW Trading Software Limited
                  5 (1)
                  AW Workpad는 수동 및 반자동 거래를 위해 설계된 다기능 거래 컨트롤 패널입니다. 예약 주문, 시장 포지션을 관리하고 광범위한 통계 데이터를 제공하며 고전적인 지표 그룹의 다중 기간 분석을 제공합니다. 이 유틸리티는 5개의 탭으로 표시됩니다.   Positions, Pending, Close, Indicators, Info .  각 탭에는 현재 시장 상황에 대한 주문 또는 정보를 처리하기 위한 자체 기능 그룹이 있습니다. MT4 버전 ->   여기   / 문제 해결 ->   여기     기능 또는 이점: 이 유틸리티는 모든 시간대와 기호(통화, 지수, 석유, 금속, 주식)에서 작동합니다. 각 패널의 모든 요소에는 추가로 레이블이 지정되어 있어 요소 위로 마우스를 가져가기만 하면 됩니다. AW Workpad 거래 패널에는 유연한 설정과 직관적인 패널 인터페이스가 있습니다. 가장 필요한 모든 기능을 하나의 제품에 담았습니다. 트레이딩 패널 탭: Positions - 이 탭에서는
                  AW Breakout Catcher MT5
                  AW Trading Software Limited
                  5 (9)
                  가격 수준 분석, 고급 통계, TakeProfit 계산 및 3가지 유형의 알림. 이익: 결과를 다시 그리지 마십시오 촛불이 닫힐 때 엄격하게 신호를 보냅니다. 거짓 고장 필터링 알고리즘 어떤 트렌드 전략과도 잘 어울립니다. 모든 도구 및 시계열에서 작동 매뉴얼 및 지침 ->   HERE   / 문제 해결 ->   HERE   / MT4 버전 ->   HERE 지표로 거래하는 방법 AW Breakout Catcher와 거래하는 간단한 3단계: 1단계 - 포지션 열기 70% 이상의 성공률로 매수 신호를 받았습니다. 2단계 - StopLoss 결정 반대 신호로 트렁크 선택 3단계 - 이익 실현 전략 정의 전략 1: TP1 도달 시 전체 포지션 청산 전략 2: TP1 도달 시 포지션의 50% 청산 및 TP2 도달 시 나머지 50% 청산 전략 3: 반대 신호에서 전체 포지션 청산 통계 모듈 더 나은 쌍 선택을 위해 내장된 통계 계산을 사용하십시오. 거래 계산 - 통계가 제공되는 총 신호 수
                  AW Turtles Indicator MT5
                  AW Trading Software Limited
                  4.47 (19)
                  이 지표는 Turtle 시스템에 따라 작동하며 일반적으로 20개와 55개 양초의 시간 간격을 가정합니다. 특정 시간 간격에 걸쳐 추세가 모니터링됩니다. 지지선이나 저항선이 무너지는 순간 진입이 이루어집니다. 출구 신호는 동일한 시간 간격의 추세와 반대 방향의 가격 돌파입니다. 장점: 상품: 통화쌍, 주식, 상품, 지수, 암호화폐 기간: 기본적으로 D1이며 모든 기간 작업에도 적합합니다. 거래시간 : 24시간 내내 자금 관리 전략: 거래당 위험은 1% 이하 추가 주문을 사용할 경우 각 추가 포지션에 대한 위험은 0.25%입니다. MT4 버전 ->   여기   / AW Turtles EA ->   여기 참가 규칙: 1) 단기 입학: 진입 조건은 20일 최고가 또는 최저가를 돌파하는 것입니다. 이전 신호가 성공하면 거래를 건너뜁니다. 메모! 이전 거래가 수익으로 종료된 경우 해당 항목을 건너뜁니다. 갑자기 돌파가 수익성이 있는 것으로 판명되면 나중에 55일 채널을 돌파한 후
                  FREE
                  AW Swing Trading EA MT5
                  AW Trading Software Limited
                  5 (1)
                  수정 가격 움직임에 대한 스윙 거래를 위한 고급 도구입니다. 그것은 계속되는 방향으로 추세 롤백에서 작동하며 필요한 수정의 크기는 상품의 현재 변동성에 의해 결정되거나 거래자가 수동으로 결정합니다. 현재 추세를 따라 수정을 감지한 후 EA는 신호가 수정을 완료하고 추세를 계속할 때까지 기다렸다가 포지션을 엽니다. 어드바이저 작동 방법 ->   HERE   / MT4 버전 ->   HERE     이익: 내장 오토롯 주문 개시 신호 커스터마이징 수동 주문을 추가할 수 있는 완전 자동화된 거래 시스템 트렌드 필터링 바구니의 동적 피치 다양한 유형의 주문 애니메이션 내장 오버랩 모든 유형의 알림 변동성을 기반으로 한 동적 되돌림 크기. 입력 설정: 주요 설정 첫 번째 주문의 크기 - 첫 번째 주문을 여는 볼륨 Autolot 계산 활성화 - Autolot 활성화 0.01랏당 Autolot 입금 - autolot 사용시 0.01당 입금량 SIGNAL - 작동 신호 설정 최소 진입 단계 - 사
                  AW RSI based EA MT5
                  AW Trading Software Limited
                  4 (1)
                  EA는 과매도 또는 과매수 상태에서 발생하는 가격 수익에 대해 거래하고 RSI 오실레이터에서 신호를 받으면 포지션을 엽니다. 시스템에는 많은 시나리오와 유연한 구성이 있습니다. 평균화, 첫 번째 및 마지막 바스켓 주문 마감 기능 및 자동 로트 계산 기능을 사용합니다. 고급 대시보드와 세 가지 유형의 알림이 있습니다. 문제 해결 ->   HERE   / MT4 버전 ->   HERE   /   지침   ->       여기     이점: 쉬운 설정 및 직관적인 패널 인터페이스 구성 가능한 표시기 신호 모든 유형의 악기 및 모든 기간에 적합 필요한 경우 평균화 사용 내장된 자동 로트 계산 첫 번째 및 마지막 바구니 주문을 마감하기 위한 내장 시스템 세 가지 유형의 알림: 푸시, 이메일, 경고 전략: EA는 과매도 또는 과매수 상태에서 발생하는 가격 수익에 따라 거래하고 RSI 오실레이터에서 신호를 받으면 포지션을 엽니다. 거래 행동을 위한 다양한 옵션 구현: 오실레이터 라인이 아래
                  AW Close By Total Profit MT5
                  AW Trading Software Limited
                  This is a utility for closing orders or baskets of orders for the total profit or loss. Can work multicurrency, can work with orders opened manually. Has additional trailing profit. Capabilities: Closing an order for the current symbol or for all symbols Closing individual orders or whole baskets of orders Stopping the utility in one click Trailing function for total profit Setting TP and SL in money, in points or as a percentage of the deposit Closing all BUY or SELL orders or closing all orde
                  AW CCI based EA
                  AW Trading Software Limited
                  4 (2)
                  Expert Advisor는 클래식 CCI 지표의 신호에 대해 작동합니다. 시스템에는 많은 시나리오와 유연한 구성이 있습니다. 평균화, 첫 번째 및 마지막 바구니 주문을 마감하는 기능 및 자동 로트 계산 기능을 사용합니다. Problem solving ->  HERE   / MT5 version ->  HERE   / Instruction  ->   HERE   장점: 쉬운 설정과 직관적인 패널 인터페이스 사용자 정의 가능한 CCI 표시기 신호 필요한 경우 평균화 사용 내장 자동 로트 계산 첫 번째 및 마지막 장바구니 주문을 마감하는 내장 시스템 세 가지 유형의 알림: 푸시, 이메일, 알림 고문의 작동 방식: 매수 신호: 표시기의 위쪽 테두리가 아래쪽에서 위쪽으로 교차할 때 표시기의 아래쪽 경계가 아래에서 위로 교차할 때 매도 신호: 표시기의 위쪽 테두리가 위에서 아래로 교차할 때 또는 표시기의 아래쪽 테두리가 위에서 아래로 교차할 때 거래 전략 옵션: 구매 및 판매가 허용되며 E
                  AW Envelopes EA MT5
                  AW Trading Software Limited
                  완전 자동화된 거래 로봇.       고문은 전략에 따라 일합니다       그는       동적 지원 및 저항 수준의 돌파   , 잘 알려진 Envelopes 표시기가 신호를 결정하는 데 사용됩니다   .       또한 EA는 평균 가능성, 첫 번째 및 마지막 바스켓 주문 마감 기능, 자동 로트 계산 기능, 세 가지 유형의 알림을 구현합니다. 문제 해결 ->   여기   /       MT4 버전 ->   여기       / 지시사항   ->       여기     이점: 모든 악기 및 기간에 사용할 수 있습니다. 내장 표시기의 구성 가능한 매개변수 쉬운 설정 및 직관적인 패널 인터페이스 내장된 자동 로트 계산 첫 번째 및 마지막 바구니 주문을 마감하기 위한 내장 시스템 세 가지 유형의 알림: 푸시, 이메일, 경고 전략 및 신호: 표시선은 가격이 변동하는 채널을 형성하고 이동 평균은 주요 이동 방향을 보여줍니다. 위쪽 선은 저항선이고 아래쪽 선은 지지선입니다. 지표를 사용하여
                  AW Parabolic sar EA MT5
                  AW Trading Software Limited
                  5 (2)
                  완전 자동화된 거래 로봇. 잘 알려진 Parabolic SAR 표시기는 신호를 식별하는 데 사용됩니다. 또한 EA는 평균화 기능, 첫 번째 및 마지막 바스켓 주문 마감 기능, 자동 로트 계산 기능을 구현합니다. 고급 정보 패널과 세 가지 유형의 알림이 있습니다. 어드바이저에서 표시기 신호를 조정하는 기능. 문제 해결 ->   HERE   / MT4 버전 ->   HERE       / 지시사항   ->   여기     이익: 모든 악기 및 기간에 사용할 수 있습니다. 구성 가능한 내장 표시기 매개변수 쉬운 설정 및 직관적인 패널 인터페이스 캔들당 하나의 주문만 여는 기능 내장된 자동 로트 계산 첫 번째 및 마지막 바구니 주문을 마감하기 위한 내장 시스템 세 가지 유형의 알림: 푸시, 이메일, 경고 이점: EA는 표시기 신호에 따라 포지션을 엽니다. 추세가 교차되면 표시기에서 신호가 수신되며 이때 위치가 열립니다. 하락 추세 시작 신호를 받으면 SELL 포지션 상승추세의 시작 신
                  AW Turtles Indicator
                  AW Trading Software Limited
                  4.8 (15)
                  이 지표는 Turtle 시스템에 따라 작동하며 일반적으로 20개와 55개 양초의 시간 간격을 가정합니다. 특정 시간 간격에 걸쳐 추세가 모니터링됩니다. 지지선이나 저항선이 무너지는 순간 진입이 이루어집니다. 출구 신호는 동일한 시간 간격의 추세와 반대 방향의 가격 돌파입니다. 장점: 상품: 통화쌍, 주식, 상품, 지수, 암호화폐 기간: 기본적으로 D1이며 모든 기간 작업에도 적합합니다. 거래시간 : 24시간 내내 자금 관리 전략: 거래당 위험은 1% 이하 추가 주문을 사용할 경우 각 추가 포지션에 대한 위험은 0.25%입니다. MT5 버전 ->   여기   / AW Turtles EA ->   여기 참가 규칙: 1) 단기 입학: 진입 조건은 20일 최고가 또는 최저가를 돌파하는 것입니다. 이전 신호가 성공하면 거래를 건너뜁니다. 메모! 이전 거래가 수익으로 종료된 경우 해당 항목을 건너뜁니다. 갑자기 돌파가 수익성이 있는 것으로 판명되면 나중에 55일 채널을 돌파한 후
                  FREE
                  AW Close By Profitables
                  AW Trading Software Limited
                  5 (3)
                  The algorithm finds the most unprofitable position in your account, then the program determines the profitable positions that can cover the loss. This profit is used to close       unprofitable order in automated mode. The system is able to work on the most distant unprofitable orders or select them according to certain tickets with manual selection. That is, the utility closes a losing order using one or a group of winning orders. Opportunities: Closing orders for the current symbol or for a
                  AW Super Trend MT5
                  AW Trading Software Limited
                  4.8 (5)
                  AW Super Trend -가장 인기 있는 클래식 트렌드 지표 중 하나입니다. 그것은 간단한 설정을 가지고 있으며 추세로 작업할 수 있을 뿐만 아니라 이 표시기로 계산되는 손절매 수준도 표시합니다. 이익: 악기:       통화 쌍   , 주식, 상품, 지수, 암호 화폐. 기간: М15 이상. 거래 시간: 24시간 내내. 현재 추세의 방향을 보여줍니다. 손절매를 계산합니다. 거래를 할 때 사용할 수 있습니다. 세 가지 유형의 알림: 푸시, 이메일, 경고. MT4 버전 ->   여기   / 뉴스 -   여기     기능: 표시기는 해당 색상으로 현재 추세 방향을 표시합니다. - 파란색은 현재 기간에 사용된 기호의 상승 추세를 나타냅니다. - 선의 빨간색은 선택한 기호에서 사용된 기간의 하락 추세를 나타냅니다. 표시기를 사용하여 StopLoss를 설정할 수 있습니다. 표시선은 막대 위에 표시되지 않고 막대를 기준으로 약간 이동하여 표시됩니다. 추세선이 표시되는 이 곳은 트
                  FREE
                  AW Prime Oscillator MT5
                  AW Trading Software Limited
                  두 개의 오실레이터의 조합. 첫 번째 항목은 진입점을 표시하고 두 번째 항목은 현재 추세를 표시합니다. 표시기는 두 가지 모드의 화살표로 오실레이터 신호를 표시할 수 있습니다. 모든 빠른 오실레이터 신호 또는 현재 추세 방향의 신호만 표시할 수 있습니다. 다중 시간대 패널과 세 가지 유형의 신호 알림이 있습니다. 이익: 일일 및 스캘핑 거래에 적합 추세 필터링 간단하고 민감한 설정 다중 시간대 패널 Advisor에 통합하는 데 적합합니다. 모든 기호 및 기간에서 작동합니다. 세 가지 유형의 알림 MT4 버전 ->   여기   / 문제해결 ->   여기 지표 전략 표시기는 두 개의 서로 다른 오실레이터로 구성됩니다. 느린 추세선(두꺼움) - 지표의 고수준이 위에서 아래로 교차하면 하락세 지표이고, 낮은 수평 수준(지표의 낮은 수준)이 아래에서 위로 교차하면 하락 추세 지표입니다. 상승 경향. 또한, 하단 영역에서 느린 선을 발견하면 현재 추세가 하락세임을 나타내고, 반대로 상단 영역
                  필터:
                  CHRISTIAN TJAHJADI
                  25
                  CHRISTIAN TJAHJADI 2024.04.13 03:35 
                   

                  Good, but it is vry good idead if the description not just Uptrend and Downtrend, but define into 4 categories: 1. MACD UP ABOVE ZERO LINE 2. MACD_UP_BELOW_ZERO LINE 3. MACD_DOWN_ABOVE_ZERO LINE 4. MACD_DOWN_B ELOW_ZERO LINE

                  Gloria Sarpong
                  724
                  Gloria Sarpong 2024.04.08 15:15 
                   

                  great

                  Tora.Tigre
                  14
                  Tora.Tigre 2024.02.14 11:48 
                   

                  Very good signals, but to operate we need to integrate with some other indicator to have a good assertive result.

                  lichunter2
                  14
                  lichunter2 2024.02.06 22:16 
                   

                  Color not preserved.

                  AW Trading Software Limited
                  120902
                  개발자의 답변 Alexander Nechaev 2024.02.15 17:25
                  Hello. I have checked this information in my trading terminal, unfortunately I was not able to recreate your problem. All colours are saved correctly. In order to change the colours of the panel go to the Inputs tab in the input settings of the indicator. If you want to change the colours of the indicator lines, go to the Colors tab in the input settings of the indicator. Best Regards.
                  jaminolis
                  14
                  jaminolis 2024.01.22 10:35 
                   

                  Hi, thanks for an awesome free indicator. I enjoy using the multi TF bar so much. however recently, it has been showing just a blank space with no multi TF values. Can you help with this?

                  vbsql7
                  14
                  vbsql7 2023.11.13 15:29 
                   

                  Main and Signal line colors don't "stick" after you change them. Most times they will change on screen (but not always). They never survive a refresh/reload of the chart, which indicates that the properties are not saved in (or not reloaded from ) a chart template. User support rating is not relevant here but MQL5 forum requires it.

                  Seyed Alireza Hojjatoleslami
                  181
                  Seyed Alireza Hojjatoleslami 2023.11.02 13:46 
                   

                  useable indicator with good options. But the indicator needs some update

                  G Trader
                  24
                  G Trader 2023.10.02 22:43 
                   

                  This is just what I was looking for as it gives you both the Signal Line and the Main Line, which is very important. Only annoying thing is changing the colours and thickness of the lines doesn't always work, but no big deal especially considering it is free. Many thanks to the developer!

                  eakcendo
                  41
                  eakcendo 2023.09.19 17:53 
                   

                  Good, but i found that when I set the color completed then I change the timeframe, the color is reset to default.

                  20120886
                  1145
                  20120886 2023.08.15 04:13 
                   

                  Exactly what I was looking for... Perfect, what are the buffer signals for the crossline and zeroline ?

                  Mutamanakiri
                  25
                  Mutamanakiri 2023.07.03 16:30 
                   

                  good indicator. But I am wondering how to access the information on the panel to use this in an EA

                  Seriosha
                  14
                  Seriosha 2023.06.15 10:17 
                   

                  Really nice

                  sleepcat214
                  14
                  sleepcat214 2023.05.11 14:33 
                   

                  Nice

                  Vu Tri Thuy
                  122
                  Vu Tri Thuy 2023.05.09 03:46 
                   

                  Chắc chắn là 5* rồi

                  dmlopes
                  31
                  dmlopes 2023.04.10 12:46 
                   

                  Very interesting indicator. It offers relatively reliable signals and good refinement possibilities.

                  amjadrasheed65
                  14
                  amjadrasheed65 2023.03.24 06:55 
                   

                  The indicator is good and positive. But I will suggest an alert for crossing separately as the trend is shown in a separate window.

                  syvBkaeu
                  134
                  syvBkaeu 2023.03.04 18:06 
                   

                  very positive,thank you

                  AW Trading Software Limited
                  120902
                  개발자의 답변 Alexander Nechaev 2023.03.05 17:40
                  Thanks for your feedback.
                  Michael Nunn
                  128
                  Michael Nunn 2023.02.04 20:36 
                   

                  I like this one.

                  HannesPelser
                  24
                  HannesPelser 2023.01.11 15:42 
                   

                  Not so good. I cant even change line color or thickness. Signals are false.

                  AW Trading Software Limited
                  120902
                  개발자의 답변 Alexander Nechaev 2023.03.18 13:34
                  Hello, color and line thickness settings for any technical indicator are available in its settings window. You need to select not the "Input settings" tab, but the "Colors" tab (an adjacent tab in the window) - this is standard for any technical indicator and is a built-in functionality of the trading terminal. Best Regards
                  Otis J
                  80
                  Otis J 2022.11.20 22:08 
                   

                  awesome!

                  12
                  리뷰 답변
                  버전 2.10 2023.03.19
                  - Graphic updates and general optimization of the indicator code
                  버전 2.0 2022.06.19
                  - Fixed a bug with deleting the indicator arrows when changing the timeframe