Blahtech Better Volume MT5
- 지표
-
Blahtech Limited
 Professional IT developer with over 20 years of experience working with top tier investment banks (Barclays Capital, Credit Suisse, Merrill Lynch, ABN Amro, Mizuho Bank) - LinkedIn profile available on request
 - 버전: 1.7
- 업데이트됨: 11 1월 2024
- 활성화: 8
Was: $49 Now: $33
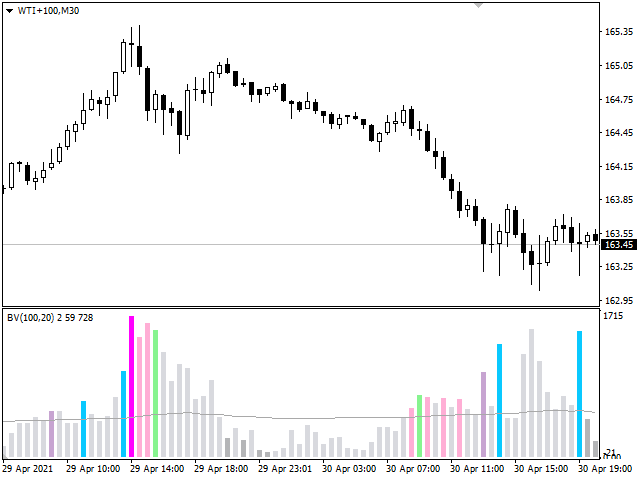
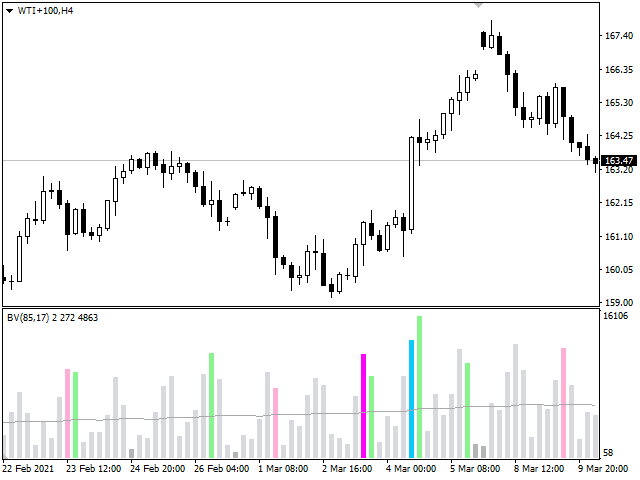
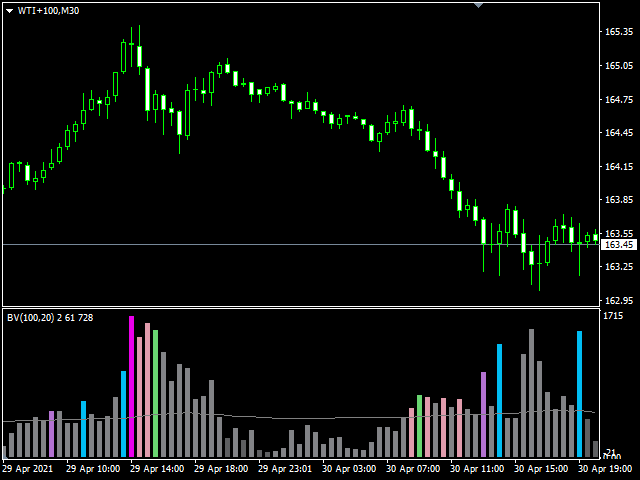
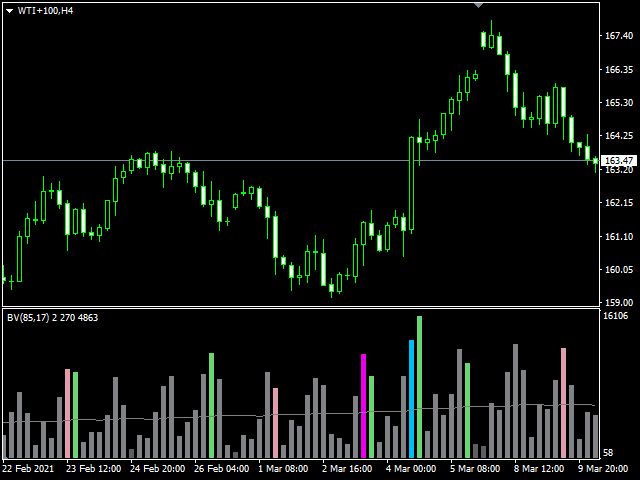
Blahtech Better Volume provides an enhanced version of the vertical volume bars. Each bar is compared to the previous 20 bars. Depending on its volume, range and volume density it will be assigned a state and colour.
- Low Volume – Minimum volume
- High Churn – Significant volume with limited movement
- Climax Neutral – High volume with unclear direction
- Climax Up – High volume with bullish direction
- Climax Dn – High volume with bearish direction
- Climax Churn – High volume with restricted movement
- Selectable Filters
- Neutral direction detection
- Alerts at bar close or in real time
- Significantly reduced CPU usage
- Tick Volume or Broker Volume
- Default colours adjust for black background
- Periods and Look Backs adjust automatically when switching timeframes
Input Parameters
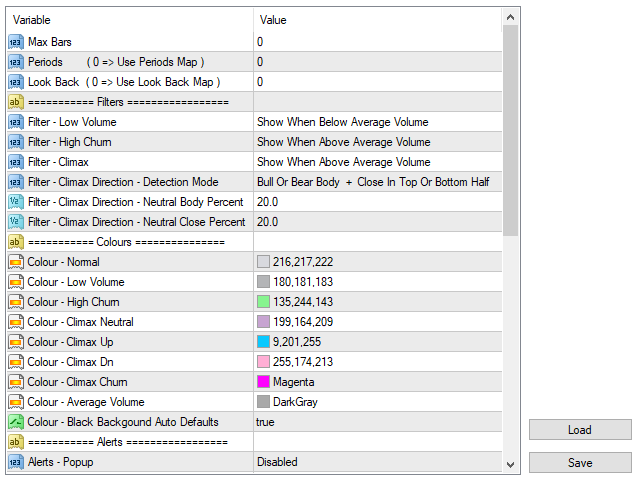
- Max Bars - Restrict number bars back to plot (0 = All bars)
- Periods - Bars to use for the Volume Moving Average (0 = Use Period map)
- Look Back - Bars to search for max and min volumes (0 = Use Lookback map)
- Filter – Low Volume - Only highlight bars with less volume than average
- Filter – High Churn - Only highlight bars with more volume than average
- Filter – Climax - Only highlight bars with more volume than average
- Filter – Climax Direction - Detection Mode - Choose the method for deciding the direction of the candle
- Filter – Climax Direction - Neutral Body Percent - Define when a small candle body is considered to be unclear direction
- Filter – Climax Direction - Neutral Close Percent - Define size of zone in middle of the candle where the closing price shows no clear direction
- Set to taste
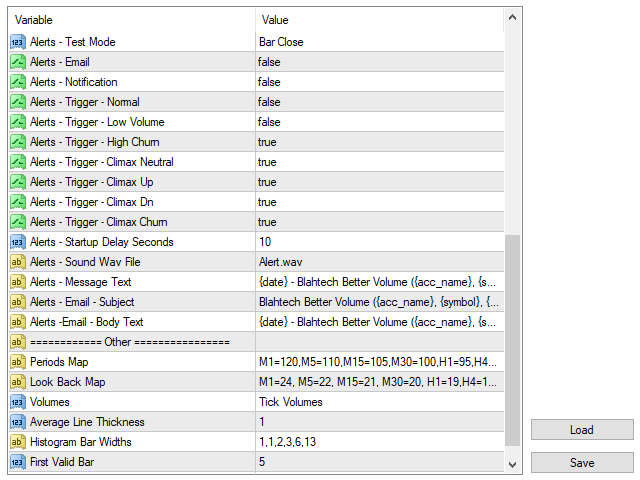
- Popup - Enable/Disable sound and/or popup dialog for active alerts
- Test Mode - Select when the indicator checks for alert triggers
- Email - Enable/disable email for alerts
- Notification - Enable/disable notifications for alerts