HTF Power of Three ICT

5

HTF Power of Three (ICT) -  MT5 Indicator - Version 1.1

Overview

The HTF Power of Three indicator is a professional implementation of the Inner Circle Trader's (ICT) Power of Three concept, inspired by Larry Williams. This indicator visualizes higher timeframe (HTF) candle development in real-time on any lower timeframe chart, making it an essential tool for ICT traders who study institutional price movement patterns.

What is Power of Three (PO3)?

Power of Three represents a three-staged Smart Money campaign that occurs in every timeframe:

  1. ACCUMULATION - Smart money accumulates positions around the opening price
  2. MANIPULATION - Liquidity is engineered, stops are hunted, and weak hands are shaken out
  3. DISTRIBUTION - Smart money exits positions, pairing with pending interest

As ICT states: "This is applicable to every time measurement, as long as you have a beginning time, the highest value, the lowest value, and an ending in terms of measuring time."

Key Features

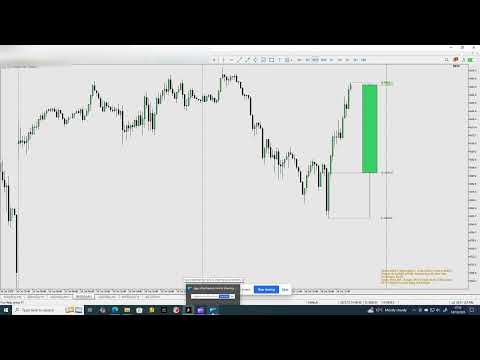
Visual HTF Candle Representation

  • Displays a single, clean HTF candle on the right side of your chart (multiple instances of the indicator can be used to show 2 or more candle, but the HTF parameter must be different between instances and also the offset from last candle must be changed from the default value). 
  • Shows real OHLC (Open, High, Low, Close) with proper body and wicks
  • Color-coded: Green for bullish candles, Red for bearish candles
  • Updates in real-time as the HTF candle develops

Reference Lines System

Three intelligent reference lines connect the HTF candle to your current price action:

  1. Open Reference Line - Connects from HTF period start to the candle's open
  2. High Reference Line - Extends from candle high to current time
  3. Low Reference Line - Extends from candle low to current time

These lines provide clear visual context of the HTF range development.

Advanced Phase Analysis 

This is what sets this version apart from others! The indicator includes intelligent PO3 phase detection displayed in the info panel:

  • ACCUMULATION - First third of HTF candle (0-33% completion)
  • MANIPULATION - Middle third, especially when price reaches extremes (33-66% completion)
  • EXPANSION - Active range development during manipulation phase
  • DISTRIBUTION - Final third of HTF candle (66-100% completion)

This automated phase analysis helps you understand WHERE you are in the institutional cycle at any moment.

Real-Time Countdown

The indicator shows exactly how many candles remain before the current HTF candle closes, allowing you to:

  • Time your entries with precision
  • Avoid entering late in the HTF cycle
  • Anticipate new HTF candle formation
  • Plan exits before distribution completes

Comprehensive Info Panel

Displays all critical information:

  • Current HTF timeframe and ratio (e.g., "H4 - Ratio: 1:4")
  • Candle type (Bullish/Bearish)
  • Range and body size in pips
  • Phase analysis (current PO3 stage)
  • Progress percentage and candle count
  • Countdown (candles remaining)
  • All OHLC price levels

Parameters

Higher Time Frame to represent (default: PERIOD_H4)

  • Select the Higher Time Frame to monitor
  • Available options: M1, M5, M15, M30, H1, H4, D1, W1, MN1
  • Must be higher than your current chart timeframe
  • The indicator automatically calculates the candle ratio

Examples:

  • Chart M5 + HTF H1 = 1:12 (12 M5 candles = 1 H1 candle)
  • Chart H1 + HTF H4 = 1:4 (4 H1 candles = 1 H4 candle)
  • Chart M15 + HTF D1 = 1:96 (96 M15 candles = 1 D1 candle)

Visual Settings

Offset from last candle (pixels) (default: 20)

  • Distance in pixels from the last chart candle to the HTF candle
  • Adjust to position the candle where you prefer on the right side

Candle width in pixels (default: 8)

  • Width of the HTF candle in pixels
  • Increase for better visibility, decrease for a more compact display

Bullish Candle Color (default: Lime)

  • Color for bullish HTF candles (Close > Open)

Bearish Candle Color (default: Red)

  • Color for bearish HTF candles (Close < Open)

Wick Color (default: Gray)

  • Color for candle wicks (upper and lower)

Outline Color (default: Black)

  • Color for the candle body outline

Show Candle Outline (default: true)

  • Toggle the black outline around the candle body

Reference Lines Settings

Show candle outline (default: true)

  • Enable/disable all three reference lines

    Connection lines color (default: Red)

    • Color for the connection lines

    Reference Line Style (default: STYLE_DOT)

    • Line style: STYLE_SOLID, STYLE_DASH, STYLE_DOT, STYLE_DASHDOT, STYLE_DASHDOTDOT

    Labels & Info Panel

    Show OHLC labels (default: true)

    • Display OHLC price labels next to the HTF candle

    Show info panel (default: true)

    • Display the comprehensive information panel

    Price label color (default: White)

    • Color for all text labels

    Price Label Font Size (default: 8)

    • Font size for labels and info panel

    Label Font (default: "Arial")

    • Font type for all text

    Info panel corner (default: CORNER_RIGHT_UPPER)

    • Position of the info panel on chart
    • Options: CORNER_LEFT_UPPER, CORNER_RIGHT_UPPER, CORNER_LEFT_LOWER, CORNER_RIGHT_LOWER

    Advanced Features

    Show countdown timer in info panel (default: true)

    • Display remaining candles until HTF candle closes
    • Essential for timing entries and exits

    Alert on new HTF candle (default: false)

    • Alert notification when a new HTF candle starts
    • Useful for multi-timeframe monitoring

    Why This Version is Superior

    Intelligent Phase Analysis

    Unlike basic HTF candle indicators that only show OHLC levels, this version includes automated PO3 phase detection. You can instantly see whether Smart Money is in:

    • Accumulation phase (building positions)
    • Manipulation phase (hunting stops, creating liquidity)
    • Expansion phase (active trend development)
    • Distribution phase (exiting positions)

    This analysis is based on time progress through the HTF candle and price position relative to the range, giving you institutional-level insight.

    Precision Countdown Timer

    The real-time countdown shows exactly how many candles remain before the HTF cycle completes. This is crucial because:

    • Entering during distribution (late stage) is high risk
    • Entering during accumulation (early stage) offers better R:R
    • You can anticipate manipulation phases
    • You know when to expect new HTF candle formation

    Complete Visual Context

    The three reference lines system provides unmatched clarity:

    • See exactly where the HTF period started
    • Understand how far price has travelled
    • Identify key institutional levels
    • Spot accumulation and distribution zones instantly

    Professional-Grade Implementation

    • Clean, non-cluttering single candle display
    • Pixel-perfect positioning that doesn't interfere with price action
    • Proper error handling (validates HTF > Chart TF)
    • Resource-efficient code
    • Compatible with all MT5 builds

    Use Cases

    Scalping & Day Trading

    • Use M15 or H1 HTF on M1/M5 charts
    • Enter during accumulation, exit before distribution
    • Use countdown to time precise entries

    Swing Trading

    • Use H4 or D1 HTF on H1/H4 charts
    • Identify larger institutional cycles
    • Avoid late entries by monitoring phase and countdown

    Multi-Timeframe Analysis

    • Stack multiple instances with different HTF settings
    • Monitor H1, H4, and D1 simultaneously on M15 chart
    • Align entries with multiple HTF cycles

    Backtesting & Study

    • Use MT5 Strategy Tester replay mode
    • Study historical PO3 patterns
    • Understand how institutions moved price
    • Perfect for ICT Mentorship students

      Tips for Best Results

      • Match HTF to your trading style: Scalpers use H1/H4, Swing traders use D1/W1
      • Use phase analysis: Only enter during accumulation phase for best R:R
      • Watch the countdown: Avoid entries when fewer than 30% of candles remain
      • Combine with other ICT concepts: Order blocks, Fair Value Gaps, Liquidity pools
      • Study in replay mode: Best way to learn PO3 patterns

      Support & Updates

      This indicator is designed for serious ICT traders who understand institutional price delivery. The phase analysis and countdown features make it an indispensable tool for timing entries within the Power of Three framework.

      Disclaimer: This indicator is for educational purposes. Always practice proper risk management and never risk more than you can afford to lose.


      리뷰 2
      Lierson José
      135
      Lierson José 2026.03.18 15:28 
       

      Excelent job bro! Let's go!

      man1980
      2188
      man1980 2026.01.17 01:12 
       

      The HTF PO3 indicator does a great job of identifying higher time frame market phases like accumulation, manipulation and expansion. it's especially useful for intraday traders because it adds clear context and helps avoid trading during trap conditions. When combined with smart money concepts, it works well as a bias and timing tool rather than an entry signal. overall it's a solid indicator for traders who want better structure and patience in their trading.

      추천 제품
      This Volume Delta Profile is an advanced MetaTrader 5 indicator that visualizes   volume delta (order flow imbalance)   using a volume profile-style histogram. It shows the difference between buying and selling pressure at specific price levels, helping traders identify supply and demand zones. This indicator provides a unique perspective on market dynamics by visualizing the imbalance between buying and selling pressure, offering insights beyond traditional volume analysis. Core Concept Positiv
      The MarketProfileTPO indicator for MetaTrader 5 is a powerful tool designed to bring the Market Profile concept, based on Time Price Opportunity (TPO) analysis , directly onto your main chart window. This indicator calculates and displays the price distribution over a specified period, highlighting key areas of market activity and concentration. It is particularly optimized for high-volatility instruments like NAS100, US30, and XAUUSD when used on the M1 (1-minute) timeframe, offering a detailed
      Total Volume Profile
      Shahabeddin Baset
      Includes almost all the concepts related to Volume Profile: POC , Value Area , Developing POC , Anchored VWAP , Volume Delta ; since the “Total” in its name. It is fast in its calculations and simple to work with. Features: 1.    Selectable calculation timeframe to find most traded levels. 2.    Capable of calculating Volume Profile based on tick data 3.    Adjustable histogram bars by their count. 4.    Adjustable histogram bars by their height (price range). 5.    Showing Value Area (VA
      MR Volume Profile 5
      Sergey Khramchenkov
      The "MR Volume Profile 5" indicator is a charting tool that displays trading volume at different price levels rather than time intervals. A key concept in volume profile is the point of control (POC)—the price level with the highest volume traded during the session or time range. While tools like VWAP or OBV provide volume trends, the "MR Volume Profile 5" indicator offers granular detail about where the most market activity occurs at specific price levels. This makes it a more precise tool for
      Price Volume Trend (PVT) Oscillator Description:  The PVT Oscillator is a volume indicator that serves as an alternative to the standard On-Balance Volume (OBV). While ordinary volume indicators can be noisy and hard to read, this tool converts volume flow into a clear Histogram Oscillator, similar to a MACD, but for Volume. It is designed to detect first  Trend Reversals and Divergences by analyzing the difference between a Fast and Slow PVT moving average. Why is this better than standard OBV?
      FREE
      # Smart Market Structure Suite The **Smart Market Structure Suite** is a technical analysis utility for MetaTrader 5 that integrates four distinct structural engines into a unified charting workspace. By combining structural high-low pivots, institutional order blocks with support-resistance flips, momentum-driven supply/demand zones, and divergence-proof oscillator levels, this utility helps traders identify key horizontal boundaries, order flow footprints, and structural transitions. The eng
      KT Volume Profile MT5
      KEENBASE SOFTWARE SOLUTIONS
      KT Volume Profile은 Y축에 히스토그램 형태로 거래량 누적 데이터를 시각화하여, 특정 시간대 및 가격 수준에서의 거래 활동을 확인할 수 있게 해주는 도구입니다. 이 기능은 트레이더가 거래가 집중된 가격 구간을 식별하는 데 매우 유용합니다. 볼륨 프로파일에서의 POC (Point of Control) POC는 전체 프로파일 중 가장 많은 거래량이 발생한 가격 수준을 나타냅니다. 일반적으로 주요 지지 또는 저항 영역으로 활용되며, 시장이 본격적인 방향 전환 전에 되돌림을 보이는 핵심 레벨로 작용할 수 있습니다. 주요 기능 사용법이 매우 간단합니다. 사각형을 차트에서 드래그 앤 드롭하면 실시간으로 볼륨 프로파일이 업데이트됩니다. 가격이 POC를 돌파할 경우 알림을 설정할 수 있습니다. 처음부터 경량화된 코드로 설계되어 CPU 및 메모리 자원 사용이 최소화됩니다. 입력 설정 볼륨 소스:   틱 볼륨 / 실제 거래량 프로파일 색상:   히스토그램 막대의 색상 박스 너비:  
      FX-AIEA Smart Supply and Demand Zone Identification Indicator (Supply and Demand Indicators MT5) Version: 2.51 | Compatible Platform: MetaTrader 5  Why do trades need supply and demand zones? Supply and demand zones are the core manifestation of institutional order flow, reflecting real buying and selling power more accurately than traditional support and resistance. However, manual drawing is not only time-consuming but also highly subjective and prone to missing key areas. FX-AIEA Supp
      Blahtech Market Profile MT5
      Blahtech Limited
      5 (10)
      Was: $249  Now: $99   Market Profile defines a number of day types that can help the trader to determine market behaviour. A key feature is the Value Area, representing the range of price action where 70% of trading took place. Understanding the Value Area can give traders valuable insight into market direction and establish the higher odds trade. It is an excellent addition to any system you may be using. Inspired by Jim Dalton’s book “Mind Over Markets”, this indicator is designed to suit the
      Entry Volume Zones mt5
      Part-time Day Trader
      Entry Volume Zones helps traders find better trade entry locations by highlighting recent volume-based support and resistance zones and key volume levels. The tool is designed mainly for planning trade entries, but it can also be used as a broader support and resistance indicator based on volume. Built for Traders Who Want To: Plan cleaner entries from strong volume-based support and resistance zones. Improve reward-to-risk potential by finding better entry locations, while keeping the original
      The Accumulation and Distribution indicator is a volume-based indicator that was essentially designed to measure underlying supply and demand. This is accomplished by trying to determine whether traders are actually accumulating (buying) or distributing (selling). This is accomplished by plotting a cumulative total of the money flow volume for each period. This indicator can reveal divergences between volume flow and actual price to primarily affirm a current trend or to anticipate a future reve
      VeloTicker PRO
      Alexandro Matos
      VeloTicker PRO — Real-Time Flow Reading VeloTicker PRO is an advanced indicator designed for traders looking to interpret market dynamics beyond just price. With an intuitive visual interface based on dual gauges (BUY vs. SELL), it transforms market flow into clear signals, enabling faster and more precise decision-making. What It Delivers Instant reading of buying and selling pressure Clear visualization in a gauge (speedometer) format Rapid response to market changes Intelligent smoot
      Wedge Pattern MT5
      Sathit Sukhirun
      Korean 이 보조지표는 차트 패턴 거래를 즐기는 트레이더를 위한 고급 차트 분석 비서 역할을 합니다. 시각적 분석의 부담을 줄이고 수익 창출의 정확성을 높이도록 설계되었습니다. 실제 사용 관점에서 본 이 보조지표의 주요 장점과 특징입니다: 1. 자동 패턴 감지 (Automated Pattern Detection) 시간 절약 및 편향(Bias) 감소: 수동으로 추세선을 그릴 필요가 없습니다. 인디케이터가 가격 스윙(Pivot High/Low)을 검색하고 가격 구조가 조건에 부합할 때 라이징 웨지(Rising Wedge, 상승 쐐기형) 및 폴링 웨지(Falling Wedge, 하락 쐐기형) 구조를 자동으로 그립니다. 모든 상황 포괄: 패턴이 형성되는 중, 브레이크아웃(돌파), 심지어 실패한 패턴까지 감지할 수 있어 시장의 전반적인 흐름을 명확하게 파악할 수 있습니다. 2. 내장된 목표가 및 피보나치 익절 (Built-in Targets & Fibonacci TP) 자동 목표가 계산:
      Normalized OBV
      Jose Miguel Soriano
      When looking at the information of On Balance Volume indicator, a question arises: is it a strong or weak movement? Should it be compared with previous days? These data should be normalized to always have a reference. This indicator presents the followings parameters: Normalization period (Max-Mins absolute) Smoothing period (-1 off) Tick/Real Volume Maximum number of bars to calculate (-1 off) Upper value normalization Lower value normalization Calculation: normOBV = (value - absMin) * (relMax
      No Demand No Supply MT5
      Trade The Volume Waves Single Member P.C.
      No Demand No Supply   This indicator identifies   No Demand –No Supply candles to your chart and plots volume bars colored according to the signal. It can be applied to all timeframes or to a specific one only. It can also be used as regular volume indicator  with exceptional future of WEIGHTED VOLUME. Furthermore is has an alert notification, sound and email when a signals occurs. The indicator does not repaint but the alert will come on two candles back due to the definition of No Demand No Su
      VPO Profile MT5
      Kyra Nickaline Watson-gordon
      5 (2)
      Definition : VPO is a Volume Price Opportunity. Instead of using bars or candles with an Open, High, Low, and Close price, each "bar" in a Market Profile is represented by horizontal bars against the price It is called Market Profile terminology. In other words volume-price-opportunity (VPO) profiles are histograms of how many volumes were traded at each price within the span of the profile. By using a VPO chart, you are able to analyze the amount of trading activity, based on volume, for each
      LevelsHunter Pro
      Dmitrii Kovalevskii
      LevelsHunter Pro – 전문가용 거래량 프로필 및 과거 분석 무엇인가요? LevelsHunter Pro는 현재 POC, VAH, VAL 레벨을 표시할 뿐만 아니라   과거로 돌아가   과거 거래 순간에 이 레벨들이 어디에 있었는지 볼 수 있는 거래량 프로필 지표입니다. 차트에서 추측하는 도구가 아닙니다. 이미 일어난 일을   냉정하게 분석 하기 위한 도구입니다. 트레이더에게 필요한 이유 문제점:   대부분의 지표는 '지금 여기'만 보여줍니다. 거래를 마감하고 실수를 분석하려고 하면 이미 레벨이 이동해 있습니다. POC가 진입가 위에 있었는지 아래에 있었는지 알 수 없습니다. 가격이 왜 반등했는지 또는 레벨을 돌파했는지 알 수 없습니다. 해결책:   LevelsHunter Pro는 모든 봉의 레벨을 기록합니다. 과거의 어떤 캔들이든 클릭하면 그 순간의 거래량 프로필을 정확히 볼 수 있습니다. 거래에서 어떻게 사용하나요? 1. 실시간 진입 개선 매수 신호가 보입니다. 가격이
      Dynamic Trend Sniper MT5
      Vincent Georges David Ferrier
      Trade Like an Institution. Protect Like a Professional. Early Sniper Access: Limited Launch Offer! Get ready to elevate your trading precision. We are offering an exclusive, highly limited launch price for the first Dynamic Trend Sniper users. Our Unbeatable Launch Offer: First 10 Snipers Only: $69 (Full lifetime access + all v1.x updates) Standard Retail Price (After 10 Purchases): $129 Why Act Now? This is not just a discount; it's a strategic entry point. We are committed to rewarding
      Daily Bias
      Barend Paul Stander
      Daily Bias Indicator with Statistics and Dashboard Unlock the power of market bias analysis with the Multi-Timeframe Bias Indicator, a versatile tool designed for traders seeking a clear edge in the markets. This indicator provides actionable insights by displaying Daily Bias, Weekly Bias, and Custom Period Bias, enabling you to align your trades with the prevailing market direction across multiple timeframes and symbols. Key Features: Daily Bias Analysis: Identify the bullish, bearish, or neutr
      ICT Silver Bullet Indicator is designed to make trading the Silver Bullet strategy easier and more efficient. It combines all key parts of the ICT Silver Bullet method and highlights them on the chart, so you can focus on placing trades. Each feature is highly customizable, allowing you to adjust settings and visuals to match your trading style and preferences. The control panel lets you quickly hide or show specific tools for clearer analysis. The indicator also includes an alert system that n
      Buy Sell Smart
      Syamsurizal Dimjati
      BUY and SELL smart The BUY and SELL Smart Indicator is a next-generation trading tool engineered for precision scalpers, intraday strategists, and professional analysts who demand both speed and clarity in market visualization. It seamlessly integrates smart candle-based analytics, adaptive ATR logic, and real-time economic event awareness — giving you a fully synchronized view of market volatility and momentum. Through an elegant and optimized interface, FlashScalp delivers   instant signal fee
      TRI Visualizer
      Yoshimi Mon 三 Ura
      TRI Visualizer MT5 – Thermodynamic Market Analysis Overview The TRI (Thermal Range Indicator) Visualizer Enhanced is a rare market analysis indicator that goes beyond conventional technical analysis, applying principles of thermodynamics from physics. It interprets market price fluctuations as “thermodynamic energy,” enabling the highly accurate detection of subtle market changes that are often overlooked. Innovative Mechanisms 1. Dual Calculation Engines Classic TRI Mode Formula: |Close
      Bar Size Pro
      Makarii Gubaydullin
      각 시간 프레임에서 가격 변동을 계산: 플로팅 또는 최근 마감 바. 다기능 유틸리티 : 66개 이상의 기능, 이 도구 포함  |   질문이 있으면 저에게 연락하세요   |    MT4 버전 계산할   쉬프트   를 선택할 수 있습니다: 플로팅 (현재) 바; 최근 마감 (이전) 바; 가격 값의 유형   은 상단 행의 파란색 스위치로 선택할 수 있습니다: 핍; 시장 포인트; 백분율 값 (%); 가격 값; 바 크기 계산 방법   은 파란색 버튼으로 선택할 수 있습니다: 몸통 : (시가 - 종가) 가격; 그림자 : (고가 - 저가) 가격; 유틸리티는 차트에 별도 창   으로 표시됩니다: 창은 차트의 모든 위치로 이동 가능: 어디서나 드래그; 인터페이스는 " ^ " 버튼으로 최소화 가능; 지표 설정에서 다음을 구성할 수 있습니다: 다크 / 라이트 인터페이스 테마; 인터페이스 크기 배율; 폰트 크기 및 스타일; 프로그램 파일은 " Indicators " 디렉토리에 배치해야 합니다.
      When looking at the volume information that moves the market, a question arises: is it a strong or weak movement? Should it be compared with previous days? These data should be normalized to always have a reference. This indicator reports the market volume normalized between 0-100 values. It has a line that smoothes the main signal (EMA). The normalization of values occurs within an interval defined by user (21 bars on default). User can also define any relative maximum, timeframe and number of
      Color Histogram Volume Set
      Ricardo Almeida Branco
      Do you use volume in your reading of the market? Certainly many traders use it, and do not imagine operating without it. The Color Histogram Volume Set indicator allows the user to choose the value that he considers interesting to monitor. When you pass this you will have visual confirmation and if you want you will also have the audible alert that is given by the indicator. Of course, there are other ways to try to find a high volume, such as assessing whether the volume is above av
      Overview Heiken Ashi CE Filtered MT5 is a technical indicator for the MetaTrader 5 platform. It integrates smoothed candlestick charting with a dynamic exit strategy and a customizable trend filter to deliver clear buy and sell signals. The indicator is designed to improve trend detection and signal reliability by reducing market noise. If you want to see more high-quality products or order the development/conversion of your own products, visit my partners' website: 4xDev Get 10% OFF on manual
      Advance Demand and Supply
      Oyinemomoemi Emeledor
      5 (1)
      This   Demand & Supply Zone Indicator with Volume Filtering   is a technical analysis tool for MetaTrader that identifies key price zones where buying (demand) or selling (supply) pressure is concentrated. It uses fractals, volume analysis, and price action to detect and highlight these zones on the chart. Key Features: Zone Detection Based on Fractals Identifies demand (support) and supply (resistance) zones using   fractal patterns   (local highs/lows). Zones are formed from   open prices   ar
      FREE
      MVProfile
      Patrick Omar Sanduyogan
      Market Volume Profile Indicator Built on Auction Market Theory , this indicator shows where price is accepted (high volume) and rejected (low volume). It helps you identify: POC / Value Areas → where price returns (fair value) LVN (Low Volume Nodes) → where price moves fast LVNs are most effective when located near the edges of VAH/VAL Strategy 1: Trend Model (Momentum Setup) When to use: Trending market (not balanced) Strong moves Higher highs / lower lows Breakout continuation How it works:
      Volume Profile Institutional Live
      Agustinus Biotamalo Lumbantoruan
      3 (1)
      Unlock the Power of Market Analysis with Precision Are you ready to take your trading to the next level? The "Institutional Volume Profile" indicator is here to empower your trading decisions like never before. Key Features: Custom Volume Profiles : Plot volume profiles effortlessly by simply adding horizontal lines or Fibonacci tools on your MetaTrader 5 chart. There's no limit to how many profiles you can create. Insightful Visualization : The indicator beautifully displays crucial information
      MT4 버전: https://www.mql5.com/en/market/product/166784 MT5 버전: https://www.mql5.com/en/market/product/166785 유동성 프로필 유동성 프로필은 차트에 잠재적 유동성 영역을 동적인 히트맵 스타일 프로필로 표시하는 시각적 시장 구조 도구입니다. 이 지표는 과거 가격 움직임과 틱 볼륨을 분석하여 유동성이 집중될 가능성이 높은 가격 영역을 강조 표시합니다. 다음을 표시합니다. 유동성 라인(잠재적 반응/스윕 레벨) 히트맵 프로필 박스(유동성 집중 영역) POC/최대 유동성 레벨(감지된 최고 집중도) 결과적으로 트레이더가 다음을 파악하는 데 도움이 되는 깔끔한 시각적 프로필이 생성됩니다. 잠재적 자석 레벨, 스윕 가능성이 높은 영역, 현재 가격 상/하의 반응 영역, 진입, 청산 및 위험 관리에 대한 맥락. 주요 기능 동적 유동성 히트맵 프로필 틱 거래량 가중 가격 영역 최대 유동성 지점(POC) 강조 표
      이 제품의 구매자들이 또한 구매함
      Neuro Poseidon MT5
      Daria Rezueva
      4.96 (26)
      Neuro Poseidon is a new indicator by Daria Rezueva. It combines precise trading signals with adaptive TP/SL levels - creating best possible trades as a result! Message me and get  Neuro Poseidon Assistant  as a gift to automize your trading process! What makes it stand out? 1. Proven profitability on all assets and timeframes 2. Only confirmed BUY and SELL signals present on the chart 3. Adaptive TP & SL levels generated by the software for each trade 4. Easy to understand - suitable for al
      SuperScalp Pro
      Van Minh Nguyen
      4.65 (26)
      SuperScalp Pro – 고급 멀티 필터 스캘핑 지표 시스템 SuperScalp Pro는 클래식 Supertrend와 여러 지능형 확인 필터를 결합한 고급 스캘핑 지표로, 거래 기회를 식별하는 데 도움을 줍니다. M1부터 H4까지 다양한 시간대에서 효율적으로 작동하며, XAUUSD, BTCUSD 및 주요 Forex 통화쌍에 최적화되어 있습니다. 이 지표는 명확한 매수 및 매도 신호를 제공하며, ATR 기반으로 진입가, 손절가, 익절가를 자동 계산하여 보다 효과적인 리스크 관리를 지원합니다. Fibonacci Take Profit 기능은 중요한 가격 구간에서 더 빠르게 포지션을 청산할 수 있도록 하며, 해당 수준 도달 시 알림을 전송합니다. 기본 설정은 Fibonacci Take Profit이 활성화된 상태로 최적화되어 있으며, 보다 안정적이고 일관된 거래 경험에 중점을 둡니다. 차트에 적용하는 것만으로 즉시 사용할 수 있습니다. 고급 사용자를 위해 모든 파라미터는 자유롭게 사용
      Divergence Bomber
      Ihor Otkydach
      4.9 (90)
      이 지표를 구매하신 분께는 다음과 같은 혜택이 무료로 제공됩니다: 각 거래를 자동으로 관리하고, 손절/익절 수준을 설정하며, 전략 규칙에 따라 거래를 종료하는 전용 도우미 툴 "Bomber Utility" 다양한 자산에 맞게 지표를 설정할 수 있는 셋업 파일(Set Files) "최소 위험", "균형 잡힌 위험", "관망 전략" 모드로 설정 가능한 Bomber Utility의 셋업 파일 이 전략을 빠르게 설치, 설정, 시작할 수 있도록 돕는 단계별 영상 매뉴얼 주의: 위의 모든 보너스를 받기 위해서는 MQL5 개인 메시지 시스템을 통해 판매자에게 연락해 주세요. 독창적인 커스텀 지표인 “Divergence Bomber(다이버전스 봄버)”를 소개합니다. 이 지표는 MACD 다이버전스(괴리) 전략을 기반으로 한 올인원(All-in-One) 거래 시스템입니다. 이 기술 지표의 주요 목적은 가격과 MACD 지표 간의 다이버전스를 감지하고, **향후 가격이 어느 방향으로 움직일지를 알려주는
      Entry In The Zone and SMC Multi Timeframe is a real-time 2-in-1 market analysis tool that combines market structure analysis and a No Repaint BUY / SELL signal system into a single indicator, built on Smart Money Concepts (SMC) — a widely adopted framework used by professional traders to understand market structure. This indicator helps you see the market more clearly, make decisions based on structure rather than guesswork, and focus on high-probability zones where price is more likely to react
      이 제품은 2026년 시장에 맞게 업데이트되었으며 최신 MT5 빌드에 최적화되었습니다. 가격 업데이트 안내: Smart Trend Trading System은 현재 $99 에 제공됩니다. 다음 30회 구매 후 가격은 $199 로 인상됩니다. 특별 혜택: Smart Trend Trading System 구매 후 저에게 개인 메시지를 보내시면 Smart Universal EA를 무료 로 받을 수 있으며, Smart Trend 신호를 자동 거래로 전환할 수 있습니다. Smart Trend Trading System은 리페인트 없음, 재그리기 없음, 지연 없음의 완전한 트레이딩 시스템으로, 더 깨끗한 신호, 더 나은 추세 방향, 그리고 더 체계적인 시장 거래 방식을 원하는 트레이더를 위해 제작되었습니다. Online course , manual and download presets . 이 시스템은 추세 감지, 반전 구간, Smart Cloud, 트레일링 스톱 로직, 지지와 저항, 캔들 색
      Power Candles MT5
      Daniel Stein
      5 (8)
      Power Candles V3 - 자체 최적화 강도 지표 파워 캔들 V3는 적용된 모든 차트에서 통화 및 상품의 강세를 실행 가능한 거래 계획으로 전환합니다. 단순히 캔들에 색상을 입히는 대신, 백그라운드에서 실시간 자동 최적화를 수행하여 현재 보고 있는 종목에 대한 최적의 손절매, 익절 및 신호 임계값을 제공합니다. 한 번의 클릭으로 실시간 거래에 적용할 수 있으며, 진입점, 손절매 및 익절 선이 정확한 가격에 맞춰 차트에 표시되고, 방향과 함께 알림이 발령됩니다. 이 도구는 Stein Investments 에코시스템의 일부입니다. 18개 이상의 도구와 함께 당신의 1대1 AI 트레이딩 멘토 Max.  항상 대기 중, 모든 인디케이터를 깊이 있게 이해, 무언가를 차근차근 생각해보고 싶은 순간에 도움을 줍니다.  https://stein.investments 에서 만나보세요 매 종가 바마다 3,000회 이상의 트레이딩 시뮬레이션. 9가지 강도 상태. 2가지 전략을 병렬로 테스트.
      SignalTech MT5
      Yue Wang
      5 (26)
      SignalTech is an unique fully rule based trading system delivers an Institutional approach for both Independent Traders and Prop Firm Challengers. Never Repaint. Push Notification available. No over-optimization. All the winning trades with chart setups are published on the comments page. 2026-05 4107 Pips (Until 05-29 NY Closed) 2026-04 2243 Pips 2026-03 2165 Pips 2026-02 2937 Pips 2026-01 2624 Pips 2025-12 1174 Pips It can generate signals with Buy/Sell Arrows, Push Notification (To Mobile) an
      PrimeScalping
      Temirlan Kdyrkhan
      PrimeScalping is a powerful trading companion designed to generate high-probability entry signals with dynamic TP/SL/DP levels based on volatility. Built-in performance tracking shows win/loss stats, PP1/PP2 hits, and success rates — all updated live. Key Features: Buy/Sell signals with adaptive volatility bands Real-time TP/SL/DP levels based on ATR Built-in MA Filter with optional ATR/StdDev volatility Performance stats panel (Success, Profit/Loss, PP1/PP2) Alerts via popup, sound, push, or e
      Quantum TrendPulse
      Bogdan Ion Puscasu
      5 (25)
      SuperTrend   ,   RSI   ,   Stochastic   의 힘을 하나의 포괄적인 지표로 결합하여 트레이딩 잠재력을 극대화하는 궁극의 트레이딩 도구   인 Quantum TrendPulse를   소개합니다. 정밀성과 효율성을 추구하는 트레이더를 위해 설계된 이 지표는 시장 추세, 모멘텀 변화, 최적의 진입 및 종료 지점을 자신 있게 식별하는 데 도움이 됩니다. 주요 특징: SuperTrend 통합:   주요 시장 추세를 쉽게 따라가고 수익성의 물결을 타세요. RSI 정밀도:   매수 과다 및 매도 과다 수준을 감지하여 시장 반전 시점을 파악하는 데 적합하며 SuperTrend 필터로 사용 가능 확률적 정확도:   변동성이 큰 시장에서 숨겨진 기회를 찾기 위해 확률적 진동   을 활용하고 SuperTrend의 필터로 사용 다중 시간대 분석:   M5부터 H1 또는 H4까지 다양한 시간대에 걸쳐 시장을 최신 상태로 유지하세요. 맞춤형 알림:   맞춤형 거래 조건이 충족되면
      Trend Catcher ind mt5
      Ramil Minniakhmetov
      5 (4)
      트렌드 캐처 인디케이터 트렌드 캐처 인디케이터는 개발자가 자체 개발한 맞춤형 적응형 트렌드 분석 지표들을 조합하여 시장 가격 움직임을 분석합니다. 단기적인 노이즈를 제거하고 근본적인 모멘텀 강도, 변동성 확대, 가격 구조 움직임에 집중하여 진정한 시장 방향을 파악합니다. 또한 이동 평균, RSI, 변동성 필터와 같은 맞춤형 지표들을 활용하여 가격을 평활화하고 트렌드를 필터링합니다. 실제 운영 모니터링 및 기타 제품은 다음 링크에서 확인하실 수 있습니다:   https://www.mql5.com/en/users/mechanic/seller 텔레그램에서는 EA나 설정 파일을 판매하지 않습니다. 사기이니 주의하세요. 모든 설정 파일은 블로그에서 무료로 제공됩니다. 중요! 구매 후 즉시 연락 주시면 사용 방법 및 보너스를 드립니다!
      소개       Quantum Breakout PRO   , 브레이크아웃 존 거래 방식을 변화시키는 획기적인 MQL5 지표! 13년 이상의 거래 경험을 가진 숙련된 트레이더 팀이 개발한       퀀텀 브레이크아웃 PRO       혁신적이고 역동적인 브레이크아웃 존 전략으로 거래 여정을 새로운 차원으로 끌어올리도록 설계되었습니다. Quantum Breakout Indicator는 5개의 이익 목표 영역이 있는 브레이크아웃 영역의 신호 화살표와 브레이크아웃 상자를 기반으로 한 손절 제안을 제공합니다. 초보자 거래자와 전문 거래자 모두에게 적합합니다. Quantum EA 채널:       여기를 클릭하세요 중요한! 구매 후 설치 매뉴얼을 받으려면 개인 메시지를 보내주십시오. 추천: 기간: M15 통화쌍: GBPJPY, EURJPY, USDJPY,NZDUSD, XAUUSD 계정 유형: 스프레드가 매우 낮은 ECN, Raw 또는 Razor 브로커 시간: GMT +3 중개인 :
      Gann Made Easy MT5
      Oleg Rodin
      5 (6)
      Gann Made Easy 는 mr.의 이론을 사용하여 최고의 거래 원칙을 기반으로 하는 전문적이고 사용하기 쉬운 Forex 거래 시스템입니다. W.D. 간. 이 표시기는 Stop Loss 및 Take Profit Levels를 포함하여 정확한 BUY 및 SELL 신호를 제공합니다. PUSH 알림을 사용하여 이동 중에도 거래할 수 있습니다. 구매 후 거래 방법 안내 및 유용한 추가 지표를 무료로 받으시려면 저에게 연락주세요! 아마도 Gann 거래 방법에 대해 이미 여러 번 들었을 것입니다. 일반적으로 Gann의 이론은 초보자 거래자뿐만 아니라 이미 거래 경험이 있는 사람들에게도 매우 복잡한 것입니다. Gann의 거래 방식은 이론적으로 적용하기 쉽지 않기 때문입니다. 나는 그 지식을 연마하고 Forex 지표에 최고의 원칙을 적용하기 위해 몇 년을 보냈습니다. 표시기는 적용하기가 매우 쉽습니다. 차트에 첨부하고 간단한 거래 권장 사항을 따르기만 하면 됩니다. 지표는 지속적으로 시장 분석
      FX Trend MT5 NG
      Daniel Stein
      5 (6)
      FX Trend NG: 차세대 멀티 마켓 트렌드 인텔리전스 개요 FX Trend NG 는 다중 시간 프레임 기반의 전문 트렌드 분석 및 시장 모니터링 도구입니다. 몇 초 만에 전체 시장 구조를 파악할 수 있도록 설계되었습니다. 여러 차트를 일일이 전환할 필요 없이, 어떤 종목이 추세에 있는지, 어디에서 모멘텀이 약화되고 있는지, 그리고 어떤 시간 프레임이 서로 정렬되어 있는지 즉시 확인할 수 있습니다. 출시 기념 특별 혜택 – FX Trend NG 를 $30 (6개월) 또는 $80 평생 라이선스 로 이용할 수 있습니다. 이미 Stein Investments 고객이신가요? -> 메시지를 보내 전용 고객 그룹에 참여하세요. 설정이나 사용 방법이 필요하신가요? -> Stein Investments 공식 페이지 를 방문하세요. 1. FX Trend NG가 특별한 이유 3단계 추세 로직 – 단순한 Buy / Sell이 아닙니다 • 대부분의 지표는 Buy 또는 Sell 두 가지 상태만 제
      M1 Quantum MT5
      Hamed Dehgani
      5 (1)
      M1 Quantum 은 M1 전용 전문 트레이딩 시스템으로, 손절(Stop Loss), 익절(Take Profit), 그리고 스마트 자금 관리 기능이 내장된 빠르고 정확한 거래 신호를 제공합니다. M1 Quantum 은 연속 수익 거래 에 집중하여 계좌를 빠르게 성장시키도록 설계된 전문 자금 관리 시스템을 포함하고 있습니다. M1 Quantum 인디케이터 의 주요 기능 M1 타임프레임 및 모든 주요 통화쌍 용으로 설계됨 모든 거래에 손절과 익절 적용 자금 관리 시스템 이 포함되어 트레이더가 쉽게 거래할 수 있도록 안내 높은 승률 및 높은 연속 수익률 리페인트 없음, 지연 없음 모든 트레이더가 쉽게 이해 가능 M1 Quantum 을 사용하려면 M1 Quantum Assistant 가 필요합니다. 이 강력한 도구는 모든 M1 Quantum 구매자에게 무료로 제공됩니다 . M1 Quantum Assistant 다운로드 최신 업데이트와 새로운 제품 출시 소식을 받으려면 제 MQL5 채널 에
      Meridian Pro
      Ottaviano De Cicco
      5 (2)
      Meridian Pro 2.00: Professional Multi-Timeframe Trend Matrix for MT5 Meridian Pro 2.00 is a professional adaptive trend matrix for MetaTrader 5. It combines the original Meridian trend engine, a clean chart ribbon, closed-bar signal arrows, an 8-timeframe dashboard, Fuel momentum, weighted consensus, synthetic HTF processing and chart-native higher-timeframe context lines. The goal is simple: read current trend, multi-timeframe structure, strength, momentum and EA-ready state from one discipline
      Atomic Analyst MT5
      Issam Kassas
      4.26 (35)
      이 제품은 2026년 시장에 맞게 업데이트되었으며 최신 MT5 빌드에 최적화되었습니다. 가격 업데이트 안내: Atomic Analyst는 현재 $99 에 제공됩니다. 다음 30회 구매 후 가격은 $199 로 인상됩니다. 특별 혜택: Atomic Analyst 구매 후 저에게 개인 메시지를 보내시면 Smart Universal EA를 무료 로 받을 수 있으며, Atomic Analyst 신호를 자동 거래로 전환할 수 있습니다. Atomic Analyst는 리페인트 없음, 재그리기 없음, 지연 없음의 Price Action 거래 인디케이터로, 수동 거래, 신호 명확성, EA 자동화를 위해 설계되었습니다. User manual: settings, inputs and strategy. 가격 움직임, 강도, 모멘텀, 다중 시간대 방향 및 고급 필터를 분석하여 트레이더가 노이즈를 줄이고 약한 세팅을 피하며 더 체계적인 거래 결정을 내릴 수 있도록 돕습니다. 이 인디케이터는 복잡한 시장 계산
      SmartScalping
      Temirlan Kdyrkhan
      SmartScalping is a powerful trading companion designed to generate high-probability entry signals with dynamic TP/SL/DP levels based on volatility. Built-in performance tracking shows win/loss stats, PP1/PP2 hits, and success rates — all updated live. Key Features: Buy/Sell signals with adaptive volatility bands Real-time TP/SL/DP levels based on ATR Built-in MA Filter with optional ATR/StdDev volatility Performance stats panel (Success, Profit/Loss, PP1/PP2) Alerts via popup, sound, push, or e
      ARIPoint
      Temirlan Kdyrkhan
      1 (1)
      ARIPoint is a powerful trading companion designed to generate high-probability entry signals with dynamic TP/SL/DP levels based on volatility. Built-in performance tracking shows win/loss stats, PP1/PP2 hits, and success rates all updated live. Key Features: Buy/Sell signals with adaptive volatility bands Real-time TP/SL/DP levels based on ATR Built-in MA Filter with optional ATR/StdDev volatility Performance stats panel (Success, Profit/Loss, PP1/PP2) Alerts via popup, sound, push, or email Cu
      이 제품은 2026년 시장에 맞게 업데이트되었으며 최신 MT5 빌드에 최적화되었습니다. 가격 업데이트 안내: Smart Price Action Concepts는 현재 $200 에 제공됩니다. 다음 30회 구매 후 가격은 $299 로 인상됩니다. 특별 혜택: 구매 후 저에게 개인 메시지를 보내시면 무료 보너스 + 선물 을 받을 수 있습니다. 먼저, 이 트레이딩 도구는 리페인트 없음, 재그리기 없음, 지연 없음의 인디케이터이므로 전문적인 트레이딩에 적합하다는 점을 강조하고 싶습니다. Online course , and manual Smart Price Action Concepts Indicator는 초보자와 경험 많은 트레이더 모두에게 매우 강력한 도구입니다. 20개 이상의 유용한 인디케이터를 하나로 결합하고, Inner Circle Trader Analysis와 Smart Money Concepts Trading Strategies 같은 고급 트레이딩 아이디어를 통합합니다. 이 인디
      TrendProMaster
      Temirlan Kdyrkhan
      MasterTrend Indicator for MT5 A powerful trend-following and signal-evaluation tool MasterTrend   is a custom MT5 indicator that combines Moving Averages and ATR-based risk/reward logic to generate clear buy/sell signals. It visualizes dynamic SL/TP levels, evaluates past trade outcomes, and displays win/loss statistics in a clean on-chart panel. Key features include: Buy/Sell signals based on MA crossovers ATR-based SL/TP1/TP2/TP3 levels with visual lines and labels Signal outcome tracking wit
      M30/H1/H4 스윙 버전 출시 큰 움직임을 잡고 싶으신가요? Gold Signal Swing Pro (M30/H1/H4). 목표: 거래당 $20-$80+. https://www.mql5.com/en/market/product/177643 KURAMA GOLD SIGNAL PRO (MT5) — 7층 필터 탑재 XAUUSD 완벽 트레이딩 시스템 리페인트 없음. 리드로우 없음. 지연 없음. 모든 신호는 확정 후 변하지 않습니다. 구매자 한정 혜택: 매수 라이선스 구매자에게 AI Zone Radar ($59 상당) + PDF 매뉴얼을 무료 제공합니다. 구매 후 MQL5에서 메시지를 보내주세요. AI Zone Radar: https://www.mql5.com/en/market/product/175834 실제 골드 트레이더 커뮤니티에서 사용되며, 정확도와 사용 편의성으로 높은 평가를 받고 있습니다.
      Azimuth Pro
      Ottaviano De Cicco
      5 (7)
      Azimuth Pro V2: Synthetic Fractal Structure and Confirmed Entries for MT5 Overview Azimuth Pro is a multi-level swing structure indicator by Merkava Labs . Four nested swing layers, swing-anchored VWAP, ABC pattern detection, three-timeframe structural filtering, and closed-bar confirmed entries — one chart, one workflow from micro-swings to macro-cycles. This is not a blind signal product. It is a structure-first workflow for traders who care about location, context, and timing. V2 Launch Offe
      RelicusRoad Pro MT5
      Relicus LLC
      4.96 (24)
      RelicusRoad Pro: 퀀트 시장 운영 체제 70% 할인 평생 이용권 (한정 시간) - 2,000명 이상의 트레이더와 함께하세요 왜 대부분의 트레이더는 "완벽한" 지표를 가지고도 실패할까요? 진공 상태에서 단일 개념 만으로 거래하기 때문입니다. 문맥 없는 신호는 도박입니다. 지속적인 승리를 위해서는 컨플루언스(중첩) 가 필요합니다. RelicusRoad Pro는 단순한 화살표 지표가 아닙니다. 완전한 퀀트 시장 생태계 입니다. 독점적인 변동성 모델링을 사용하여 가격이 이동하는 "공정 가치 로드"를 매핑하고, 단순 노이즈와 실제 구조적 돌파를 구분합니다. 추측은 그만두세요. 기관급 로드 로직으로 거래를 시작하세요. 핵심 엔진: "Road" 알고리즘 시스템의 중심에는 시장 상황에 실시간으로 적응하는 동적 변동성 채널인 Road Algo 가 있습니다. 세이프 라인(평형) 과 가격이 수학적으로 반전될 가능성이 높은 확장 레벨 을 투영합니다. Simple Road: 일반적인 시장을 위
      ScalpPoint
      Temirlan Kdyrkhan
      ScalpPoint is a powerful trading companion designed to generate high-probability entry signals with dynamic TP/SL/DP levels based on volatility. Built-in performance tracking shows win/loss stats, PP1/PP2 hits, and success rates — all updated live. Key Features: Buy/Sell signals with adaptive volatility bands Real-time TP/SL/DP levels based on ATR Built-in MA Filter with optional ATR/StdDev volatility Performance stats panel (Success, Profit/Loss, PP1/PP2) Alerts via popup, sound, push, or emai
      Crystal Heikin Ashi Signals
      Muhammad Jawad Shabir
      5 (2)
      Crystal Heikin Ashi Signals - Professional Trend & Signal Detection Indicator Advanced Heikin Ashi Visualization with Intelligent Signal System for Manual & Automated Trading Final Price: $149 ---------> Price goes up $10 after every 10 sales . Limited slots available — act fast . Overview Crystal Heikin Ashi Signals is a professional-grade MetaTrader 5 indicator that combines pure Heikin Ashi candle visualization with an advanced momentum-shift detection system. Designed for both manual traders
      FX Power MT5 NG
      Daniel Stein
      5 (32)
      FX Power: 통화 강세 분석으로 더 스마트한 거래 결정을 개요 FX Power 는 어떤 시장 상황에서도 주요 통화와 금의 실제 강세를 이해하기 위한 필수 도구입니다. 강한 통화를 매수하고 약한 통화를 매도함으로써 FX Power 는 거래 결정을 단순화하고 높은 확률의 기회를 발견합니다. 트렌드를 따르거나 극단적인 델타 값을 사용해 반전을 예측하고자 한다면, 이 도구는 귀하의 거래 스타일에 완벽히 적응합니다. 단순히 거래하지 말고, FX Power 로 더 스마트하게 거래하세요. 1. FX Power가 거래자에게 매우 유용한 이유 통화와 금의 실시간 강세 분석 • FX Power 는 주요 통화와 금의 상대적 강세를 계산하고 표시하여 시장 역학에 대한 명확한 통찰력을 제공합니다. • 어떤 자산이 앞서고 있고 어떤 자산이 뒤처지는지 모니터링하여 보다 현명한 거래 결정을 내릴 수 있습니다. 포괄적인 멀티 타임프레임 뷰 • 단기, 중기 및 장기 타임프레임에서 통화와 금의 강세를
      Meta Trend PRO MT5
      Roman Podpora
      5 (1)
      메타 트렌드 프로       — 는 추세 추종 도구로, 거래에서 추측을 배제하고 시장이 이미 결정을 내린 지점을 보여줍니다. 이 지표는 추세, 추세선 및 구조가 변화하는 주요 지점을 식별하고 주요 참여자들이 포지션을 취할 수 있도록 가격이 되돌아오는 영역을 강조합니다. 단순히 가격 움직임만 보는 것이 아니라, 그 이면에 숨겨진 논리까지 이해할 수 있습니다. 모든 신호는 캔들 마감 후 기록되며, 다시 그려지지 않고 차트에 저장되므로 상황을 확실하게 분석하고 결정을 내릴 수 있습니다. 거래 목표(이익 실현) 또한 표시됩니다. 이 지표의 효과에 대해 완벽한 확신을 가지실 수 있도록 자동 통계 자료를 제공해 드립니다. 방향 전환 후에는 손절매 수준과 해당 수준이 지능적으로 점진적으로 이동하는 모습(Move SL)을 표시해주는데, 이는 매우 중요합니다.       감소시킨다       위험       위치별로. 손절매/이익실현/RR 오른쪽에 내장된 패널은 현재 글로벌 추세 방향의 시장 진입
      Meravith MT5
      Ivan Stefanov
      5 (1)
      마켓 메이커를 위한 도구. Meravith는 다음과 같은 기능을 제공합니다: 모든 타임프레임을 분석하고 현재 유효한 추세를 표시합니다. 강세와 약세 거래량이 동일한 유동성 구간(거래량 균형 구간)을 강조 표시합니다. 서로 다른 타임프레임의 모든 유동성 레벨을 차트에 직접 표시합니다. 텍스트 기반 시장 분석을 생성하여 참고용으로 제공합니다. 현재 추세를 기반으로 목표가, 지지선 및 손절가를 계산합니다. 거래의 위험 대비 보상 비율(Risk/Reward)을 계산합니다. 계좌 잔고에 따라 포지션 크기를 산출하고 잠재 수익을 추정합니다. 시장에 중대한 변화가 발생할 경우 경고도 제공합니다. 지표의 주요 라인: 강세/약세 거래량 소진 라인 — 목표가로 사용됩니다. 시장 추세를 나타내는 라인. 시장이 강세인지 약세인지에 따라 색상이 변경되며 추세 지지선 역할을 합니다. 색상은 주로 시장 심리를 보여줍니다. 거래량 균형선(Eq). Eq(Volume Equilibrium) 라인은 시스템의 핵심입니
      Trend Screener Pro MT5
      STE S.S.COMPANY
      4.85 (104)
      트렌드 표시기, 트렌드 트레이딩 및 필터링을 위한 획기적인 고유 솔루션, 하나의 도구 안에 내장된 모든 중요한 트렌드 기능! Forex, 상품, 암호 화폐, 지수 및 주식과 같은 모든 기호/도구에 사용할 수 있는 100% 다시 칠하지 않는 다중 시간 프레임 및 다중 통화 표시기입니다. Trend Screener는 차트에 점이 있는 화살표 추세 신호를 제공하는 효율적인 지표 추세 추종 지표입니다. 추세 분석기 표시기에서 사용할 수 있는 기능: 1. 트렌드 스캐너. 2. 최대 이익 분석이 있는 추세선. 3. 추세 통화 강도 측정기. 4. 경고가 있는 추세 반전 점. 5. 경고가 있는 강력한 추세 점. 6. 추세 화살표 Trend Screener Indicator가 있는 일일 분석 예, 일일 신호 성능...등은 여기에서 찾을 수 있습니다. 여기를 클릭하십시오. LIMITED TIME OFFER : Trend Screener Indicator는 50$ 및 평생 동안만 사용할 수 있습니다.
      MasterTrend
      Temirlan Kdyrkhan
      MasterTrend Indicator for MT5 A powerful trend-following and signal-evaluation tool MasterTrend   is a custom MT5 indicator that combines Moving Averages and ATR-based risk/reward logic to generate clear buy/sell signals. It visualizes dynamic SL/TP levels, evaluates past trade outcomes, and displays win/loss statistics in a clean on-chart panel. Key features include: Buy/Sell signals based on MA crossovers ATR-based SL/TP1/TP2/TP3 levels with visual lines and labels Signal outcome tracking wit
      제작자의 제품 더 보기
      HTF Power of Three (ICT) -  MT4 Indicator - Version 1.1 Overview The   HTF Power of Three   indicator is a professional implementation of the Inner Circle Trader's (ICT) Power of Three concept, inspired by Larry Williams. This indicator visualizes higher timeframe (HTF) candle development in real-time on any lower timeframe chart, making it an essential tool for ICT traders who study institutional price movement patterns. What is Power of Three (PO3)? Power of Three represents a three-staged Sma
      Canvas Footprint
      Antonio Molinaro
      Footprint Indicator for MT5 1. Introduction  This Indicator provides a real-time footprint and volume profile visualization per candle directly on MetaTrader 5 charts, allowing traders to analyze order flow, volume distribution, and market pressure with precision.  2. Installation  1. Copy the Indicator file into the MetaTrader 5 /Indicators folder.  2. Restart MetaTrader 5.  3. Drag the Indicator onto a chart.  3. Indicator Overview  The Indicator renders a footprint representation for each
      Market 3 Sessions Indicator
      Antonio Molinaro
      3.67 (3)
      Session Box Indicator for MetaTrader 5 IMPORTANT NOTE: **A new input parameter ( Skip weekends  )  has been introduced which must be set to false for markets opened 24/7** Version 1.00 Release Version 1.01 Complete code rewrite Version 1.02 Fix: added missing font name and removed emoji as session name, added label positioning Version 1.03 Fix: proper weekend handling, complete minute support for all sessions, independent label position Description: The SessionBox indicator is designed to visu
      FREE
      Session Box Indicator for MetaTrader 4 IMPORTANT NOTE: **A new input parameter ( Skip weekends  )  has been introduced which must be set to false for markets opened 24/7** Version 1.00 Release Version 1.01 Complete code rewrite Version 1.02 Fix: added missing font name and removed emoji as session name, added label positioning Version 1.03 Fix: proper weekend handling, complete minute support for all sessions, independent label position Description: The SessionBox indicator is designed to visu
      Range Bar Pro
      Antonio Molinaro
      Range Bar Pro Indicator for MetaTrader 5 Visualize market trends, levels and other features with Range Bar Pro, an innovative indicator that draws a unique, standalone candle on the right side of any MT5 chart. This single candle is generated from an analysis of price over a specified range, providing you with a powerful snapshot of the market. Key Features: Single-Candle Visualization: Gain quick insights with a single, specially derived candle that reflects comprehensive price movement over a
      ADX Candles Color
      Antonio Molinaro
      ADX-Based Candle Color Indicator for MT5 Description:   Enhance your trading experience with the ADX-Based Candle Color Indicator for MT5! This powerful tool colors candlesticks based on the Average Directional Index (ADX) indicator, helping you quickly assess market strength and direction at a glance. Key Features:   - Color-Coded Candles:     - Green (Bullish) when D+ > D-.     - Red (Bearish) when D- > D+.   - Intensity Mapping:       The color intensity reflects the ADX value—stronger col
      In trading, the Master Pattern (sometimes called the market master pattern ) is a conceptual framework describing how price typically moves as capital flows through markets. It is not a rule-set, but a recurring structural sequence driven by institutional behaviour, liquidity, and crowd psychology. Different trading schools describe it with different names, but the underlying logic is largely the same. Core Idea Markets tend to move through a repeating cycle: Accumulation → Expansion → Distribut
      필터:
      Lierson José
      135
      Lierson José 2026.03.18 15:28 
       

      Excelent job bro! Let's go!

      Antonio Molinaro
      1948
      개발자의 답변 Antonio Molinaro 2026.03.19 14:41
      Thank you Jose`, I'm glad you are happy.
      man1980
      2188
      man1980 2026.01.17 01:12 
       

      The HTF PO3 indicator does a great job of identifying higher time frame market phases like accumulation, manipulation and expansion. it's especially useful for intraday traders because it adds clear context and helps avoid trading during trap conditions. When combined with smart money concepts, it works well as a bias and timing tool rather than an entry signal. overall it's a solid indicator for traders who want better structure and patience in their trading.

      Antonio Molinaro
      1948
      개발자의 답변 Antonio Molinaro 2026.03.19 14:43
      Thanks a lot for the 5*. I'm happy you find it useful.
      리뷰 답변