
The correct way to choose an Expert Advisor from the Market
Contents
- Introduction
- The right understanding of the market for the best user experience
- Key rules for evaluating automated trading systems
- Key Expert Advisors operation mechanisms
- Main nuances of Expert Advisor testing
- Composite metrics
- Be careful
- Live account monitoring
- Some tricks
- Portfolio diversification to reduce risks and to increase profits
- Summary
- Conclusion
Introduction
Today the MetaTrader Market is the largest community of traders, users and programmers who have the same purpose: profit from investment markets. There are many discussions in the forum regarding the products presented in this resource and their quality. In this article, I will check all these statements and show the wide opportunities provided by the Market to all those, who are still in doubt. Furthermore, we will see if it is possible to find a worthy product here and if it is, we will try to find out how.
The right understanding of the market for the best user experience
Any marketplace has different types of products, including very good and very bad once, as well as something in between. The Market is no exception. The MQL5 Market features so many products, that only those users who have a negative attitude towards this marketplace find it hard or almost impossible to find a desired product. What such users can say:
- I tested a hundred of systems, but I didn't find anything
- If I couldn't write a Holy Grail, then it does not exist
- There cannot be any Holy Grail
- The terminal cannot provide enough data to analyze
- An Expert Advisor cannot analyze the market as efficiently as a human can
- No one would sell really working systems
- The system must generate +100% per month; 100% per year is too little
- The more expensive the Expert Advisor and the higher its rating, the better the EA
- One year of a positive monitoring is reliable
- I misinform the buyers and discredit the marketplace because I cannot earn here
- I am a forum guru
- I was born on Wall Street
And similar things. There can be different statements, but the main idea is related to the thought that if someone has a bad experience, the reason for that failure is in the marketplace itself, but not in the person.
The marketplace is not responsible for someone's purchasing a low-quality product (in their opinion). The function of the marketplace is to bring the buyer and the seller together, and that's all. I think that this function is successfully implemented here. A large number of products and services gives rise to competition. If you are not able to compete, this may be a good reason to invest in self-development. If you have the required knowledge, you will not be deceived easily and will be able to find a working solution among the abundance of products presented in the resource. Spend some time: where there is a will there is a way.
In this article, we will consider in detail how to find working trading systems and signals efficiently and accurately. We will look at the entire process, from beginning to end, using examples from the Market, without disclosing their authors' names of course.
Key rules for evaluating automated trading systems
Before we proceed to analyzing the examples, let us first define the rules and criteria according to which we should analyze the products featured in the marketplace. Oddly enough, most of the people do not understand what a profitable Expert Advisor or signal is, and how to distinguish a really working solution from an imitation. Based on my experience in writing automated trading systems in MQL4 and MQL5, I have developed quite clear and effective criteria for selecting a potential Expert Advisor which can turn into the so-called "Grail" if executed perfectly. First, I will share these rules here and then I will explain the meaning of each of them. The rules are as follows:
- Correctly chosen testing period duration in the strategy tester
- Correct evaluation of the Expert Advisor operation (by bars or ticks)
- Evaluation of available terminal data
- If possible, testing on the timeframes close to the one offered by the author
- The correct number of independent backtests for different trading instruments
- The ability to test with a visualization and see what's behind
- Proper testing paradigms (testing sequence and ability to make the right conclusions from it)
- Correct spreads used when testing a trading system in the strategy tester (in MetaTrader 5 it is achieved by testing on real ticks)
- Correct evaluation of all performed backtests
- The availability of a real account monitoring
- Correct analysis of the real account monitoring
- Forward testing as one of the methods to detect overfitting
- The understanding of the optimization process and of its influence on the forward period
- The understanding of the random walk processes and their influence on trading
- The understanding of the specifics of the MetaTrader 4 and MetaTrader 5 testers and differences between them (advantages and disadvantages)
- If possible, your own experience in developing trading systems
- Knowledge of the key money management mechanisms and or their influence on trading
- Understanding the difference between backtests and real trading
- Understanding of differences between demo and real accounts
- Knowledge and understanding of the most popular trading systems
- Knowledge in mathematics, including the probability theory in relation to the market
- Knowledge of the truth about the market (you can call experience)
As you can see, we have quite a lengthy list. Furthermore, each item has a lot of nuances and secrets. Each of these nuances affects the result in its own way. Here we will consider the minimum required basics which will assist you in starting to efficiently analyze the products featured in the marketplace. If you understand that the most part of the list is not available to you, it is not a problem. In this article, you will see that there is nothing particularly difficult in it. I am sure that anyone, even the person who is using the platform for the first time, will be able to get rid of fear and select a good product at an affordable price using a set of simple rules or at least will find the simple answers to some of the vital questions. Read the article to the end and you will see how easy it is.
Key Expert Advisors operation mechanisms
We will consider the first three items in the list in combination. Based on my experience testing my own and other developers' systems, as well as on the experience of other users, I can say that there are several types of Expert Advisors:
- EAs using ticks
- EAs using bars
- EAs working by timer
As you can see, there are not many types. For example, if an EA works by ticks, it performs all calculations and trading actions only after the emergence of this event. The second type is a little more complex. Previously I was developing tick-based robots, and now I have switched to the EAs running by bars. Unfortunately, in MQL4 and MQL5 Expert Advisors there is no possibility to receive new bar emergence events. But it can be implemented in a different way, using the additional functionality. This is directly related to the length of the testing interval. The third type of Expert Advisors work by timer. Not all such EAs can be correctly tested in the Strategy Tester. Often developers can justify this selection, but I am very skeptical about such solutions.
If an Expert Advisor follows ticks, this automatically creates additional risks and difficulties in use. Such EAs are usually very sensitive to ping, especially if they trade using market orders. For them, even a delay of 50 milliseconds can be critical. In such cases, people rent VPS close to trading servers to minimize such effects.
If the robot uses pending orders, it is possible to almost completely eliminate such negative situations. In any case, such systems can generate more profit or reduce possible losses.
According to my experience, the most stable are the systems following bars — I will prove it at the end of the article using my own developments. Of course, it is possible to find the systems which show good profit based on tick data, but it is much more difficult. I mention this because the purpose of this article to provide the easiest way to make the right decision.
According to the above ideas, the most important part is to test the systems based on the following principles:
- The EA follows ticks
- The EA follows bars
Let's see how these events are implemented in code. Here is the new tick emergence event:
//+------------------------------------------------------------------+
//| Expert tick function                                             |
//+------------------------------------------------------------------+
void OnTick()
  {
  //some logic
  }
A tick is each new price received from the server. If the price changes on the server, the server sends this event to all clients. Bar-wise operation can be implemented using this event and additionally applying a filtering function:
//+------------------------------------------------------------------+
//| Expert new bar function                                          |
//+------------------------------------------------------------------+
datetime PrevTimeAlpha=0;
bool bNewBar()
   {
   if ( Time[1] > PrevTimeAlpha )
       {
       if ( PrevTimeAlpha > 0 )
          {
          PrevTimeAlpha=Time[1];
          return true;
          }
       else
          {
          PrevTimeAlpha=Time[1];
          return false;
          }
       }
   else return false;
   }
This is an example of how I do it. There are other possible methods. What's important, all these functions will eventually be used inside the OnTick event:
void OnTick()
  {
  if ( bNewBar() ) { /*some logic*/ }
  }
Below is the timer event:
//+------------------------------------------------------------------+
//| Timer function                                                   |
//+------------------------------------------------------------------+
void OnTimer()
  {
  //some logic
  }
It can be seen that, just like in the previous events, all the logic originates from the event, and any Expert Advisor code works precisely thanks to these events. The timer event should previously be set for the desired period in milliseconds during EA launch:
//+------------------------------------------------------------------+
//| Expert initialization function                                   |
//+------------------------------------------------------------------+
int OnInit()
  {
   EventSetTimer(60);
   return(INIT_SUCCEEDED);
  }
That's all. We have seen three possible EA logic paradigms, which is enough for further analysis. Of course, there can be many other events, but algo traders use them rarely because they are very exotic and situational.
Main nuances of Expert Advisor testing
First of all, understanding of the basics gives us the first idea of how Expert Advisors operate. If we consider the issue in more detail, we will see that, for example, tick-based testing can be implemented in two ways in the Strategy Tester:
- The artificial generation of ticks inside a bar using a predefined formula
- Loading of real ticks from the broker server
Both options are implemented both in MetaTrader 4 and in MetaTrader 5. The only difference is that in the fifth terminal version, testing by ticks is available right out of the box, while the previous generation platform requires additional software. Therefore, if you can use MetaTrader 5, better test in its Strategy Tester as it is much more convenient.
Please note that real tick and bar data take up much disk space. Due to this, brokers may store only a limit amount of the relevant data on their servers. How to know the amount of data available for instruments? It's not a problem. The capability is implemented in MetaTrader 5. The main panel of the terminal has the "symbols" button:

A click on it opens the window with the required information on ticks and bars. To find out the number of ticks available in your broker's database, you can specify the desired symbol and time interval, and then click "Request". The relevant tick data will be downloaded from the server:
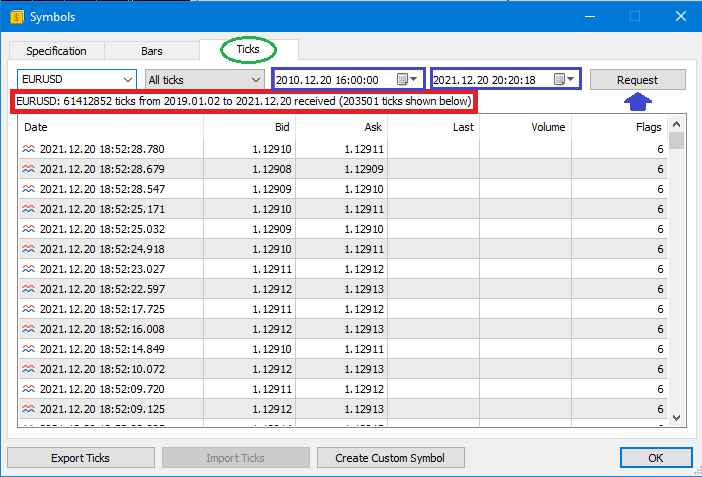
If ticks received from the server are less than the period you specified, you will receive a relevant message — it is highlighted with red borders in the figure above. This message suggests from which data you can start testing in the real-tick mode. If you set the period for which real ticks are not available, the platform will generate modeled ticks. Testing of tick-based Expert Advisors using modeled ticks can generate distorted results, but now you know how to avoid it. You can use bar-based Expert Advisor which do not have this drawback!
The same with the bars:
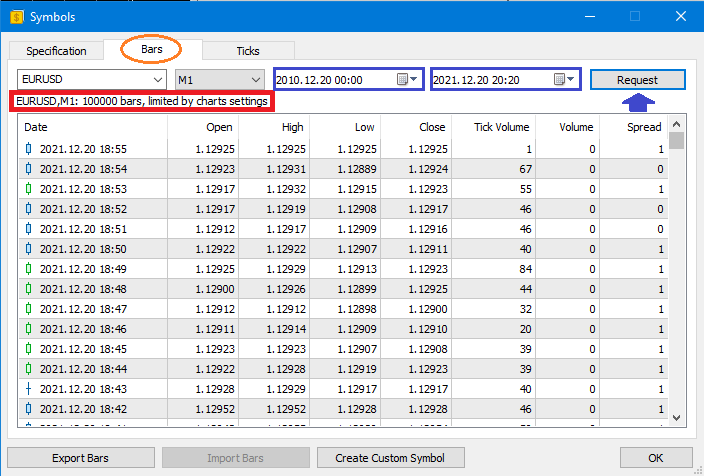
Bars on most of the symbols are usually available down to 2000 or even earlier, depending on the testing timeframe. In the image above, the message shows that 100,000 bars have been downloaded according to the limit of the internal terminal storage. The message will be different in other cases. The below form shows the terminal storage settings:
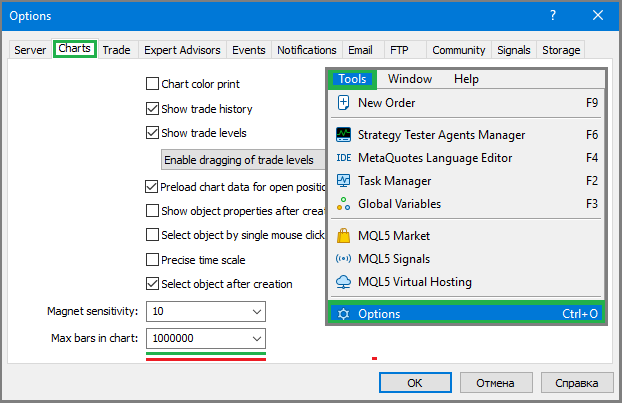
Here is the size of the quotes storage is configured. If its size is not enough for testing, increase it and restart the terminal. The available desired history will be downloaded with the next request. An important feature is that the number of bars in the history is equal to the number of bars on the chart which is “Maxbarsinchart”.
It is similar in MetaTrader 4 - use the main menu to go to “Tools -> History Server”.

A similar window will open:
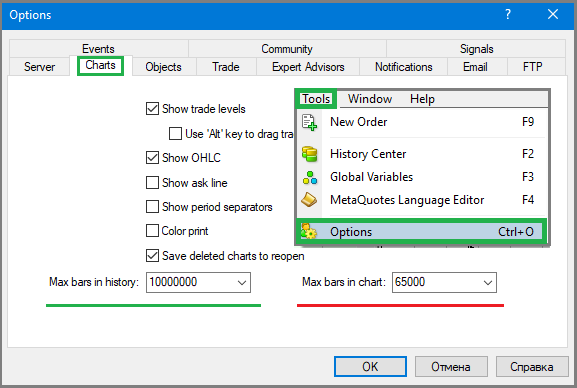
The common variable in MetaTrader 5 is divided here into two:
- Max barsinhistory — the number of bars that can be in history
- Max barsinchart — the number of bars that can be on the chart
The storage is limited by the first variable, while the second one limits the amount of data displayed in the archive as well as the number of bars shown on any chart in the terminal. Maybe, in the earlier terminal version this was needed to save memory. Now, let's view how this archive looks like in MetaTrader 4:
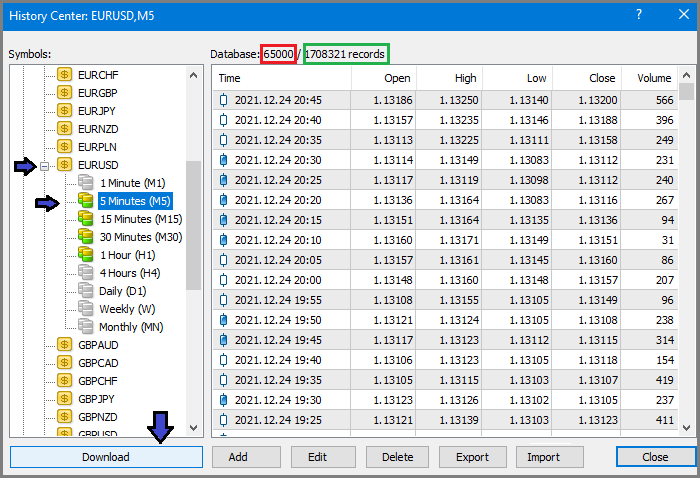
To download history, select the desired symbol and click “Download”. The only difference from MetaTrader 5 is that it is not possible to request only part of the history - it is downloaded in full for all the timeframes, in accordance with the limits in settings. You already know how to set or remove these limitations.
Before testing, you should prepare history — this is especially important for MetaTrader 4. In this terminal, the required history is downloaded manually, while MetaTrader 5 features automatic data loading. If you start a backtest without pre-downloading history, the terminal will download the required data.
The next step after preparing history is to determine from which point the backtests should be performed and which gradation to use. I would recommend using the last year in history for the first test, if you start with from the current date, or the whole previous year and the current year. Based on such testing, you can make the first conclusions about the tester performance. If the EA does not show goof performance in this interval, we can instantly switch to analyzing the next one.
If the performance is acceptable, test the EA using the entire available history, setting a larger deposit in the strategy tester to ensure that the EA can pass through this backtest. If possible, test using real ticks. For a correct evaluation, it is better to disable all money management mechanisms if the EA allows. Strictly speaking, Expert Advisors which do not offer such opportunity should be carefully examined, because you lose one of the most important metrics of a trading system — the original expected payoff of a strategy in points. This parameter plays a key role in evaluating a trading system, and the importance of it cannot be overestimated.
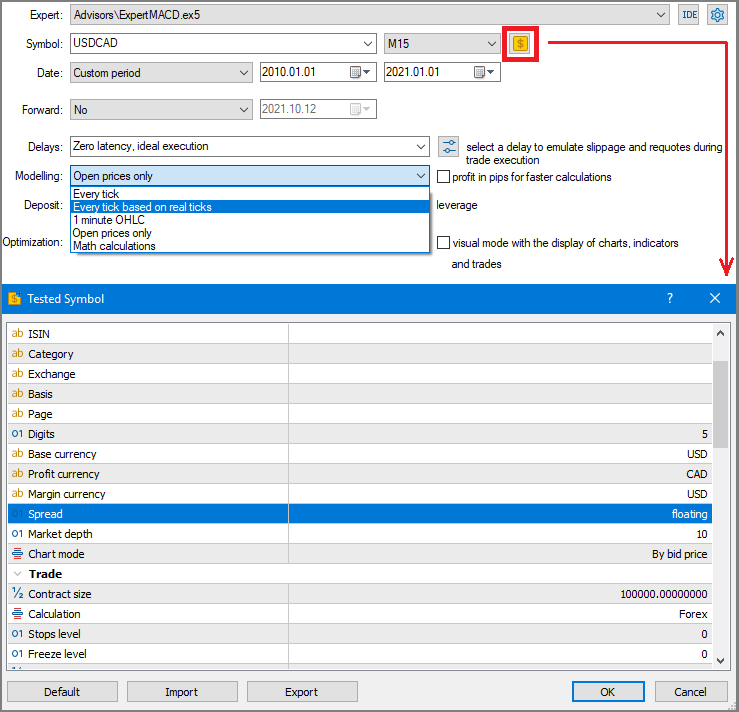
Before testing, it is important to understand the difference in MetaTrader 4 and MetaTrader 5 testers. In a newer terminal version, spread has a lower limit: if you specify spread below this limit, the testing will still be performed with that minimum limit. If you set spread higher than this value, testing will use exactly the specified value. This mechanism protects the buyer. It does not allow setting an unreal low spread in testing, while even one point can cost you money. This minimum value is linked to the average spread value from the price history of the symbol on which you are testing the EA, though this value is not shown in the symbol specification. Do not forget about this feature. When testing other's trading systems, it is better to use the current spread in this case the terminal will use the value saved in history for each bar. If you test using every tick, the terminal knows about the relevant spread value at every tick and testing of tick-based Expert Advisors will be very close to real conditions.
Testing in MetaTrader 4 offers simpler spread settings. Spread can be set starting with 1 and to any desired value. The tester will use exactly the specified value. The spread will be fixed throughout the entire testing period, which is not very good, but you can check out the current spread, add commission, swap, possible slippages and probably some extra value to make sure the system will survive widened spread, which is an important aspect in testing.
In MetaTrader 5, spread is set as follows:
In MetaTrader 4, it is easier:

Although setting in MetaTrader 4 is easier, testing in this version should be less preferable. Almost all EAs offered in the Market are implemented in two versions, so it is not a problem to test the MetaTrader 5 version. The knowledge of testing specifics will be very helpful.
Composite metrics
If the test results are positive, pay attention to the following two custom metrics. These variables incorporate the advantages of a number of metrics, such as maximum drawdown, relative drawdown and Sharpe ratio, both by balance and by equity. The metric is easy to calculate.
- Alpha = TotalProfit / MaximumEquityDrawdown
- Betta = TotalProfit / MaximumBalanceDrawdown
- MaximumEquityDrawdown – maximum equity drawdown
- MaximumBalanceDrawdown – maximum balance drawdown
- TotalProfit = (EndBalance - StartBalance) – total profit
- EndBalance - account balance at the end of the testing interval
- StartBalance - initial balance with which testing started
To calculate the final profit in this formula, the starting balance is deducted from the initial backtest balance. Maximum drawdown, both in equity and in balance, is available in any backtest in MetaTrader 4 and MetaTrader 5. After the expected payoff in points, this variable is as important, as the profit factors, which is also provided in strategy tester reports. When I describe these things, I assume that readers have the minimum required knowledge.
Another important metric is the number of trades. The more trades, the better. This number should be within reasonable limits, i.e., it should not be too large or too small. I will show the operational ranges of these values below. Also, the trading graph itself should look good: the more it looks like a straight line, the better.
Evaluation range values are as follows:
- MathWaitingPoints >= 3*MiddleSpread (Expected Payoff in points should significantly exceed the symbol spread)
- ProfitFactor >= 1.1 … 1.2 (the strategy should have a good predictive ability)
- Alpha >= 5 … 10 (good alpha indicates low risks and confirms good predictive ability)
- Betta>= 5 … 10 (good beta indicates high significance of this sample in terms of statistics and stable operation)
- TradesPerYear >= 20 … 30 (there will be few high-quality entry points for one trading instrument, but there are a lot of instruments)
- MiddleSpread – average symbol spread
- MathWaitingPoints – expected payoff in points
- ProfitFactor – profitability
- TradesPerYear – number of trades per year
These variables are very flexible and can be adjusted towards better results. According to my experience, such metrics often correspond to profit making strategies which you can find in the market. Of course, there can be exclusions, but they will not be frequent. As for other characteristics, they are auxiliary and you do not necessarily need to know them, but it is always better to understand their meaning.
Be careful
If you see a system with excessively high trading results and annual profit percent, you should check such systems more carefully as they can be deceiving. Based on the annual profit results stated in the EA description you can make conclusions about future risks and exclude the vast majority of trading systems at the description reading stage. The following range seems to cover secure annual profitability:
- 10 – 200 %
However, I think that 200% is too risky. 100–150% per year is good result. Of course, there are systems which can generates up to 1000% per year. But I doubt that such systems can be found in the Market, as the author is unlikely to share such an algorithm with others.
Expert Advisors with tricky money management systems, such as grid, martingale, pyramiding or averaging, often have results overoptimized on the trading history. These tricks can generate profit for quite a long period in the forward period before losing your deposit. But it is possible to detect such pseudo grails — all you need to do is check the real account monitoring.
Live account monitoring
If the monitoring is available, you can often see what's hidden. The wise analysis of trading systems can save you time. Below are two examples: a risky signal and a safe one. Let's start with the bad one:
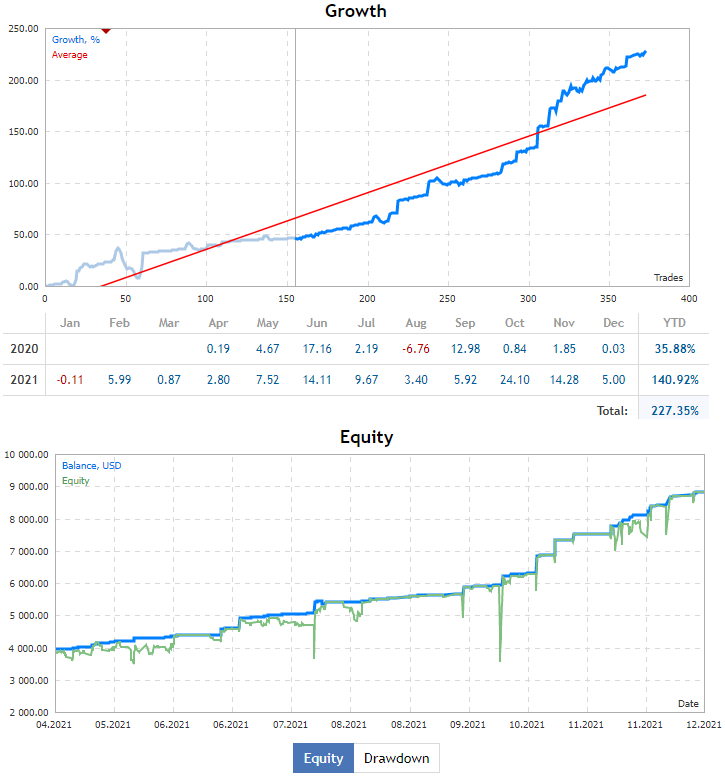
As you can see, it has a very beautiful profit line. But if you pay attention to the below figure, you will see green downward spikes. This is very queer. The spikes indicate that the important above-mentioned alpha custom metric is very low. You do not even need to know the figures, as even one of such spikes can fully destroy your deposit on the very first day. This indicates the overuse of money management or the long loss keeping time. The result can be bad: critical equity drawdown.
Now let's have a look at another signal, which is totally safe:
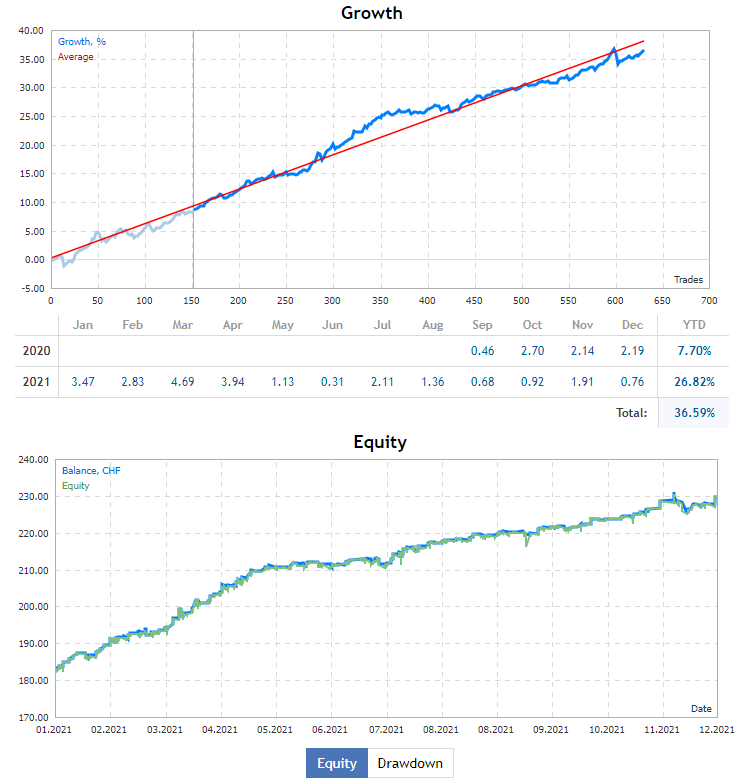
The balance line is not so beautiful and straight, but still it is good enough. This indicates that the signal author does not use tricky money management techniques to create the illusion of profit. In this signal, both alpha and beta demonstrate good results. The green and the blue lines are almost synchronous, and they stably move upwards. The annual profit percent is quite low, but the author increase the risk to generate 100-150% annual profit with a drawdown of no more than 50% of deposit. The signal I have shown is that of a real product featured in the Market. I spent only twenty minutes to find this signal. Inside the signal, I saw that this was a product monitoring. This is how we can use a reverse algorithm to save time and to avoid most of fakes. Of course, such an Expert Advisor can be quite expensive, but the price can eventually pay off.
Some tricks
It is also possible to find free signals and Expert Advisors with acceptable characteristics. The market features so many products from which you can choose. For example, you can take a free signal and a copier RA if there is no EA for that signal, and copy the trades for free! Thus, you can generate profits without paying anything for the product.
I would also like to mention optimization: should we optimize the EA we use? Many authors write that you should optimize an EA on a certain time interval. That might be true in rare cases. But based on my experience in developing automated trading systems, I can say that optimization never leads to good. Optimization should be performed very carefully, and you should always understand what you are doing, otherwise you can overoptimize the system to fit the historical results. It is true! A simple deep optimization can result in overoptimization and overfitting, even if you do not add specific time limitations. And the result will become part of your .set file. The more free variables an EA has, the greater it is overoptimized! Therefore, here is another simple yet important criterion for evaluating the EA safety: the number of input parameters The lower the number of inputs, the easier it is to use the EA and the more difficult it is to overfit the EA.
Also, it is not always possible to understand the EA operation logic. I think, in this case backtests and real account monitoring can provide the required information. You want to earn but not to copy an EA, which however is also possible, if you have the relevant experience and knowledge. Your time is limited, and when it comes to generating profit, there is not much time to analyze every detail of an EA or to scrutinize its operating principles. Many systems are based on very complex algorithms, and even their authors may fail to remember all the details.
Portfolio diversification to reduce risks and to increase profits
Now. let's consider how you can lower risks and increase profits from the found solutions. A solution here means an Expert Advisor, wither free or paid. As I mentioned above, free EAs can also be efficient. A popular notion in investing is diversification. This notion means a rational distribution of funds among assets to reduce risks and increase profits. How is it achieved? All is quite simple. It means, a good idea is to take a lot of different Expert Advisors with different characteristics and to run them simultaneously with the following lots:
- LotPerDepositDivesrsified[i] = LotPerDeposit[i] / N
- N – the number of found Expert Advisors
- i = 1 … N – indices of optimal lots for each strategy determined based on your deposit
- LotPerDepositDivesrsified[i] – reduced lot to diversify the i-th strategy
- LotPerDeposit[i] – optimal lot for the i-th strategy
It means that first you should find an optimal lot for each strategy and then divide it by the number of such strategies. After that you can independently start all these strategies on one account, setting different Magic numbers to them. In this case, your alpha and beta values will definitely grow: the more efficient EAs you run, the higher the values. It means that you can safely increase risks and grow your annual profit percentage just through the diversification of your portfolio. This is a real mathematical fact! I have created several Expert Advisors using machine learning to demonstrate this mathematical truth. These Expert Advisors are available in the article attachment. I trained the EAs to trade several major pairs using different chart timeframes for greater diversity. Also, you can check out individual backtests using the attachment. The EAs were trained on a period of 10 years from the current moment. I will show some average backtest of all the backtests to demonstrate average operation results of one of such EAs. Some of the EAs are better, others are worse, but the result on the average is as follows:
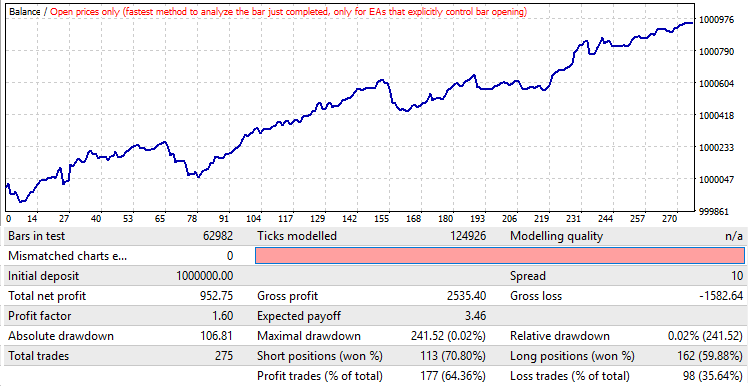
Because my EAs follow bars, these tests can run in the bar mode, instead of the every tick mode. I had to use MetaTrader 4 to combine all backtests, but MetaTrader 5 versions are also available in the attachment. As you can see, there is a general profit trend, however beta is not very good, as well as alpha needs to be improved. I trained 9 strategies in the same time interval.
Now let's use a special program to join backtests. You can find it on the Internet. The program is called “ReportManager”. There can be other similar solutions, but this one is quite enough for our purposes. You can use any preferred applications. Of course, MetaTrader 5 supports multi-currency testing, but such ability should be implemented at the code level, so the solution comes in handy. Here is the result of the joint backtest:
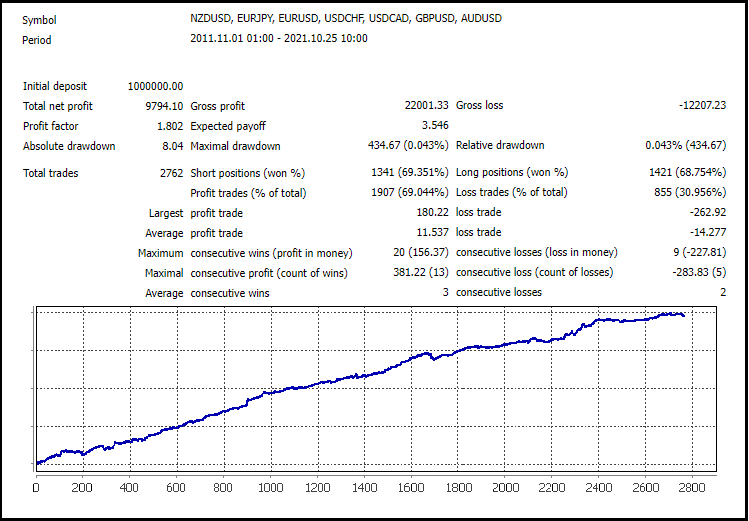
All waves have been smoothed-out due to counter-waves on other graphs. The same will happen during real trading. Stronger Expert Advisors will support weaker ones, and vice versa, when a drawdown occurs on a stronger one, the weaker one starts to act as an assistant. This keeps alpha and beta within a narrow range. Also, the number of trades has increased to acceptable levels. This is the result of joining only nine individual strategies. But there can be more of them" the more strategies, the smoother the graph, because it always works.
Even with a bunch of free EAs, it is possible to achieve such results, provided that you carefully analyze each individual EA before adding them to the Portfolio. If you want to achieve impressive results, do not be afraid of purchasing paid EAs, as many of them are really worth the money. You can also efficiently combine free and paid EAs to create successful portfolios.
Summary
I think the article provides simple and understandable recommendations on how you can make money in the Market using Expert Advisors. All specifics and actions can be brought down to very simple rules, using which anyone can improve trading results. These rules are as follows:
- The more tests, the better
- Reviews do not always reflect the performance (be especially careful with top sales)
- Tests based on real ticks are more preferable (if EA runs on ticks, try to perform stress tests with delays)
- The tests should have a fixed lot; money management should be disabled
- Real account monitoring should have good alpha and beta values and should match the backtests
- Bar-based EAs are faster to test, and they do not depend on ticks, so select such EAs if possible
- Perform tests in a maximum available sample (the greater the sample, the better)
- Profit factors should be within reasonable limits
- Make sure to check overfitting
- If you can test with visualization and if you understand the principles, study the operating principle - this will be a great advantage for you
- Apply diversification and grow your profits (the more EAs, the better)
There are a lot of other details, which you can find yourself, if you understand the basics.
Conclusion
In this article, I tried to highlight the main problems which users may have when purchasing or using Expert Advisors. I tried to provide the information in a comprehensible and simple way. Now, I hope you see that choosing a product from the marketplace is not that difficult. So, the key to finding a suitable product here is in the correct search.
Test the EAs attached below, try to combine different strategies using ReportManager, try to find some profitable EAs in the market and add them into the portfolio Test EAs in MetaTrader 4 and in MetaTrader 5 and see the difference. Soon you will be able to check forward periods. The EAs are very simple and are perfect for learning.
Translated from Russian by MetaQuotes Ltd.
Original article: https://www.mql5.com/ru/articles/10212
Warning: All rights to these materials are reserved by MetaQuotes Ltd. Copying or reprinting of these materials in whole or in part is prohibited.
This article was written by a user of the site and reflects their personal views. MetaQuotes Ltd is not responsible for the accuracy of the information presented, nor for any consequences resulting from the use of the solutions, strategies or recommendations described.
 Learn how to design a trading system by RSI
 Data Science and Machine Learning (Part 01): Linear Regression
 Learn how to design a trading system by Envelopes
- Free trading apps
- Over 8,000 signals for copying
- Economic news for exploring financial markets
You agree to website policy and terms of use
It's high time to stop providing advisors for tester-only testing.
For the tester, you can stitch trades into the bot so that there are much less unprofitable ones and show how good it is....
It is better to provide Expert Advisors, at least for a demo account with a time limit, for example 1-2 months.
Here is a screenshot from the tester, where you can see how the bot trades before the date of publication in the Market and how it trades after this date:
Who needs, I can provide the investor's password to the account on which such a "Miracle Bot" is trading.... There is just a slow drain going on....
Many sellers will now start shouting that if you provide it for demo account, you will be able to copy trades from demo account to your real account....
Yes, I agree, this option is possible, but also in this case, if your bot is so profitable, what are you afraid of?
A person will put on a demo account, will copy trades to his real account, will earn and in 99% of cases (tested), will want to buy your bot, if it is really so good!
It is not difficult at all to specify in the Expert Advisor restrictions only for a demo account and to set the date of termination of its work (this I already refer to MQL).
Especially lately there have appeared EAs at a VERY expensive (and even rapidly increasing) price with fashionable descriptions in the style that it is based on Artificial Intelligence or made using ChatGPT.
Don't fall for this scam!!! If the bot is on AI, it will trade only in the tester and only on the trained period. In real trading it will at best trade 50%/50%, and in the worst case it will be a slow drain....
So if the seller does not provide a version for demo account - DO NOT BUY FROM THAT SELLER!!!!
Who has nothing to hide - he will give a version for demo account with a time limit and will be able to attract a potential buyer....
You simply do not have the necessary skills and criteria for evaluation, no proper methodology of testing, selection, or you are just too lazy to look and do not believe that something can be found. Everything you have written is absolutely unnecessary (not necessary). The existing MQL5 functionality is more than enough, especially since there are a lot of goods on the site. If a person needs something, he will find a way to find it. I can do it. About the negative aspects, yes, they are there and everything is true, your knowledge and experience decide here, you will find what you need if you want.
A. I would like to draw your attention to the fact that the drawdown on funds for mql5.com signals is displayed only from the date of opening the signal, not from the date of the beginning of trading
And if in the above example it seems to be ok as the whole 2021 signal hangs and there is no data about the drawdown only for the part of 2020, then mostly in the market I observe the situation when the signal shows that trading is going on for 50-100-150 weeks, but the signal itself was loaded a couple of weeks ago and actually Alpha is excellent and the chart is also excellent, although it is not true.
B. do you have any articles on points 17-22 mentioned but not disclosed in this article:
There are parts scattered in different articles. It is just knowledge that is complex, which is hard to sew into one article. Only pieces can be placed somewhere... Where it's appropriate. You can ask questions in PM if you have them.
1000% per year ? lol this is really stupid
yeah let's start with $1K and see how quickly we become the richest man in the universe :
initial balance : $1,000
1st year : $11,000
2nd year : 121,000
3rd year : 1,331,000
4th year : 14,641,000
5th year : 161,051,000
6th year : 1,771,561,000
7th year : 19,487,171,000
8th year : 214,358,881,000
9th year : 2,357,947,691,000
10th year : 25,937,424,601,000
congratulation, within only 10 years you became the richest person in the universe, starting from $1000 !!! looool you guys are funny
also why didn't you talk about what I brought to you a few days ago ? : the fact that a lot of EAs split martingales into several single lots so that it doesn't look that it's a martingale ?
------- is doing it, (amongst many ohers) and I don't see you guys doing anything about it. Semms like you like the money more than protecting your users
Jeff
1000 per cent a year? lol, that's really stupid.
Yes, let's start with $1,000 and see how quickly we will become the richest man in the universe :
starting balance : 1.000 $
1st year : $11,000
2nd year : 121,000
3rd year : 1.331.000
4th year : 14.641.000
5th year : 161.051.000
6th year : 1.771.561.000
7th year : 19.487.171.000
8th year : 214.358.881.000
9th year : 2.357.947.691.000
10th year : 25.937.424.601.000
Congratulations, in just 10 years you have become the richest person in the universe starting from 1000 dollars !!! looool you are so funny
Also why didn't you talk about what I brought to you a few days ago : the fact that many EAs divide martingales into several single lots, so that it doesn't look like a martingale?
------- does this (among others) and I don't see you doing anything about it. You seem to like money more than protecting your users
Jeff