FX Sniper Orange indicator for MT5
- インディケータ
-
Renaud Herve Francois Candel
 ITC SOFTWARE is a technology company based in the United States since 2010.
🟠🔴 The company develops financial software and indicators for different trading platforms:
-Metatrader 4 and Metatrader 5
-TradingView
-NinjaTrader - バージョン: 1.30
- アップデート済み: 4 7月 2023
- アクティベーション: 5
FX Sniper Orange Indicator
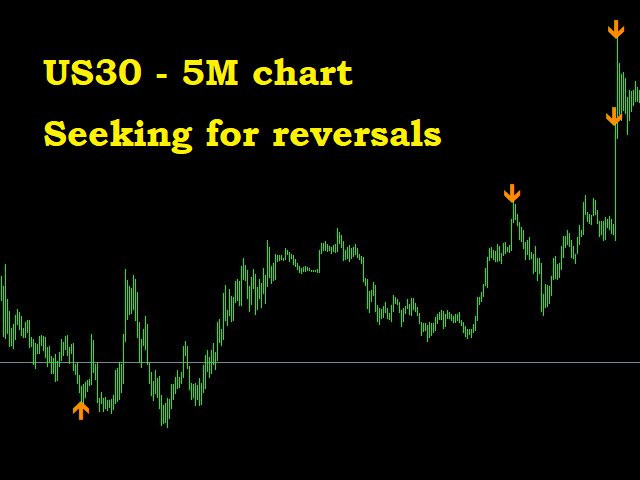
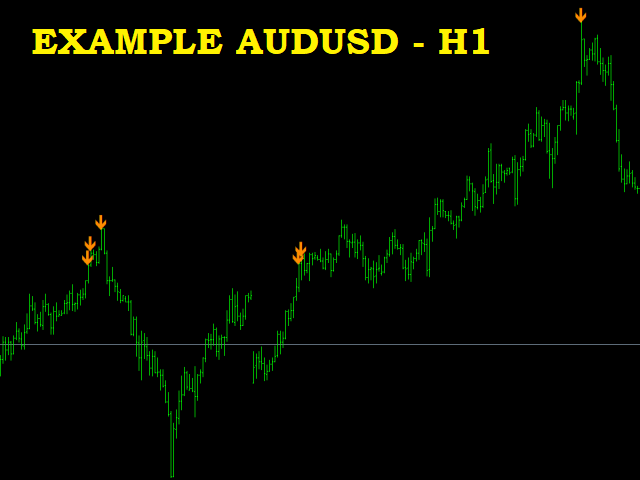
FX Sniper Orange is an exclusive indicator to spot situations where market has gone too far and market could reverse soon after.The indicator displays arrows in your chart indicating probable future price action (see screenshot attached).
FX Sniper Orange never repaints. Once candle is closed signal is confirmed and arrow will never disappear.
Users of the indicator can setup alerts when new arrows are displayed in the chart.
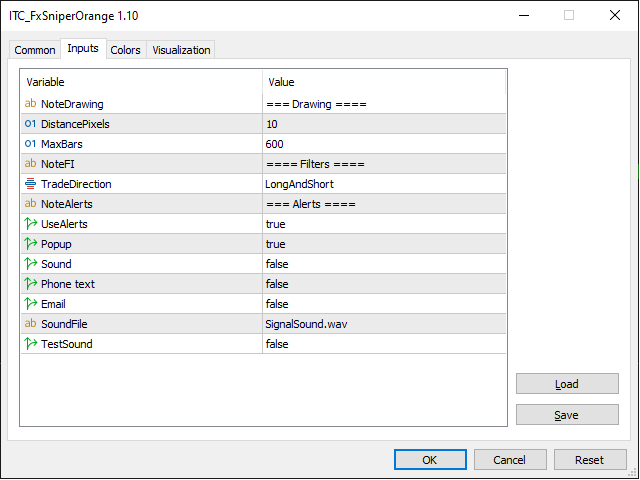
Inputs of the indicator are:
- Distance: distance in pixel relative to top or bottom of candle to display the arrow symbol
- MaxBars: number of bars back used to calculate the indicator
- TradeDirection (Long/Short/LongAndShort): filter signals for BUY and SELL
- UseAlerts (true/false): to enable alerts
- PopAlerts (true/false): to enable alerts of type Popup window
- EmailAlerts (true/false): to enable alerts of type Email
- PushAlerts (true/false): to enable alerts of type Push Notification
- SoundAlerts (true/false) to enable alerts of type Sound
- SoundFile: file to be used for sound alerts
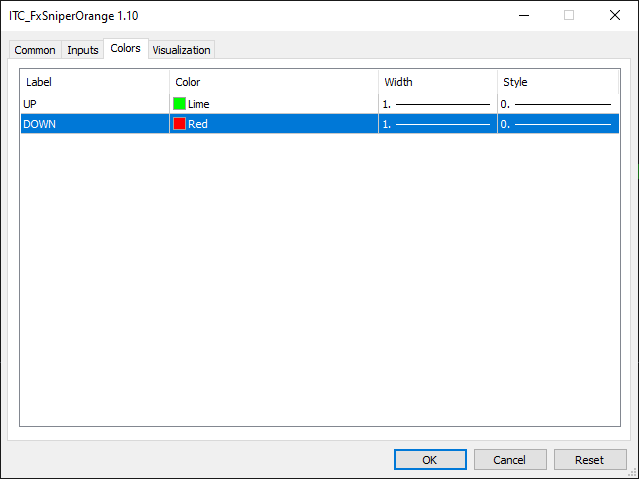
Size and color of the arrows can be setup in the Color tab of the indicator.
The indicator can be used with any time frame.
The indicator can be used to trade Options, Forex, Stocks, Indices, Futures, Commodities and Cryptos.
Other indicators for MT4:
We developed more than 60 indicators and utilities for Metatrader 4 and Metatrader 5.
Indicators for MT5:
All our indicator are developed both for MT4 and MT5.
List of all our indicators:
👉 You can get the complete list of our indicators visiting our profile page.