• 概要
  • レビュー
  • コメント

Goodx goodtrade smart fastcopy system

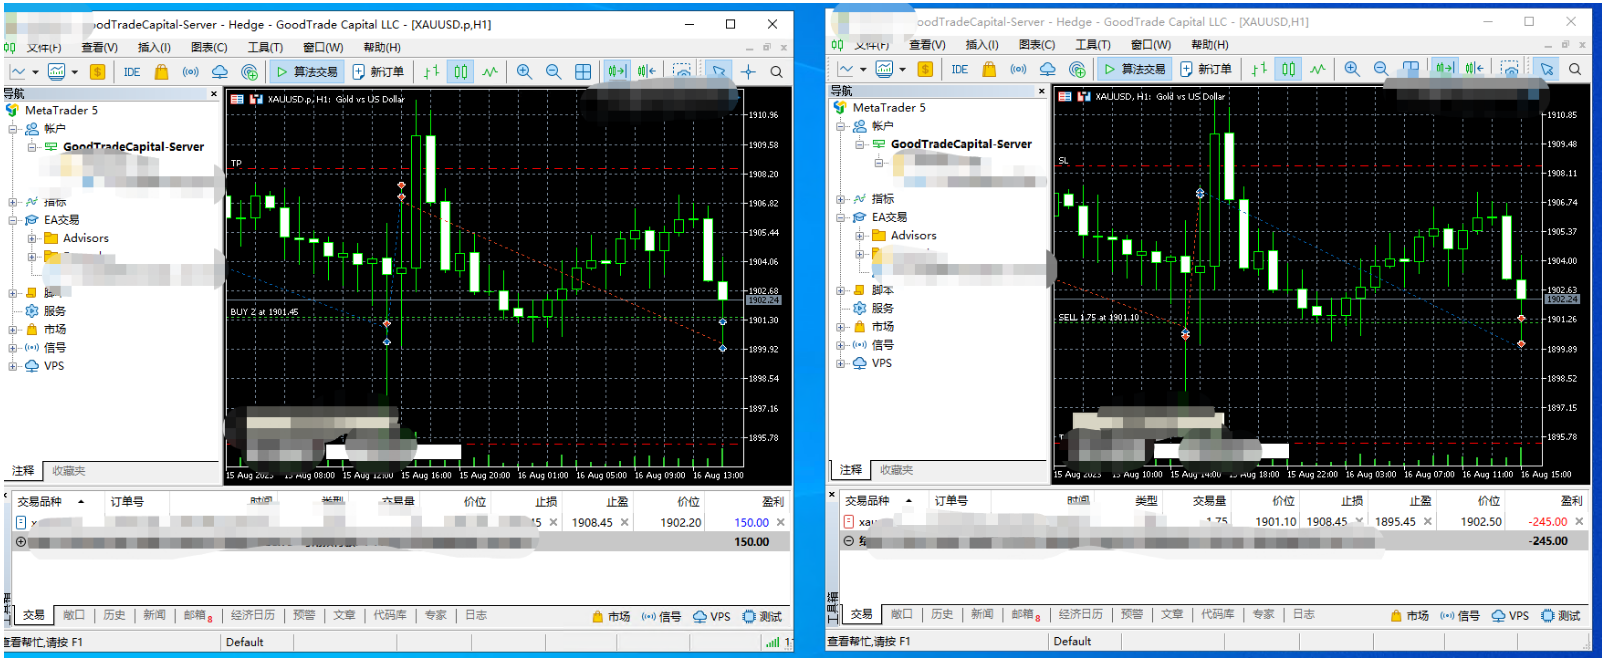
Based on the trading model/strategy/system of gold double-position hedging and arbitrage launched by Goodtrade Brokers, problems encountered in daily operations: 1. Account B immediately places an order immediately following account A. 2: After account A places an order, account B will automatically copy the stop loss and take profit. 3: Account A closes the position of Account B and closes the position at the same time. 4: When account B closes the position, account A also closes the position. 5: Refuse to place an order under unfavorable spread. By solving the above problems, problems such as staying up late, manual errors, long-term staring at the disk, nervousness, panic, worry, lack of sleep, irregular diet, and lack of energy have been changed. After solving these problems, the work efficiency and profit ratio have been effectively improved, from the original monthly profit rate of 10% to the best monthly profit rate of 45%. The original trader can only manage the operation start-up account. Through this EA, it can manage up to 16 groups of trading accounts. Maybe you can surpass our records and look forward to your experience exchange. This EA is divided into: GoodtradeGoodX Tradercropy A GoodtradeGoodX Tradercropy B is a combined EA, assuming that the amount you purchased GoodtradeGoodX Tradercropy A must be purchased at the same time as GoodtradeGoodX Tradercropy B, the combination of the two will achieve the best results. GoodtradeGoodX Tradercropy A: used on goodtrade/goodX APP: bound order account, usually 550XXXX, GoodtradeGoodX Tradercropy B: used in B account or 560XXXX, or sub-account Read the important thing three times: You must pay attention to the way of use, otherwise it will not be able to produce huge profit effects.

contact wechat :  zfflyer

おすすめのプロダクト
To download MT4 version please click here . - This is the exact conversion from TradingView: "Trend Direction Force Index - TDFI [wm]" By "causecelebre". - The screenshot shows similar results from tradingview and Metatrader when tested on ICMarkets on both platforms. - This indicator uses multiple levels of averaging to detect trend strength. - You can optimize filter low and filter high levels to achieve best results. - You have access to buffers to use in EAs. - This is a light-load processin
Manyal trading system, CovEchoTrend Robot, focuses on reliability and flexibility. By employing statistical analysis methods to study the relationships between the base indicator and market patterns, the system enables a deeper understanding of market processes. Intelligent pattern analysis: The application of statistical data processing helps identify key trend reversal points more accurately, signaling significant market shifts. Informed decision-making is based on the intersection of indicato
SMC Venom Model BPR インジケーターは、スマート マネー (SMC) コンセプトで取引するトレーダー向けのプロフェッショナル ツールです。価格チャート上の 2 つの主要なパターンを自動的に識別します。 FVG   (フェアバリューギャップ) は、3 本のローソク足の組み合わせで、最初のローソク足と 3 番目のローソク足の間にギャップがあります。ボリュームサポートのないレベル間のゾーンを形成し、価格修正につながることがよくあります。 BPR   (バランス価格範囲) は、2 つの FVG パターンの組み合わせで、「ブリッジ」を形成します。これは、価格がボリュームアクティビティの少ない動きで動くときに、ブレイクアウトしてレベルに戻るゾーンで、ローソク足の間にギャップを作成します。 これらのパターンは、大規模な市場プレーヤーと一般参加者の相互作用が発生するチャート上のボリュームと価格動向の分析に基づいて、トレーダーが主要なサポート/レジスタンス レベル、ブレイクアウト ゾーン、エントリ ポイントを識別するのに役立ちます。 インジケーターは、長方形と矢印の形でパターンを視覚
プレミアムレベルは、正しい予測の精度が80%を超える独自の指標です。 この指標は、最高のトレーディングスペシャリストによって2か月以上テストされています。 あなたが他のどこにも見つけられない作者の指標! スクリーンショットから、このツールの正確さを自分で確認できます。 1は、1キャンドルの有効期限を持つバイナリーオプションの取引に最適です。 2はすべての通貨ペア、株式、商品、暗号通貨で機能します 手順: 赤い矢印が表示されたらすぐにダウントレードを開き、青い矢印が表示されたら閉じます。青い矢印の後に開くこともできます。 試してテストしてください!推奨設定はデフォルトです! 日足チャートで最高の精度を示します! インディケータは、2600 Pipsの収益性に対して、約10Pipsという非常に小さなマージンを使用します。
Expert. Automatic and manual trading. Ready-made trading system based on Elliott waves and Fibonacci retracement levels . It is simple and affordable. Display of the marking of Elliott waves (main or alternative option) on the chart. Construction of horizontal levels, support and resistance lines, a channel. Superposition of Fibonacci levels on waves 1, 3, 5, A Alert system (on-screen, E-Mail, Push notifications).    visual panel for opening orders in manual trading. visual panel for setting up
https://youtu.be/JJanqcNzLGM ,  https://youtu.be/l70MIHaQQa4 ,  https://youtu.be/pg0oiT5_8y0   Automated Supply and Demand Trading Edge MT5. These videos demonstrate how we apply the supply and demand system to our latest trading review and market analysis Enhance your Trading Strategy with the Supply and Demand Trading Edge MT5. Gain a competitive market advantage with the Supply and Demand Trading Edge MT5 indicator, a powerful tool that combines MACD signals with supply and demand zones. By
The S&P 500 Scalper Advisor is an innovative tool designed for traders who want to successfully trade the S&P 500 Index. The index is one of the most widely used and prestigious indicators of the American stock market, comprising the 500 largest companies in the United States. Peculiarities: Automated trading solutions:   The advisor is based on advanced algorithms and technical analysis to automatically adapt the strategy to changing market conditions. Versatile approach:   The advisor combine
Entry: The  EA is an expert advisor for scalping and averaging in on the M5 chart of XAUUSD. This powerful tool continuously scans the market, identifying high-quality trading setups based on specific trading hours / trading sessions. The entry model is a collaboration of both candlestick patterns and indicators. Management: Through extensive testing and a 5 year Dukascopy data optimization, the EA has shown an impressive strike rate of 100%. In the rare event that a trade goes against us, the
PipFinite Exit EDGE MT5
Karlo Wilson Vendiola
4.86 (29)
Did You Have A Profitable Trade But Suddenly Reversed? In a solid strategy, exiting a trade is equally important as entering. Exit EDGE helps maximize your current trade profit and avoid turning winning trades to losers. Never Miss An Exit Signal Again Monitor all pairs and timeframes in just 1 chart www.mql5.com/en/blogs/post/726558 How To Trade You can close your open trades as soon as you receive a signal Close your Buy orders if you receive an Exit Buy Signal. Close your Sell orders if
MT4版  |  FAQ Owl Smart Levels Indicator は、 Bill Williams の高度なフラクタル、市場の正しい波構造を構築する Valable ZigZag、エントリの正確なレベルをマークする Fibonacci レベルなどの一般的な市場分析ツールを含む 1 つのインジケーター内の完全な取引システムです。 利益を得るために市場と場所に。 戦略の詳細な説明 インジケータを操作するための指示 顧問-取引助手 プライベートユーザーチャット ->購入後に私に書いて、私はプライベートチャットにあなたを追加し、あなたはそこにすべてのボーナスをダウンロードすることができます 力はシンプルさにあります! Owl Smart Levels 取引システムは非常に使いやすいので、専門家にも、市場を勉強し始めて自分で取引戦略を選択し始めたばかりの人にも適しています。 戦略と指標に秘密の数式や計算方法が隠されているわけではなく、すべての戦略指標は公開されています。 Owl Smart Levels を使用すると、取引を開始するためのシグナルをすばやく確認し、注文を出すための
This indicator uses a mathematical calculation algorithm . This algorithm calculates the remainder between the updated model and the actual values and produces the possible progress of the graph on the graph. It is not a super prophet in trading, but it is very good for the trader when entering the market and to analyze it before entering. Applicable for all currencies. Данный индикатор использует алгоритм математических вычислений . Данный алгоритм вычисляет остаток между обновленной моделью и
Introducing to your attention an innovative expert advisor created specifically for the most juicy and volatility    currency     basket: GBPUSD, XAUUSD and EURJPY. This system is designed using the main features of this market's movement, making it an ideal choice for dynamic trading on high-trending and medium-volatile pairs.   The signals are focused on minimizing trading risks, aiming to reduce losses to a minimum. Main features ESignals is designed to show open and close arrows at the beg
稼ぎと研究のためのツール。 トレーディングシグナルと戦略の中核は、価格予測パターンを形成するための著者のアルゴリズムに基づいています。どんな楽器にも使えます! MA「九尾の狐」に基づく制御システムが追加され、市場、機器、および作業期間に合わせて信号を可能な限り正確に更新および調整します。 対象:すべての市場のすべての商品(例外があります)。 対象者:ヘッジファンド、ファンドおよび資産運用会社、投資運用会社、投機家、投資家および利害関係者。 .................................................................................................................................................................................
Let us introduce the Heikin Ashi RSI Oscillator! This indicator combines the concepts of Heikin Ashi candles with the RSI (Relative Strength Index) to produce an oscillator-like format that can be used to filter out some of the noise associated with standard RSI readings. This provides traders with a smoother representation of market conditions. Here are some articles to read more about the RSI and Heikin Ashi candles: https://www.investopedia.com/terms/r/rsi.asp https://www.investopedia.com/ter
Note : i only sell this EA on MQL5, any other sellers is fake. Orbit Rage Final, a cutting-edge trading strategy meticulously designed around the bull/bear candle approach and divergence analysis. This powerful tool is engineered to empower you to shape the life you desire. To embark on this transformative journey, simply download and seamlessly integrate it into your MetaTrader 4 platform by placing it in the experts advisors folder. Orbit Rage Final revolutionizes trading by offering a risk-f
Was: $249  Now: $149   Market Profile defines a number of day types that can help the trader to determine market behaviour. A key feature is the Value Area, representing the range of price action where 70% of trading took place. Understanding the Value Area can give traders valuable insight into market direction and establish the higher odds trade. It is an excellent addition to any system you may be using. Inspired by Jim Dalton’s book “Mind Over Markets”, this indicator is designed to suit the
Gyroscope        professional forex expert   (for EURUSD, GBPUSD, USDJPY, AUDUSD, USDCHF, EURGBP, EURJPY, NZDUSD, USDCAD, EURCHF, AUDJPY, CADJPY pairs)   alyzing the market using the Elliot Wave Index. Elliott wave theory is the interpretation of processes in financial markets through a system of visual models (waves) on price charts. The author of the theory, Ralph Elliott, identified eight variants of alternating waves (of which five are in the trend and three are against the trend). The mov
インディケータは現在のクオートを作成し、これを過去のものと比較して、これに基づいて価格変動予測を行います。インジケータには、目的の日付にすばやく移動するためのテキスト フィールドがあります。 オプション: シンボル - インジケーターが表示するシンボルの選択; SymbolPeriod - 指標がデータを取る期間の選択; IndicatorColor - インジケータの色; HorisontalShift - 指定されたバー数だけインディケータによって描画されたクオートのシフト; Inverse - true は引用符を逆にします。false - 元のビュー。 ChartVerticalShiftStep - チャートを垂直方向にシフトします (キーボードの上下矢印)。 次は日付を入力できるテキストフィールドの設定で、「Enter」を押すとすぐにジャンプできます。
トレードパスインジケーター - アルゴリズム取引シグナルのマッピング その   貿易経路   このインジケーターは、アルゴリズム戦略の主要な判断ポイントをチャート上で視覚化することで、その取引ロジックを明らかにします。アルゴリズムのエントリー、損切りレベル、そして潜在的な反転ゾーンをトリガーするテクニカルシグナルを表示することで、手動トレーダーに戦略的優位性をもたらします。 コアコンポーネントの説明: シグナルライン(アクティブ解析) 現在のアルゴリズム戦略がシグナルを生成する正確なテクニカル分析レベルを表示します 現時点でアルゴリズムが従っている支配的な技術的バイアスを表す トリガー価格(黄色の線) 臨界価格レベル: アクティブアルゴリズム戦略はポジション(ブレイクアウト注文)を開始する 同時に、反対のアルゴリズム戦略のストップロスレベルとして機能する これにより、競合するアルゴリズムが相互作用する流動性ゾーンが生まれます ストップロスレベル(動的) 以下を表します: 現在のアルゴリズム戦略のストップロスポイント 価格が反転した場合、反対のアルゴリズムの潜在的なトリガーポイント 市場
Noize Absorption Index - is the manual trading system that measures the difference of pressure between bears forces and bulls forces. Green line - is a noize free index that showing curent situation. Zero value of index shows totally choppy/flat market.Values above zero level shows how powerfull bullish wave is and values below zero measures bearish forces.Up arrow appears on bearish market when it's ready to reverse, dn arrow appears on weak bullish market, as a result of reverse expectation.
これはほぼ間違いなく、MetaTraderプラットフォームで見つけることができる最も完全な調和価格形成自動認識インジケーターです。 19種類のパターンを検出し、フィボナッチプロジェクションをあなたと同じように真剣に受け止め、潜在的逆転ゾーン(PRZ)を表示し、適切なストップロスとテイクプロフィットレベルを見つけます。 [ インストールガイド | 更新ガイド | トラブルシューティング | よくある質問 | すべての製品 ] 19の異なる調和価格形成を検出します プライマリ、派生および補完フィボナッチ投影(PRZ)をプロットします 過去の価格行動を評価し、過去のすべてのパターンを表示します この指標は、独自の品質とパフォーマンスを分析します 適切なストップロスとテイクプロフィットのレベルを表示します ブレイクアウトを使用して適切な取引を通知します すべてのパターン比をグラフにプロットします 電子メール/音声/視覚アラートを実装します スコット・M・カーニーの本に着想を得て、この指標は最も純粋で急を要するトレーダーのニーズを満たすように設計されています。ただし、トレードを容易にする
Индикатор "Benefit Predictor" Это высокоточный инструмент для прогнозирования разворота цены на любом финансовом инструменте и любом таймфрейме. Этот продукт появился благодаря годам опыта и исследований в области анализа цен и других временных рядов, используя продвинутые методы машинного обучения и математического анализа. Особенности продукта : Готовая торговая система, подходит как для ручной торговли, так и для использования в торговых роботах. Не перерисовывается после появления сигнала
Goldmost – Precision Trading for XAUUSD This EA implements a multi-timeframe breakout strategy for XAUUSD, identifying critical support/resistance levels to execute trades with dynamic SL/TP adjustments, and intelligent exit protocols for optimized risk management. The parameters are updated regularly to adapt to evolving market conditions. This ensures the model continuously adjusts to shifting sentiment, investor behavior, and emerging trends - keeping your strategy aligned with current marke
Introducing "X Marks the Spot" – Your Ultimate MetaTrader 5 Indicator for Perfect Trades! Are you tired of the guesswork in trading? Ready to take your MetaTrader 5 experience to a whole new level? Look no further – "X Marks the Spot" is here to revolutionize your trading strategy! What is "X Marks the Spot"? "X Marks the Spot" is not just another indicator – it's your personal trading compass that works seamlessly on all timeframes . Whether you're a beginner or an experienced trader,
FVG EA Pro
Haidar, Lionel Haj Ali
4.55 (29)
FVG EA PRO   is a must-have smart money concept EA, highly customizable and using advanced techniques of FVG "Fair Value Gap" and market structure to capture high probability trades.  It is highly configurable,  you can build various strategies based on market structure and FVG as entry criteria. FVG EA PRO can be used to trade Kill Zones and Silver Bullet Windows. It is fully compatible with swing trade strategies. It contains all the functionalities  needed by any  successful traders to automa
PipFinite EA Trend PRO MT5
Karlo Wilson Vendiola
3.67 (9)
The Official Automated Version of the Powerful Indicator PipFinite Trend PRO EA Trend PRO trades the signal of PipFinite Trend PRO and manages the trade depending on the user's preference. The EA includes many customizable features that can further enhance the Trend PRO trading strategy. Features like Entry and Exit Filters, Higher Timeframe Filter, Stoploss, Takeprofit, Breakeven, Trailing Stop, News Filter and MORE! The Innovative Solution EA Trend PRO was created to make your trading more
Introduction to the Manual Backtesting Indicator on MQL5 The MetaTrader platform provides an excellent backtesting tool for evaluating Expert Advisors (EAs). However, when it comes to manually backtesting a strategy to assess its effectiveness, this tool has some limitations: You cannot manually draw zones or trend lines while in backtesting mode. You cannot switch timeframes to check time alignment. For example, if my strategy requires additional confirmation from a higher timeframe (HTF), this
Automatic Advisor for the   Bitcoin   instrument.   Timeframe H1. Terminal MT5 I created this Advisor specifically for a prop company. All the efforts of five years went into creating a safe product. The Advisor consists of 8 small Advisors and is a ready-made Portfolio. Attention: The Advisor uses two large trading strategies (!): Trend Trading; Trading by Seasonal Patterns (time cycles) The Advisor   DOES NOT use   toxic strategies: Strategy Availability                                      
Quantum Lion MT5   is a very profitable expert advisor for trading US30, BRENT OIL and EURSGD that uses a proprietary indicator "Quantum Lion" bult-in.  Please download and test it against any top ea from the mql5 Marketplace. I think you will find Quantum Lion to be more stable and have less drawdown than most other ea. This powerful Expert Advisor can make regular profit every week with low drawdown while you sleep. No martingale is use, just grid trades!  The starting lot size is 0.01 and it
Bober Real MT5
Arnold Bobrinskii
4.76 (17)
Bober Real MT5 is a fully automatic Forex trading Expert Advisor. This robot was made in 2014 year and did a lot of profitbale trades during this period. So far over 7000% growth on my personal account. There was many updates but 2019 update is the best one. The robot can run on any instrument, but the results are better with EURGBP, GBPUSD, on the M5 timeframe. Robot doesn't show good results in tester or live account if you run incorrect sets. Set files for Live accounts availible only for cu
このプロダクトを購入した人は以下も購入しています
IVISTscalp5
Vadym Zhukovskyi
5 (6)
iVISTscalp5インジケーターをご紹介します。このインジケーターは、トレーディングにおいて独自でありながら効果的です。時間データに基づくこのインジケーターは、多年にわたる経験と金融市場の深い分析の結果です。iVISTscalp5インジケーターは、手動トレーディングにとって優れたツールです。便利さ、簡単さ、可視化 - すべての複雑さが内部に隠されています。私たちは、iVISTscalp5インジケーターの設定と使用を最大限に簡素化しました。このインジケーターは、MT5ターミナルにあるすべての金融商品に適しています。 稼働時間は、4時から20時(UTC+3)です。 iVISTscalp5インジケーターメニュー(スクリーンショット1を参照): History - 引用を計算する週数 dT_min - 時間間隔の選択(分) TFline - 水平ボリュームの作成(時間枠) BARSline - 水平ボリュームの作成(バー数) TFtrend1 - デイリーチャンネルの作成(時間枠) BARStrend1 - デイリーチャンネルの作成(バー数) TFtrend2 - 週次チャンネルの作成(時
CBT Quantum Maverick 高効率バイナリーオプション取引システム CBT Quantum Maverickは、高いパフォーマンスとシンプルさを追求するトレーダー向けに設計されたバイナリーオプション取引システムです。カスタマイズの必要がなく、最適化された状態で使用を開始できます。シグナルに従うだけで、少しの練習でマスターできます。 主な特徴: シグナルの精度: 現在のローソク足を基に次のローソク足の取引シグナルを生成し、頻繁な再描画がありません。 多様な市場対応: バイナリーオプション取引に特化し、さまざまなブローカーや資産クラスに対応しています。 対応可能: Deriv Synthetic Charts :すべてのタイムフレームで使用可能。 OTCチャート :Quotex、PocketOption、Binomo、Stockity、IQOption、Exnova、OlympTrade、Deriv、Binolla、Homebrokerなどのブローカーに対応。MT5へのインポートは最初の1週間無料、その後は有料サービス。 FX、仮想通貨、商品市場 :幅広い資産利用が可能
Hello I Want to introduce The Forex Buy Sell Arrow Premium MT5 i recently release this premium indicator! its 1000% Non Repaint Indicator, It Work Perfectly Well,, i tested it day by day, Just mind blowing Result,  Including Powerful trend Algorithm! How It Work? well, it work market trend formula, when trend Bullish Or when trend Bearish,  Recommend Timeframe M30, H1 it work all timeframe, and all currency pair, 100% non repaint, How to take signal From Forex Buy Sell Arrow Premium Ind
AriMax   – AI-Powered Trading Robot AriMax is a cutting-edge AI-powered trading robot designed to help traders maximize profits while minimizing risk. Utilizing advanced machine learning algorithms and real-time market analysis, AriMax identifies high-probability trade opportunities with precision and speed. Key Features:     AI-Driven Market Analysis   – Analyzes market trends and patterns to make data-driven trading decisions.     Automated Execution   – Places trades seamlessly with optimiz
The Naveen Dynamic Square  MT5  is one of the best known  technical analysis tools  inspired  by WD Gann along with the Gann Fan and Gann Box. It is considered a cornerstone of his trading technique that is based on time and price symmetry. The Naveen Dynamic Square MT5   is a powerful tool in finance for determining support and resistance levels based on a stock's extreme price points. It works by extrapolating probable price levels from a central value, typically an all-time or cyclical high o
A scalping indicator based on mathematical patterns, which on average gives signals with relatively small SL, and also occasionally helps to catch big moves in the markets (more information in the video) This indicator has three main types of notifications: The first type warns of a possible/upcoming signal on the next bar The second type indicates the presence of a ready signal to enter the market/open a position The third type is for SL and TP levels - you will be notified every time price re
The Smooth Price technical indicator is used for plotting a smoothed line as close to the price of the financial instrument as possible, and serves to eliminate its noise components. The indicator is part of the Monarch trading system, but here it is presented as an independent technical analysis tool. The indicator is based on the cluster digital filter , which, unlike the ClusterSMA , is applied directly to the price time series. Smooth Price does not redraw (except the very last, zero bar) an
The Expert Advisor and the video are attached in the Discussion tab . The robot applies only one order and strictly follows the signals to evaluate the indicator efficiency. Pan PrizMA CD Phase is an option based on the Pan PrizMA indicator. Details (in Russian). Averaging by a quadric-quartic polynomial increases the smoothness of lines, adds momentum and rhythm. Extrapolation by the sinusoid function near a constant allows adjusting the delay or lead of signals. The value of the phase - wave s
Классификатор силы тренда. Показания на истории не меняет. Изменяется классификация только незакрытого бара. По идее подобен полной системе ASCTrend, сигнальный модуль которой, точнее его аппроксимация в несколько "урезанном" виде, есть в свободном доступе, а также в терминале как сигнальный индикатор SilverTrend . Точной копией системы ASCTrend не является. Работает на всех инструментах и всех временных диапазонах. Индикатор использует несколько некоррелируемых между собой алгоритмов для класси
Indicador en base a la pendiente de la linea de precio, dibuja una línea de color cuando sube a base de los precios que previamente has sido procesados o linealizados, y cuando baja la pendiente la linea linealizada toma otro color. En este caso se a considerado 6 lineas de diferentes procesos desde pendientes largas hacia las cortas, observándose que cuando coincidan las pendientes se produce un máximo o mínimo, lo que a simple vista nos permitirá hacer una COMPRA O VENTA.
Fibonacci Múltiple 12, utiliza la serie fibonacci plasmado en el indicador fibonacci, aumentadolo 12 veces según su secuencia. El indicador fibonacci normalmente muestra una vez, el presente indicador se mostrara 12 veces empezando el numero que le indique siguiendo la secuencia. Se puede utilizar para ver la tendencia en periodos cortos y largos, de minutos a meses, solo aumentado el numero MULTIPLICA.
Recommended TimeFrame >= H1. 100% Non Repainted at any moment.  Use it carefully, only with Trend Direction. Trading Usage: 2 Variants: as Range System or as BreakOut System (Both Only With Trend Direction)::: (Always use StopLoss for minimise Risk); [1] as Range System: (Recommended) in UP TREND:  - BUY in Blue Line , then if price goes down by 50 points (on H1) open Second BUY.   Close in any Profit you wish: TrailingStop(45 points) or Close when Price touches upper Gold Line. in DOWN TREND
En base a cálculos matemáticos de determino una linea Horizontal que cruza a todas las señales de trading, mostrando los máximos y mínimos. La linea horizontal parte en dos las subidas y bajadas de las señales de trading, de tan manera que es fácil identificar los máximos y mínimos, y es inteligente por que es sensible a las subidas y bajadas, afín de no quedarse en un solo lado por siempre, trabaja excelentemente con otros indicadores suavizadores ya que les garantiza que en un intervalo de tie
this indicator is a Spike detector indicator, it is specially designed to trade Boom 1000, Boom 500, Crash 1000 and Crash 500 We recommend using it on Deriv Boom and Crash indices only Its setting is intuitive, familiar, easy to use it has notification functions; audible notifications and push notifications. this tool is simple to use, easy to handle This update is based on different strategies for spikes
Limitless MT5 is a universal indicator suitable for every beginner and experienced trader. works on all currency pairs, cryptocurrencies, raw stocks Limitless MT5 - already configured and does not require additional configuration And now the main thing Why Limitless MT5? 1 complete lack of redrawing 2 two years of testing by the best specialists in trading 3 the accuracy of correct signals exceeds 80% 4 performed well in trading during news releases Trading rules 1 buy signal - the ap
Indicador en MQL5, recibe la información del precio SUAVIZADO, lo procesa anulando los picos inteligentemente, y el resultado lo envía al desarrollo de la escalera que iniciara y subirá o bajara según el peldaño o INTERVALO ingresado Ingreso PERIODO = 50 (variar segun uso) Ingreso MULTIPLICA AL PERIODO = 1 (variar segun uso) Segun la configuración la escalera puede pegarse o separarse de los precios,, Se aplica toda la linea de tiempo, y a todas las divisas, etc.  
Indicador en MQL5, que obtiene el promedio de 10 EMAS, que son alineadas según Fibonacci, obteniendo un promedio, que sera suavizado.  Se puede ingresar un numero desde 2 a N, que multiplica a los EMA-Fibonacci. Funciona en cualquier criptomoneda, etc. etc... pudiendo calcular el futuro segun la tendencia de las EMAS. Funciona excelentemente en tramos largos, determinando exactamente el mejor inicio/salida. El precio inicial por apertura sera por un periodo de tiempo, luego aumentará.
QuantXSTocks Trading Range Indicator for MT5: INSTRUCTIONS TO USE OUR INDICATOR:- User needs to take trade on Arrow or after an Arrow CandleStick, You can achieve up-to 35-125 pips target by this Indicator. Best Timeframes for Stocks and Indices are M30 and H1: AMAZON M30 (50 pips) TESLA M30 (50 pips) APPLE M30 (50 pips) ADOBE M30 (50 pips) NASDAQ100 H1 (125 pips) The above are the approximate amount of pips you can achieve by this Indicator, Green arrow appears to be buy arrow while the Red ar
Super Suavizador
Cesar Juan Flores Navarro
Indicador en MQL5 que obtiene el promedio de 10 EMAS que son alineadas y procesadas según Fibonacci luego el promedio es suavizado"  Se ingresa un número de 2 a N que multiplica los EMA-Fibonacci y por consiguiente aumenta los fibonacci, resultando un promedio.   Se ingresa un número que suaviza los EMA-Fibonacci. Considerando los números 1/1 seria la suavización minima. Considerando los números 3/5 seria la suavización media. Considerando los números 10/30 seria la suavización alta.....etc
Trend and Signals MT5  indicator scans  30 trading Instruments (Forex, Metals and Indices).     It uses special algorithm on the  current market   based on   Pure Price Action   and display the overall trend and signal on the dashboard. When signals are produced the indicator sends alert and notification. Strategy for Signals This indicator uses the daily timeframe to determine the direction of the trend. The hourly timeframe is used to identify possible entries. Main trend and is determined by
This indicator is based on a mathematical formula and an ANN combined, designed to make a model(using previous prices) of the most recent market condition (any chart*) in order to use the model as a forecasting tool. *This indicator can operate on any chart/timeframe, but it's suggested you use multiple timeframes for each trade because this method relies solely on the time factor, you can not use this indicator to predict price volatility, but if it's fit correctly it will show you when the nex
This indicator is based on the crossing of two Moving Average with the RSI It is intended for scalpers Specially designed for Boom and Crash syhtetic indices from Binary.com/Deriv.com It is easy to use and intuitive. We recommend its use on M1 and is equipped with three types of notification Email alert Sound notification Push notification these parameters can be activated and deactivated.
Use with JUMP 25. However it can can with the volatility indices as well because it is a modified version. It is advisable to use create a healthy account management. Measure your risk and happy trading. Other experts to be loaded soon. These are modified in order to optimise profits. Ideal candidates are high risk, high returns individuals who hold trades at a maximum of 1 - 2 hours
This indicator is a scalping indicator intended solely for the Boom and Crash indices of the Deriv Limited market It supports Boom 500, Boom 1000, Crash 500 and Crash 1000 Not repaint and no bug The settings are intuitive and easy to use The product activation number is 20 The Time Frame used depends on the user If you are an aggressive scalper then just use M1 For long trades use M15 If you are conservative use M5 Please contact me for more details of its use
RadioMedia
Cesar Juan Flores Navarro
Indicador de MQL5 basado en 3 EMAs, en función del precio. El precio influye en las EMAs, de tal forma que los Máximos y Mínimos solo la alteran minimamente, este influjo lo llame radio. Considerando la influencia del radio como constante, por lo que no tiene valores de entrada. Ideal para todas las criptomonedas. Funciona en todos los tiempos. Se sugiere operar cuando el precio este abajo y en bajada.... o cuando el precio este encima y en subida.
El Super Suavizador Inteligente es la culminación de la evolución de los suavizadores en funcion del precio, funciona en todos los pares de divisas, es fácil de usar, y puedes usarlo varias veces en un mismo par, afin de darte una idea de hacia donde va el precio, muy util para ver la tendencia a largo plazo. El SSI trata siempre de formar ondas de subidas y bajadas a fin de poder mostrar el máximo y/o mínimo de la tendencia del precio.
Tomamos 5 medios móviles las unimos en una la cual suavizamos y volvemos a suavizar, resultando un mega suavizador de medios móviles suavizadas. Indicador de mql5 funciona en cualquier broker y para todos los tiempos, siendo el mas optimo el de 5, 15 a mas. Funciona mejor en grupo consigo misma osea poner uno de 14 y otro de 50 y 400,, así se observa mejor su desempeño.
AIS MT5 INDICATOR 5 ALL INCLLUSIVE SET GUIDE CHAPTER 1  IMPORTANT INFORMATION <1> THIS INDICATOR IS ONE OF THE SERIES OF NEW AIS INDICATORS AIS MT5 INDICATOR 1 =ADVANCED CLASSIC= AIS MT5 INDICATOR 2 =MULTIFRAMES= AIS MT5 INDICATOR 3 =LINES= AIS MT5 INDICATOR 4 =MARKET PROFILES= AIS MT5 INDICATOR 5 =ALL INCLUSIVE SET CHAPTER 2 GENERAL FEATURES OF THE SERIES <1> AIS MT5 INDICATOR 1 =ADVANCED CLASSIC= < DEVELOPMENT PAUSED >     DISPLAYS MAIN TIME POINTS AND PRICE LEVELS OF THE CHART      SUCH
Quantitative analysis software, this indicator came from another country and thanks to my network today I can share this software with you! Russian Tool plots arrows on your asset, indicating the trend the asset will enter, easy to use and easy to install indicator We have been working with robots and indicators since 2018! We came to MQL5 to be able to bring better benefits at the time of payment by our customers!, our Instagram where we post daily stories of operations: https://www.instagr
The Recuroid indicator shows very good entry points. Just look at the screenshots, then download the free version and look in the strategy tester and see for yourself. The system is based on two key algorithms. The first algorithm (managed) creates a system of balanced transition from the buy zone to the sell zone and vice versa, draws arrows and lines, and forms entries. The second algorithm (managing) corrects the initial data for the first algorithm (managed) by measuring virtual windows, t
フィルタ:
レビューなし
レビューに返信