Trend Strength MA indicator for MT4
- インディケータ
-
Renaud Herve Francois Candel
 ITC SOFTWARE is a technology company based in the United States since 2010.
🟠🔴 The company develops financial software and indicators for different trading platforms:
-Metatrader 4 and Metatrader 5
-TradingView
-NinjaTrader - バージョン: 1.40
- アップデート済み: 2 7月 2023
- アクティベーション: 5
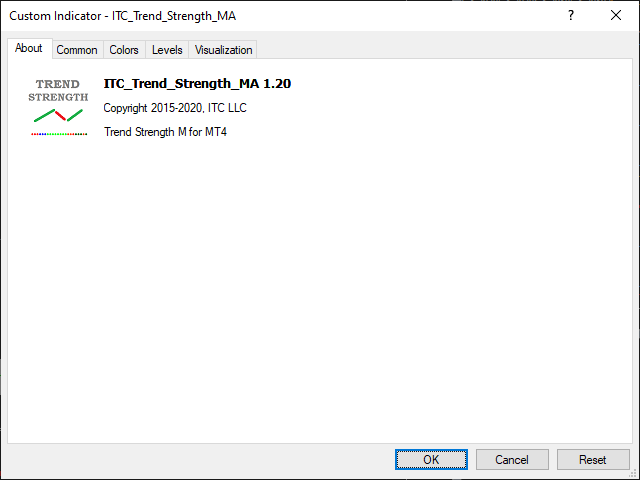
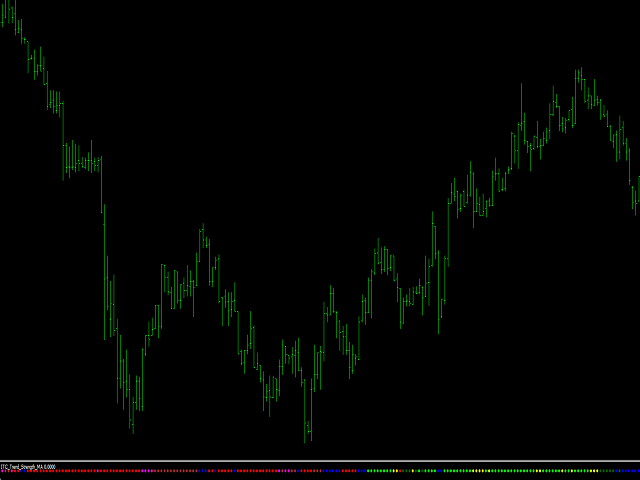
Trend Strength MA indicator
Trend Strength MA is a part of a series of indicators used to characterize market conditions.Almost any strategy only works under certain market conditions.
Therefore, it is important to be able to characterize market conditions at any time: trend direction, trend strength, volatility, etc.
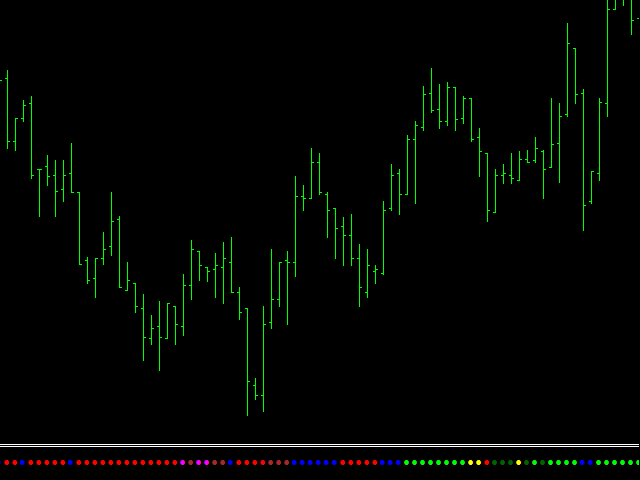
Trend Strength MA is an indicator to be used to characterize trend strength:
- Up extremely strong
- Up very strong
- Up strong
- No trend
- Down strong
- Down very strong
- Down extremely strong
Trend Strength MA is based on a combination of various standard indicators.
Trend Strength MA provides easy to read information about trend direction and strength.
The indicator has no input parameters. It is ready to be used directly in you chart without any optimization.
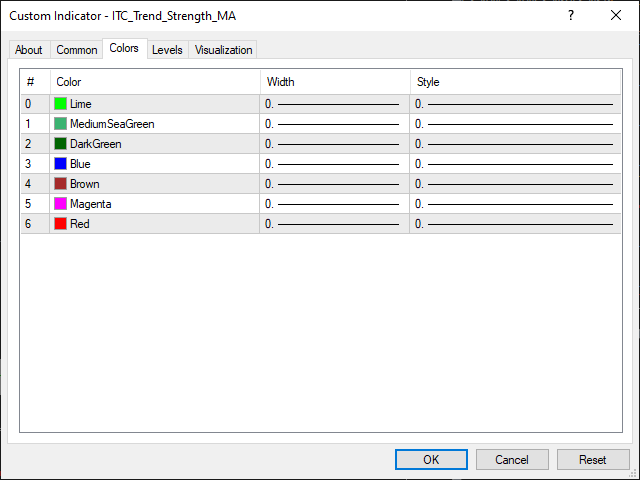
You can customize color and size of points displayed with the color tab of the indicator.
The indicator can be used with any class of asset: Forex, Stocks, Indices, Futures, Commodities and Cryptos.
The indicator works with any timeframe.
Other indicators for MT4:
We developed more than 60 indicators and utilities for Metatrader 4 and Metatrader 5.
Indicators for MT5:
All our indicators are developed both for MT4 and MT5.
List of all our indicators:
👉 You can get the complete list of our indicators visiting our profile page.