Binary Flow

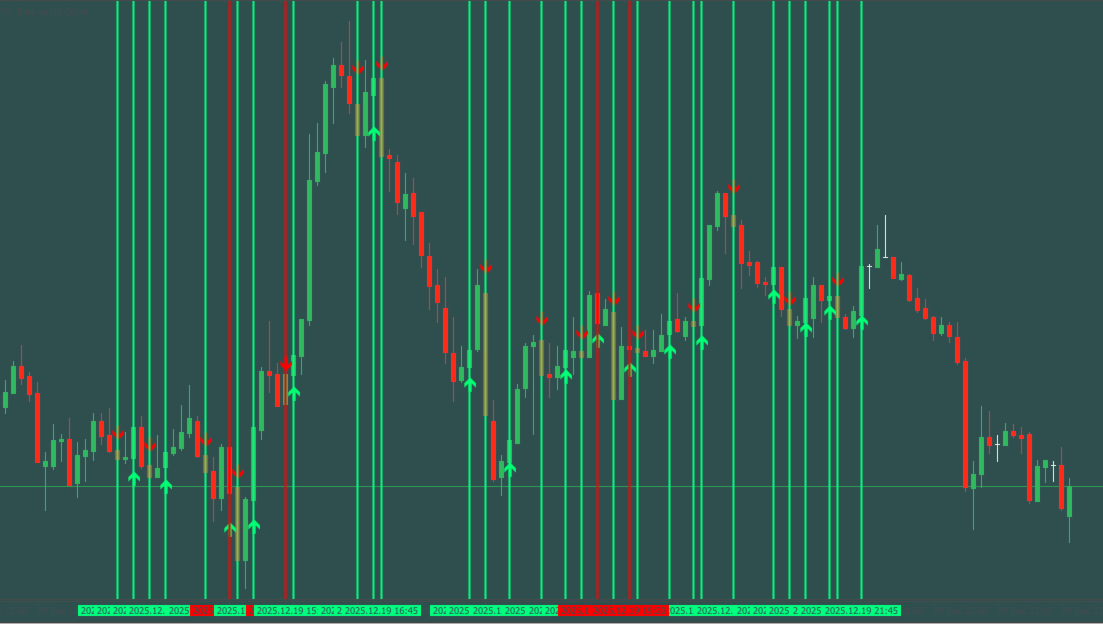
📊 The indicator simply delivers a large number of consecutive wins by issuing signals in which you can determine the start time and end time in the settings where the signals should begin and stop being issued, thus allowing it to be used in automation programs to perform automatic trades.

⏱️ It can be used in multiple timeframes, recommended in 1 minute, 5 minutes, 15 minutes.

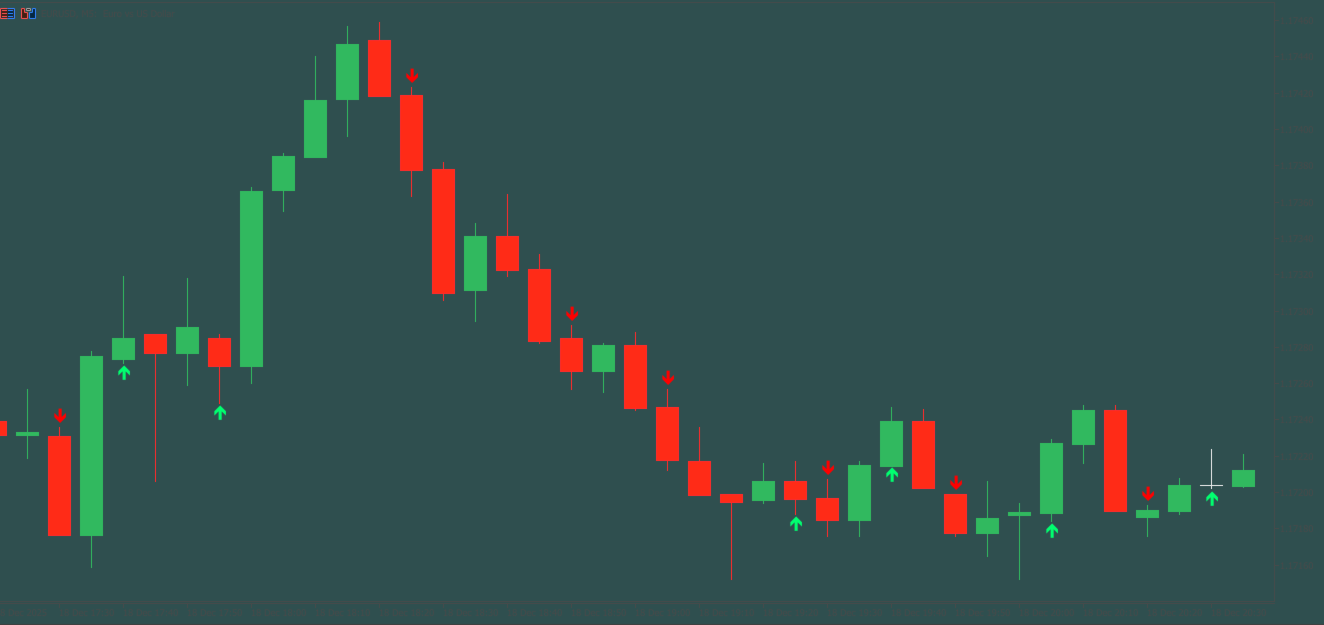
⚡ Trading mode > For the same candle in which the signal occurs.
➡️ The signal occurs at the beginning of the current candle, immediately issuing an arrow when the candle opens indicating the direction in which it should be traded.


おすすめのプロダクト
XpertTrader Pro - Multi-Filter Trading System XpertTrader Pro is an Expert Advisor that combines multiple technical analysis filters with grid trading and advanced risk management. It provides both automated and manual trading capabilities through a built-in control panel. XAUUSD SET FILE Signal Filters The EA uses three independent filters that work together to generate high-quality trading signals: OBV Filter - On-Balance Volume analysis with movement detection, trend confirmation, divergence
IVISTscalp5
Vadym Zhukovskyi
5 (6)
iVISTscalp5 — 時間ベースの市場予測システム iVISTscalp5は一般的なインジケーターではありません。 MetaTrader 5向けの時間ベースの予測システムであり、 市場がいつ動く可能性が高いかを特定します。 ⸻ 特徴  • 正確なタイミング  • BUY / SELL予測  • 平均利益の可能性  • 週間予測  • 120以上の金融商品 ⸻ コンセプト 市場は価格だけでなく時間によっても動く ⸻ iVISTscalp5 — 時間による優位性 iVISTscalp5インジケーターをご紹介します。このインジケーターは、トレーディングにおいて独自でありながら効果的です。時間データに基づくこのインジケーターは、多年にわたる経験と金融市場の深い分析の結果です。iVISTscalp5インジケーターは、手動トレーディングにとって優れたツールです。便利さ、簡単さ、可視化 - すべての複雑さが内部に隠されています。私たちは、iVISTscalp5インジケーターの設定と使用を最大限に簡素化しました。このインジケーターは、MT5ターミナルにあるすべての金融商品
Tabajara Rules for MT5 , based on Professor André Machado’s Tabajara Setup, indicates the market direction using moving averages when there are candles aligned with the direction of the moving average. The indicator contains the color rule applied to the candles and the moving average. It allows changing the parameters: period and smoothing method of the moving average. It also allows changing the colors of the candles (borders and filling) and of the moving average. Professor André Machado’s
FREE
概要 外国為替や金融市場では、迅速な反応と正確な意思決定が非常に重要です。しかし、標準のMetaTrader 5端末は最小でも1分のチャートしかサポートしておらず、トレーダーが市場の変動に敏感であることを制限しています。この問題を解決するために、 秒単位チャートキャンドルインジケーター を導入しました。このインジケーターを使用すれば、1秒から30秒の市場の動向をサブチャートで簡単に表示・分析できます。 主な機能 複数の秒単位タイムフレームのサポート :このインジケーターは、以下のタイムフレームを選択でき、さまざまな取引戦略に対応します: S1 : 1秒 S2 : 2秒 S3 : 3秒 S4 : 4秒 S5 : 5秒 S10 : 10秒 S15 : 15秒 S20 : 20秒 S30 : 30秒 リアルタイム更新 :秒単位チャートはリアルタイムで更新され、各瞬間に最新の市場情報を提供します。これにより、迅速な取引判断が可能になります。 ユーザーフレンドリーなインターフェース :インジケーターはサブチャートに表示され、直感的で使いやすいです。異なるタイムフレームに素早く切り替えて市場を迅速
The Expert Advisor analyzes tick micro-signals and determines the direction to open a position. Micro-signals are identified by predetermined codes, which in the optimization are recorded in the settings of the bot. When a bot sees the corresponding micro-signal, it reacts to it by opening a position and its accompaniment! The bot has good predictability. You can check the work of the bot on the simulation of real history, how to configure the tester will be shown in the screenshot. Also, we sh
The indicator shows buy and sell signals.  The " CounterTrend 5 " is designed to recognize profitable counter trend patterns from your chart. Features: The CounterTrend 5 is a Counter-Trend Trading with Simple Range Exhaustion System. Signals based on the daily trading range. The indicator calculates the trading range for the last few days and compare the price movements on short time intervals and generating short term reversal points.  This is a leading indicator. It works on any instruments.
Blue Orbit 今日の価格 は 190 です。 10 コピーが売れると、新しい価格は 249 になります。早めの slot をお見逃しなく。 現在の販売数: 9 。 市場の自然な「フローダイナミクス」を解釈するために設計された Blue Orbit で、自動取引の新しい時代に足を踏み入れてください。このシステムは、リアルタイムのモメンタムシフトを読み取り、疲労ゾーンを検出し、トレンドの疲労が反転の強さに出会うところでエントリーを実行することに重点を置いています。これは非線形で流動的なアプローチであり、厳格な機械的セットアップをはるかに超えています。 MQLで私たちの成長するトレーダーコミュニティに参加しましょう:  (こちらをクリック) EAの洞察を深く掘り下げましょう:   (こちらをクリック) 概要 チャートシンボル: XAUUSD (シングルチャートセットアップ) 時間足: M15 最適: XAUUSD 最小入金: おすすめは$500 レバレッジ: 1:100から1:500が最適 適切なバックテスト: 私に連絡して   セットアップファイルとヘルプノートを送ります
Fx Trend Scalper EA
Fernando De Paljla Silva
Fx Trend Scalper uses the Bollinger Bands indicator with intelligent settings and combinations. Furthermore, it uses various Price Action features to identify specific patterns on the chart to identify a market entry signal . This setup is frequently used by professional traders around the world. If you want a reliable EA, Fx Trend Scalper is for you. Fx Trend Scalper does not use AI, martingale or Grid, it does not work miracles, but it is safe. The results shown in the images are out of sample
ダイナミックRSIガーディアン – 精密な取引と完全なリスク管理 ダイナミックRSIガーディアンは、一貫したパフォーマンス、厳格なリスク管理、柔軟性を重視するトレーダーのためのプロフェッショナルなアルゴリズム取引システムです。高度なピップベースの計算とRSI駆動のインテリジェントなフィルターを基盤としており、すべての取引が厳格なルールに従い、リスクを最小限に抑えつつ機会を最大化します。 主な機能 : スマートエントリーシステム • RSIに基づく多層フィルター確認 • 高確率シグナルの検出とチャート上での矢印視覚化 完全なリスク管理 • リスクパーセンテージに基づく動的手数計算 • 最大ポジション数と取引チェック(過剰取引防止) • 無効なストップロスレベルの保護 高度な出口戦略 • ATRまたは固定ピップに基づくトレーリングストップ • 調整可能なストップロスとテイクプロフィット(ピップベース) • ブローカーの制限に対応した自動ストップロス修正 ビジュアルHUDダッシュボード • リアルタイムステータス(買い、売り、ブロック) • 市場状況の表示 • シグナル追跡と分
FREE
DUAL-DIRECTION GRID SYSTEM • Simultaneous BUY and SELL grid management • Dynamic pending order placement with price tracking • Intelligent order spacing and distance control • Automatic grid adjustment based on market conditions • Support for trend-following or counter-trend strategies ADVANCED DCA STRATEGY • Configurable lot multiplier (martingale/anti-martingale) • Additional lot increment per level • Customizable decimal precision for lot sizing • Automatic position averaging • Smart en
FxHydra
Sif-eddine Tabet
Live Signal Tickmill :   CLICK HERE  !!!! This account reflects the actual live trading results of the EA , including verified statistics such as profit, drawdown, win rate, and trade history. Users can independently review the performance directly on MQL5 to ensure full transparency before using the system. All published backtests of FX Hydra are conducted using the safest risk settings , designed to prioritize stability and controlled drawdown rather than aggressive profit optimization. FX
Shadow Pulse 概要 Shadow Pulseは、平均回帰法に基づいて反転ポイントを特定するプロフェッショナルなインジケーターです。インテリジェントなマルチレベルフィルタリングシステムを使用して、高精度の売買シグナルを生成します。 トレーディング戦略 このインジケーターはM1からH4までのあらゆる時間軸で動作するように設計されており、ゴールド(XAUUSD)のスキャルピングで卓越した結果を示します。低時間軸でのアグレッシブな取引から、高時間軸での中期ポジションまで効果的に適用できます。 価格の勢いが枯渇する瞬間を特定し、その後リバウンドでポジションに入るという原理で機能します。システムは主要レベルに対する価格の過剰な伸びの臨界ゾーンを特定し、反転の動きを確認した時のみシグナルを形成します。 矢印は閉じた足でのみ表示され、決して再描画されません。これはシグナルの絶対的な安定性を保証し、あらゆる期間におけるインジケーターの過去のパフォーマンスを客観的に評価できます。 • 足の下の青い矢印 — ロングポジション(買い)を開くシグナル • 足の上の赤い矢印 — ショートポジション(売
Trading concept: When price touches or exceeds the upper circle boundary = potential sell signal (overbought) When price touches or falls below the lower circle boundary = potential buy signal (oversold) The circle acts like a dynamic support/resistance band around the opening price The numbered points (1-24) help identify where in the cycle the price currently is This is similar to using Bollinger Bands or other envelope indicators, but with a fixed radius instead of standard deviations.
Templerfx Nightmare is an EA that uses artificial intelligence technology to analyze data of many indicators. EA will have the best option to enter orders. The biggest difference of Templerfx Nightmare  is that the EA can control the Risk:Reward ratio much better than other EAs.That is possible because of a set of indicators to control entry points and manage open orders.  This EA is specifically designed to maximize trading opportunities on (Rise 300 Index ) pair on the M15 timeframe on a spec
Puma
Mike Wilson Namaru
PUMA PUMA is not just another Expert Advisor. It is a fully autonomous, institutional-grade algorithmic trading engine built for MetaTrader 5, engineered to hunt high-probability setups on XAUUSD (Gold), Bitcoin, NAS100 and all major pairs — 24 hours a day, 5 days a week, without you lifting a finger.  Combining Smart Money Concepts, price action pattern recognitio n, multi-factor confluence scoring, adaptive grid management, and an on-chart cinematic live dashboard, this EA brings institutional
Master Oscillatorsという、取引をシンプルかつフレキシブルに行うことができるボットをご紹介します!RSI、CCI、またはStochasticのシグナルから選択し、あなた自身の戦略を構築してください。このボットは、MAフィルター、ダイナミックロットサイズ、ケリー基準計算機、ダイナミックSLおよびTPレベルなど、多くのツールを提供します。 あなたの取引スタイルに関係なく、Master Oscillatorsはあなたのためにここにあります。重要な情報、統計データなどを提供し、常に取引を安全に保ちます。自分の取引ボットを作りたいと思っていたが方法がわからなかったという方も、Master Oscillatorsがあなたを助けることができます。 今日からMaster Oscillatorsを使い始めて、あなたの取引を向上させましょう! ユーザーガイド:  https://www.mql5.com/en/blogs/post/753361 新着情報!!! アンチマーチンゲールシステムが導入されました!非常に低いリスクで高い利益を得ることができます! https://www.mql
Breadwinner EMA Pro
Isidro Jr Rosalada Dadula
リスク管理に焦点を当てた自動化された外国為替取引 これはAIによって生成された翻訳です。一部のエラーが含まれている可能性があることに注意してください。 (DFX MQL5コミュニティの更新された設定ファイル/設定、以下のリンクを参照) 収益性への規律あるアプローチによるEMAクロスオーバーの力を解き放つ DFXのEMA Pro は、あなたの取引戦略を自動化するために設計された強力で使いやすい外国為替エキスパートアドバイザー(EA)です。これは、堅牢なリスク管理機能とカスタマイズ可能な設定を備えた、実績のあるEMA(指数移動平均)クロスオーバー戦略に基づいて構築されています。 EMA Proが他と異なる点: 戦略的EMAクロスオーバー: シンプルで効果的: EAは2つのEMA、速いEMAと遅いEMAを使用します。速いEMAが遅いEMAを上回ると買いシグナルが生成され、速いEMAが遅いEMAを下回ると売りシグナルが生成されます。このクロスオーバー戦略は、潜在的なトレンドの変化を特定し、その機会を活かすことを目的としています。 タイムフレームのカスタマイズ: EMAクロスオーバー分析のための
EYeQ インジケーターは、STEP INDEX、VOLATILITY 10、25、50、75 100、BOOM、および CRUSH でエントリーシグナルを提供するための強力なツールです。 BOOMやCRUSH 300、500、1000でのSPIKESをより効果的にキャッチ。 EYeQ インジケーターは、複数の時間枠にわたって市場を分析し、トレンドに基づいて最適なエントリー ポイントを見つけます。デスクトップ アラートをオンにするだけで、シグナルがリリースされたときに通知を受け取ることができます。電話やタブレットなどの他のポータブル デバイスへのプッシュ通知を許可して、そのようなデバイスでのリモート取引のアラートを受け取ります。 N/B: Boom および Crush インデックスでの TRADING TICKS の取引は避けてください。また、指標は終了ポイントを提供しないことに注意してください。MetaTrader プラットフォームの各商品の最小ロット サイズで 3 USD の利益が発生した場合は、終了する必要があります。 例: 最低ロットサイズ;ステップインデックス-0.
Daily Volatility Tracker   is a practical and lightweight indicator designed to help traders monitor and analyze market volatility based on historical daily price movements. Whether you're a day trader, swing trader, or scalper, understanding how much a market moves per day is critical for: Choosing the right pairs to trade Setting accurate stop-loss and take-profit levels Adapting to changing market conditions MT4 Version -  https://www.mql5.com/en/market/product/134958/ Join To Learn Market De
FREE
The EA is based on   trend trading strategy . Mechanism " trend trading strategy " is a tendency of a financial market price to move in a particular direction over time. If there is a turn contrary to the trend, This mechanism will exit and wait until the turn establishes itself as a trend in the opposite direction, and re-enter when the trend re-establishes. This EA has been backtested for 9 years of real tick data (2015-2023), consistent with the latest trading accounts. Immortal MT4:   https:
**Zonar Smart Analysis** is a complete "Smart Money" trading system designed for MetaTrader 5. It automates the classic **Opening Range Breakout (ORB)** strategy while filtering false signals using advanced Price Action algorithms (Wick Rejection & Swing Analysis). Stop guessing where the session is going. Let Zonar draw the zones, identify the breakout, and highlight institutional Order Blocks for maximum confluence. ### Key Features * **Automated ORB Box:** Automatically detects the Market
Finvesting EA
Ugochukwu Mobi
5 (1)
通貨取引の世界で信頼できる味方である Finvesting EA を使用して、外国為替投資の可能性を最大限に引き出してください。 このエキスパートアドバイザー (EA) は、お客様の外国為替投資を強化し、自信を持って財務目標を達成できるように設計されています。 ライブパフォーマンス: Finvesting EA には、安定した取引によるライブ実績があります。 リアルアカウント ライブパフォーマンス MT4 : https://www.mql5.com/ja/signals/1715664 MT5: https://www.mql5.com/ja/signals/1973370 Finvesting EA の可能性を発見し、成功した外国為替投資家のコミュニティに参加してください。 Finvesting EA を使用して潜在能力を最大限に引き出し、投資を成功させましょう。 より明るい経済的未来に向けて、今すぐ第一歩を踏み出しましょう。 主な特徴: 高度なアルゴリズム: Finvesting EA は、テクニカル分析、市場センチメント、履歴データを組み合わせてインテリジェントな投
Crypto_Forex MT5用インジケーター「 TREND Histogram 」(リペイント不要) - TREND Histogramインジケーターは、標準的な移動平均線クロスよりもはるかに高感度で効率的です。 - インジケーターの色は2色から選択可能:弱気トレンドは黄色(金色)、強気トレンドは緑(色は設定で変更できます)。 - TREND Histogramには、モバイルとPC向けのアラート機能が組み込まれています。 - このインジケーターは、プライスアクション、VSA、その他のインジケーターなど、他の取引手法と組み合わせるのに最適です。 - このヒストグラムは、価格と数量のデータを 1 つの値に結合する主要な指標の 1 つです。 高品質のトレーディングロボットとインジケーターをご覧になるにはここをクリックしてください! これは、このMQL5ウェブサイトでのみ提供されるオリジナル製品です。
Ichimoku Map (instant look at the markets) - built on the basis of the legendary Ichimoku Kinko Hyo indicator. The task of the Ichimoku Map is to provide information about the market strength on the selected time periods and instruments, from the point of view of the Ichimoku indicator. The indicator displays 7 degrees of buy signal strength and 7 degrees of sell signal strength. The stronger the trend, the brighter the signal rectangle in the table. The table can be dragged with the mouse. The
Introducing CybeCore EA - a cutting-edge Forex trading advisor that utilizes an innovative strategy based on fully-transformers without decoders, operating on the foundation of the CyberVision EA advisor. What sets CybeCore EA apart from CyberVision EA is its ability to analyze data with unprecedented accuracy and speed, achieved through the application of advanced machine learning techniques. CybeCore EA employs a decoder-less architecture, significantly enhancing the efficiency of its trading
Unveil the Hidden Institutional Order Flow with AI-Powered Clustering. Most retail traders lose money because they trade based on empty price action and imaginary support/resistance lines. Titan AI: Volume Cluster Sniper changes the game entirely. Powered by a sophisticated K-Means Machine Learning Algorithm , this premium tool scans the historical price memory and real tick volume to reveal exactly where "Smart Money" is accumulating or distributing their positions. How the AI Engine Works:
BullBea Display
Everton Fernando Da Silva Messias
1. 基本情報 インジケーター名:   BullBear Display バージョン:   1.00 開発者:   [あなたの名前] 会社:   MT5TOOLSLAB 種類:   チャートインジケーター 市場:   外国為替、株式、先物、暗号通貨 2. 説明 BullBear Display   は以下をリアルタイムで表示する視覚的インジケーターです: ブル(買い手)の強さ ベア(売り手)の強さ 市場支配権(価格をコントロールしている側) このインジケーターはチャートの左上隅に情報を表示し、市場センチメントの迅速な分析を可能にします。 3. インストール BullBear_Display.mq5   を保存:   \MQL5\Indicators\ MetaTrader 5を再起動 「ナビゲータ」ウィンドウで「カスタムインジケーター」を探す 目的のチャートにドラッグ&ドロップ 4. 入力パラメータ PeriodBuySell   (デフォルト: 13): EMA参照計算の期間。低い値はより敏感なシグナルを、高い値はより滑らかなシグナルを生成します。 5. シグナル解釈 支配: ブル
Introduction to Fractal Pattern Scanner Fractal Indicator refers to the technical indicator that makes use of the fractal geometry found in the financial market. Fractal Pattern Scanner is the advanced Fractal Indicator that brings the latest trading technology after the extensive research and development work in the fractal geometry in the financial market. The most important feature in Fractal Pattern Scanner is the ability to measure the turning point probability as well as the trend probabil
Golden US Nights MT5 first places a virtual buy-stop order after the daily close of trading on US stock exchanges, using a sophisticated price action algorithm to determine the optimal price for market entry. No Martingale or grid strategies are used, and all orders are equipped with stop-losses. Installation is simple on an XAUUSD chart of any timeframe, which can be changed at any time without affecting the expert's workflow. The onscreen panel provides important parameters and status informa
YenFlow
Kelly Philip Aketch
This is a machine learning trend following strategy based on the Ichimoku Kinko Hyo indicator combined with market volatility and volume metrics. It works best on the H1 Chart . The signals utilized to begin trading are carefully vetted via the machine learning capability, and a sophisticated algorithm ensures that the trader remains in the trend for as long as possible. Features. This is a fully automated multi-symbol expert advisor. It works on the following symbols USDJPY, AUDJPY, CHFJPY, EU
このプロダクトを購入した人は以下も購入しています
ARIPoint is a powerful trading companion designed to generate high-probability entry signals with dynamic TP/SL/DP levels based on volatility. Built-in performance tracking shows win/loss stats, PP1/PP2 hits, and success rates all updated live. Key Features: Buy/Sell signals with adaptive volatility bands Real-time TP/SL/DP levels based on ATR Built-in MA Filter with optional ATR/StdDev volatility Performance stats panel (Success, Profit/Loss, PP1/PP2) Alerts via popup, sound, push, or email Cu
このインジケーターを購入された方には、以下の特典を 無料 で提供しています: 各トレードを自動で管理し、ストップロスとテイクプロフィットを設定し、戦略ルールに基づいてポジションを決済する補助ツール 「Bomber Utility」 様々な銘柄に合わせたインジケーターの設定ファイル(セットファイル) 「最小リスク」、「バランスリスク」、「待機戦略」 の3つのモードで使用できる Bomber Utility 用の設定ファイル このトレーディング戦略をすぐに導入・設定・開始できる ステップバイステップのビデオマニュアル ご注意: 上記の特典を受け取るには、MQL5のプライベートメッセージシステムを通じて販売者にご連絡ください。 オリジナルのカスタムインジケーター 「Divergence Bomber(ダイバージェンス・ボンバー)」 をご紹介します。これは、MACDのダイバージェンス(乖離)戦略に基づいた 「オールインワン」型のトレーディングシステム です。 このテクニカルインジケーターの主な目的は、価格とMACDインジケーターの間に発生するダイバージェンスを検出 し、将来の価格の動きを示す
Quantum TrendPulse を ご紹介します。これは、   SuperTrend   、   RSI   、および Stochastic のパワーを 1 つの包括的なインジケーターに組み合わせて、取引の可能性を最大限に引き出す究極の取引ツールです。精度と効率を求めるトレーダー向けに設計されたこのインジケーターは、市場のトレンド、勢いの変化、最適なエントリー ポイントとエグジット ポイントを自信を持って特定するのに役立ちます。 主な特徴: SuperTrend 統合: 現在の市場動向に簡単に追従し、収益性の波に乗ることができます。 RSI精度: 買われすぎと売られすぎのレベルを検出し、市場の反転のタイミングに最適で、SuperTrendのフィルターとして使用されます。 確率的精度: 確率的振動を活用して、変動の激しい市場で隠れたチャンスを見つけます。SuperTrend のフィルターとして使用されます。 マルチタイムフレーム分析:   M5 から H1 または H4 まで、さまざまなタイムフレームで市場を常に把握します。 カスタマイズ可能なアラート: カスタム取引条件が満たされ
Azimuth Pro
Ottaviano De Cicco
5 (7)
Azimuth Pro V2:MT5向けシンセティック・フラクタル構造分析と確認済みエントリー 概要 Azimuth Pro は Merkava Labs によるマルチレベルスイング構造インジケーターです。4つのネストされたスイングレイヤー、スイングアンカーVWAP、ABCパターン検出、3タイムフレーム構造フィルタリング、そして確定バーでの確認済みエントリー — 1つのチャートで、ミクロスイングからマクロサイクルまでを網羅するワークフロー。 これはブラインドシグナル製品ではありません。ロケーション、コンテキスト、タイミングを重視するトレーダーのための構造ファーストワークフローです。 V2発売記念オファー — Azimuth Pro V2をUSD 399で(次の100本)。最終価格:USD 499。 1. V2での変更点 シンセティック・マルチタイムフレームエンジン 上位タイムフレーム分析をMeridian Proと同じ独自のシンセティックアーキテクチャで一から再構築。よりクリーンなHTFコンテキスト、安定したライブ動作、従来のMTF同期問題なし。シンセティックエンジンは 固定比率タ
SignalTech MT5 is a trading system for EURUSD, USDCHF, USDJPY, AUDUSD, NZDUSD, EURJPY, AUDJPY, NZDJPY, CADJPY H2 and H3 Timeframe.  It can generate signals with Buy/Sell Arrows and Pop-Up/Sound Alerts. Each signal has clear Entry and Stop Loss levels, which should be automatically flagged on the chart, as well as potential Targets 1, 2, and 3. The Entry and TP levels are fixed after the trade is taken. The exit level is dynamic. If there are signs of a potential short-term trend reversal, the
ご紹介     Quantum Breakout PRO は 、ブレイクアウト ゾーンの取引方法を変革する画期的な MQL5 インジケーターです。 13年以上の取引経験を持つ経験豊富なトレーダーのチームによって開発されました。     クォンタム ブレイクアウト プロ   は、革新的でダイナミックなブレイクアウト ゾーン戦略により、あなたのトレーディングの旅を新たな高みに押し上げるように設計されています。 クォンタム ブレイクアウト インジケーターは、5 つの利益ターゲット ゾーンを備えたブレイクアウト ゾーン上のシグナル矢印と、ブレイクアウト ボックスに基づいたストップロスの提案を提供します。 初心者トレーダーにもプロのトレーダーにも適しています。 量子EAチャネル:       ここをクリック 重要!購入後、インストールマニュアルを受け取るためにプライベートメッセージを送ってください。 推奨事項: 時間枠: M15 通貨ペア: GBPJPY、EURJPY、USDJPY、NZDUSD、XAUUSD アカウントの種類: ECN、Raw、またはスプレッドが非常に低い R
優れたテクニカルインジケーター「Grabber」をご紹介します。これは、すぐに使える「オールインワン」トレーディング戦略として機能します。 ひとつのコードに、市場のテクニカル分析ツール、取引シグナル(矢印)、アラート機能、プッシュ通知が強力に統合されています。 このインジケーターを購入された方には、以下の特典を無料で提供します: Grabberユーティリティ:オープンポジションを自動で管理するツール ステップバイステップのビデオマニュアル:インジケーターのインストール、設定、取引方法を解説 カスタムセットファイル:インジケーターをすばやく自動設定し、最大限の成果を出すための設定ファイル 他の戦略はもう忘れてください!Grabberだけが、あなたを新たなトレードの高みへと導いてくれるのです。 Grabber戦略の主な特徴: 推奨タイムフレーム:M5〜H4 対応通貨ペア・資産:どれでも使用可能ですが、私が実際に検証した以下を推奨します(GBPUSD、GBPCAD、GBPCHF、AUDCAD、AUDUSD、AUDSGD、AUDCHF、NZDUSD、NZDCAD、EURCAD、EURUSD、E
マーケットメーカーのためのツール。 Meravith は次の機能を提供します: すべての時間足を分析し、現在有効なトレンドを表示します。 強気と弱気の出来高が等しくなる流動性ゾーン(出来高均衡)を強調表示します。 異なる時間足のすべての流動性レベルをチャート上に直接表示します。 テキスト形式の市場分析を生成し、参考情報として表示します。 現在のトレンドに基づいて目標値、サポートレベル、ストップロスを計算します。 取引のリスクリワード比を算出します。 口座残高に基づいてポジションサイズを計算し、潜在的な利益を推定します。 また、市場に大きな変化があった場合には警告を表示します。 インジケーターの主要ライン: 強気/弱気の出来高エグゾーストライン ― 目標値として機能します。 市場のトレンドを示すライン。市場が強気か弱気かによって色が変わり、トレンドのサポートとして機能します。主にその色が市場センチメントを示します。 出来高均衡ライン(Eq)。Eq(Volume Equilibrium)ラインはシステムの中核です。これは買い手と売り手の出来高のバランスポイントを表します。市場の流動性を示し
トレンド スクリーナー インジケーターでトレンド取引の力を解き放ちます。ファジー ロジックと複数通貨システムを活用した究極のトレンド取引ソリューションです。 ファジー ロジックを活用した革新的なトレンド インジケーターである Trend Screener を使用して、トレンド取引を向上させます。 これは、13 を超えるプレミアム ツールと機能、および 3 つの取引戦略を組み合わせた強力なトレンド追跡インジケーターであり、Metatrader をトレンド アナライザーにする多用途の選択肢となります。 期間限定オファー : トレンド スクリーナー インジケーターは、わずか 100 ドルで生涯ご利用いただけます。 (元の価格 50$ ) (オファー延長) Trend Screener の 100% 非再描画精度の揺るぎない精度を体験して、取引の決定が過去の価格変動の影響を受けないようにしてください。 マルチタイムフレームおよびマルチ通貨機能の多用途性を解放し、比類のない自信を持って外国為替、商品、暗号通貨、インデックスの世界を取引できるようにします。 Trend Screener の包括的な
CGE Trading Suite
Carl Gustav Johan Ekstrom
5 (2)
Institutional-Grade Analytics for MT5 C GE Trading Suite delivers the analytical edge typically reserved for professional trading desks. The platform integrates a full suite of analytical tools into one seamless workflow: dynamic grid mapping, liquidity behavior analysis, ECM, trend lines, MIDAS, trade cycles, and directional channel projections. Together, these provide a unified view of market structure and momentum. Directional clarity is further enhanced by the capital flow index, which meas
BTMM State Engine Pro is a MetaTrader 5 indicator for traders who use the Beat The Market Maker approach: Asian session context, kill zone timing, level progression, peak formation detection, and a multi-pair scanner from a single chart. It combines cycle state logic with a built-in scanner dashboard so you do not need the same tool on many charts at once. What it does Draws the Asian session range; session times can follow broker server offset or be set in inputs. Tracks level progression (L
OmniSync Projection
Antonio-alin Teculescu
5 (1)
Chronos Fractal Engine is an innovative price projection indicator for MetaTrader 5, designed to transform your technical analysis by intelligently identifying and projecting historical price patterns. Built upon an advanced correlation algorithm and the fractal principles of the market, this powerful tool visualizes potential future price movements, giving you a unique edge in your trading decisions. What is Chronos Fractal Engine? At its core, the Chronos Fractal Engine employs a sophisticat
Bill Williams Advanced is designed for automatic chart analysis using Bill Williams' "Profitunity" system. The indicator analyzes four timeframes at once. Manual (Be sure to read before purchasing) Advantages 1. Analyzes the chart using Bill Williams' "Profitunity" system. Signals are displayed in a table in the corner of the screen and on the price chart. 2. Finds all known AO and AC signals, as well as zone signals. Equipped with a trend filter based on the Alligator. 3. Finds "Divergence Bar
Berma Bands
Muhammad Elbermawi
5 (8)
Berma Bands (BBs) インジケーターは、市場のトレンドを特定して活用したいトレーダーにとって貴重なツールです。価格と BBs の関係を分析することで、トレーダーは市場がトレンド段階にあるか、レンジ段階にあるかを判断できます。 詳細については、[ Berma Home Blog ] をご覧ください。 バーマ バンドは、上部バーマ バンド、中部バーマ バンド、下部バーマ バンドの 3 つの異なる線で構成されています。これらの線は価格の周りにプロットされ、全体的な傾向に対する価格の動きを視覚的に表します。これらのバンド間の距離から、ボラティリティや潜在的な傾向の反転についての洞察を得ることができます。 バーマ バンドの線がそれぞれ離れると、市場が横ばいまたはレンジ相場の期間に入っていることを示すことがよくあります。これは、明確な方向性の偏りがないことを示しています。トレーダーは、これらの期間中にトレンドを特定するのが難しいと感じる可能性があり、より明確なトレンドが出現するまで待つ場合があります。 バーマ バンドの線が 1 本の線に収束すると、強いトレンド環境の兆候となること
これはMT5のインジケーターで、再描画なしで取引に参入するための正確なシグナルを提供します。 外国為替、暗号通貨、金属、株式、インデックスなど、あらゆる金融資産に適用できます。かなり正確な見積もりを提供し、取引を開始して終了するのに最適な時期を教えてくれます。1つのシグナルを処理しただけでインジケーターの元が取れた例の 動画 (6:22)をご覧ください。Entry PointsPro インジケーターの助けを借りたほとんどのトレーダーの最初の1週間の結果が改善しています。 Telegramグループ に登録してください。Entry Points Proインジケーターのメリットは次の通りです。 再描画のないエントリーシグナル 再描画されるインジケーターでは一度表示されたシグナルが削除されて大きな金銭的損失につながることがありますが、これと異なり、表示されて確認されたシグナルは消えることがありません。 エラーなしの取引開始 インジケーターアルゴリズムによって取引を開始する(資産を売買する)理想的な瞬間を見つけることができます。それを使用するすべてのトレーダーの成功率が向上します。 あら
Gannスクエアインジケーターは、W.D. Gannによって執筆された「市場予測のための数学的な式」の記事に基づく強力な市場分析ツールです。このツールは、解析に数学的な概念を応用し、Gann理論に基づいています。それは、144、90、52のスクエアや9のスクエアなど、Gannの関連テクニックの要素を取り入れています。さらに、の方法を組み込んでおり、9のスクエアとその関連性についてのチャネルやスターパターンに焦点を当てています。 ユーザーマニュアルと使用方法: このインジケーターを使用する前に、ユーザーマニュアルを読んで疑問点を解決するためにお問い合わせいただくことをお勧めします。ユーザーマニュアルの完全版は、当社のウェブサイトで入手できます。 MT5の完全版は購入できますし、MT4の無料版も試すことができます。両方のバージョンへのリンクを提供していますので、ご利用ください。 主な機能と機能: Gannスクエアインジケーターは、市場分析のための完全なツールセットを提供し、幾何学的な概念とGann理論に基づいて的確な判断を行う手助けをします。以下に主な機能を示します。 9のスクエアの分析:
Cvd Divergence
Thalles Nascimento De Carvalho
CVD Divergence ― オーダーフローとダイバージェンスのプロフェッショナル分析 CVD Divergence は、価格と Cumulative Delta Volume(CVD)との間に発生する信頼性の高いダイバージェンスを検出するために開発されたテクニカル指標です。実際の注文フローが価格の動きを確認していない局面を正確に捉え、反転、勢いの減衰、そして機関投資家による操作の可能性を示します。 このインジケーターは、アグレッシブボリュームの読み取りと価格構造の分析を組み合わせ、明確で客観的かつ先行性のあるシグナルを提供します。 インジケーターの機能 CVD Divergence は、累積デルタボリュームを用いて注文フローの方向と価格の方向を比較します。両者が大きく乖離した際、チャート上にマーカーを表示し、ダイバージェンスの方向を視覚的に示します。 検出できる内容: 強気ダイバージェンス(価格が下落しているが CVD が上昇している場合) 弱気ダイバージェンス(価格が上昇しているが CVD が下降している場合) 買い手・売り手の勢いの枯渇 機関投資家の不均衡によるフェイクムーブ
まず第一に、この取引ツールはノンリペイント、ノンリドロー、ノンラグの指標であり、プロの取引に理想的ですことを強調する価値があります。 オンラインコース、ユーザーマニュアル、デモ。 スマートプライスアクションコンセプトインジケーターは、新米から経験豊富なトレーダーまで、非常 に強力なツールです。Inner Circle Trader AnalysisやSmart Money Concepts Trading Strategiesなど、20以上の有用な指標を1つに組み合わせています。このインジケーターはスマートマネーコンセプトに焦点を当て、大手機関の取引方法を提供し、彼らの動きを予測するのに役立ちます。 特に、流動性分析に優れており、機関がどのように取引しているかを理解しやすくしています。市場のトレンドを予測し、価格の動きを慎重に分析するのに優れています。機関の戦略とトレードを合わせることで、市場の動向についてより正確な予測ができます。このインジケーターは多目的であり、市場構造を分析し、重要な注文ブロックを特定し、さまざまなパターンを認識するのに優れています。 このインジケーター
Presenting one-of-a-kind Gann Indicator for XAUUSD IQ Gold Gann Levels is a non-repainting, precision tool designed exclusively for XAUUSD/Gold intraday trading. It uses W.D. Gann’s square root method to plot real-time support and resistance levels, helping traders spot high-probability entries with confidence and clarity. William Delbert Gann (W.D. Gann) was an exceptional market analyst whose trading technique was based on a complex blend of mathematics, geometry, astrology, and ancient calcul
RelicusRoad Pro: 定量的市場オペレーティングシステム 【期間限定】無制限アクセス 70% OFF - 2,000人超のトレーダーと共に なぜ多くのトレーダーは「完璧な」インジケーターを使っても失敗するのでしょうか? それは、文脈を無視して 単一の概念 だけでトレードしているからです。文脈のないシグナルは単なるギャンブルです。勝ち続けるには、 根拠の重なり(コンフルエンス) が必要です。 RelicusRoad Proは単なる矢印インジケーターではありません。完全な 定量的市場エコシステム です。独自のボラティリティモデリングを用いて、価格が推移する「適正価値の道(Fair Value Road)」をマッピングし、ノイズと真の構造的ブレイクを判別します。 推測はやめましょう。機関投資家レベルの「ロード・ロジック」でトレードを。 コアエンジン:「Road」アルゴリズム システムの中心となる Road Algo は、市場環境にリアルタイムで適応するダイナミックなボラティリティチャネルです。 安全ライン(平衡点) と、価格が数学的に反転しやすい 拡張レベル を投影します。 Si
「 Dynamic Scalper System MT5 」インジケーターは、トレンド波の中でスキャルピング取引を行う手法のために設計されています。 主要通貨ペアと金でテスト済みで、他の取引商品との互換性があります。 トレンドに沿った短期的なポジションオープンのシグナルを提供し、追加の価格変動サポートも提供します。 インジケーターの原理 大きな矢印はトレンドの方向を決定します。 トレンド波の中では、小さな矢印の形でスキャルピングシグナルを生成するアルゴリズムが機能します。 赤い矢印は強気方向、青い矢印は弱気方向です。 トレンドの方向には敏感な価格変動ラインが描かれ、小さな矢印のシグナルと連動します。 シグナルは次のように機能します。適切なタイミングでラインが現れるとエントリーシグナルが形成され、ラインが開いている間はポジションが保持され、完了すると取引が終了します。 推奨される動作時間枠はM1~H4です。 矢印は現在のローソク足に形成され、次のローソク足が開いている場合は、前のローソク足の矢印は再描画されません。 入力パラメータ Trend Wave Period - トレ
AriX
Temirlan Kdyrkhan
1 (4)
AriX Indicator for MT5 A powerful trend-following and signal-evaluation tool AriX is a custom MT5 indicator that combines Moving Averages and ATR-based risk/reward logic to generate clear buy/sell signals. It visualizes dynamic SL/TP levels, evaluates past trade outcomes, and displays win/loss statistics in a clean on-chart panel. Key features include: Buy/Sell signals based on MA crossovers ATR-based SL/TP1/TP2/TP3 levels with visual lines and labels Signal outcome tracking with real-time stat
機関投資家の視点で市場を見る:ノイズを減らし、質の高い機会に集中する 複数のチャートを切り替え続けたり、曖昧なシグナルに迷う必要はありません。 OmniView ICT Dashboard は Market Watch 内のすべての銘柄をリアルタイムでスキャンし、より価値の高いトレード機会を特定するのを支援します。 分析をより明確にし、意思決定をより効率的にします。 主な機能 複数銘柄の同時スキャン ICTロジックに基づくトレード機会の検出 各セットアップを 0〜100% でスコアリング ワンクリックでチャート同期 高品質な市場環境に集中できる設計 スコアリングシステム 市場構造、モメンタム、流動性の挙動を基に各機会を評価します: 85% – 100% → 複数要因が強く一致(優先度高) 70% – 84% → 明確な方向性と良好な確認 60% – 69% → 有効だが追加確認が必要 60%未満 → 市場形成段階 質の高い機会を絞り込み、弱いトレードを回避するのに役立ちます。 Smart Money ロジックベース システムは以下の主要な市場構造を自動で識別します:
プレミアムレベルは、正しい予測の精度が80%を超える独自の指標です。 この指標は、最高のトレーディングスペシャリストによって2か月以上テストされています。 あなたが他のどこにも見つけられない作者の指標! スクリーンショットから、このツールの正確さを自分で確認できます。 1は、1キャンドルの有効期限を持つバイナリーオプションの取引に最適です。 2はすべての通貨ペア、株式、商品、暗号通貨で機能します 手順: 赤い矢印が表示されたらすぐにダウントレードを開き、青い矢印が表示されたら閉じます。青い矢印の後に開くこともできます。 試してテストしてください!推奨設定はデフォルトです! 日足チャートで最高の精度を示します! インディケータは、2600 Pipsの収益性に対して、約10Pipsという非常に小さなマージンを使用します。
Stop guessing the market. Start trading mathematical probabilities with Machine Learning. The Titan NPC Pro (Neural Probability Channel) is not just another moving average or standard deviation band. It is a highly advanced institutional-grade indicator powered by a Kernel Regression Engine . By utilizing a Rational Quadratic Kernel function, the algorithm calculates the true "Fair Value" of the asset and plots dynamic probability boundaries to pinpoint exact Mean Reversion (Overbought/Oversold)
SunSignal ML — AI Gold Signals with Multi-Timeframe Confluence SunSignal ML is an advanced AI-powered signal indicator purpose-built for XAUUSD gold trading. It combines a proprietary adaptive trend algorithm with six machine learning models trained on confirmed price pivots to produce high-confidence entry signals with multi-timeframe validation. The indicator runs efficiently on M1, M5 and M15 timeframes and is designed for traders who want precision entries guided by data rather than guesswor
ICT PO3 (Power of 3) AMD Protocol Framework Indicator True Time & Structure Integration   |  Non-Repainting | Real-Time  | Multi-Asset  | MT4 Version Available Full Setup Guide & Strategy Playbook: https://www.mql5.com/en/blogs/post/768683 MT4 Version: https://www.mql5.com/en/market/product/171742 Indicator Overview The ICT PO3 AMD Protocol Framework is a complete structural overlay for MetaTrader 5 that maps the True Daily Cycle directly onto your lower-timeframe execution chart. It projects
Ultimate SMC Indicator
Hicham Mahmoud Almoustafa
1 (1)
Ultimate SMC Indicator v2.20 — Smart Money Concepts All-in-One Stop switching between 5 different indicators. Ultimate SMC gives you everything Smart Money traders need — in one clean indicator with interactive controls. GUIDE What makes this different? Most SMC indicators show you Order Blocks or FVGs separately. You still have to figure out which zones actually matter. Ultimate SMC does the hard work: it scans for Order Blocks, Fair Value Gaps, Liquidity Sweeps, Supply & Demand zones, Fibo
この位置が買いに適しているかどうかの判断をサポートします。 この位置が売りに適しているかどうかの判断をサポートします。 4つの指標が同時に底に達した場合は、反発のチャンスに注目してください。 4つの指標が同時に天井付近にある場合は、下落のチャンスに注目してください。 本システムは、中国の先進的なアルゴリズム技術と高度な数学モデリング体系に基づいて構築されています。 私は主に XAUUSD M5 でこの指標を使用しており、この時間足が最も良い結果を示します。 この指標のアルゴリズムと数式は非常に複雑なため、テスト時に動作が遅くなる場合があります。テストでは、リペイントの有無と遅れの有無を確認してください。正式版では実際の使用時により安定します。 この指標システムはリペイントせず、未来データも使用しません。ご購入前にご自身でテストしてご確認いただけます。 この指標には完全にカスタマイズ可能なアラートシステムが搭載されており、以下のリンクからご確認いただけます。 正式に使用する前に、完全な使用説明を十分にお読みください。 ご不明な点がございましたら、どうぞお早めにご連絡ください。できるだけ早
Ziva LSE System
Hassan Abdullah Hassan Al Balushi
ZIVA LSE System A Professional Liquidity & Structure Execution Framework Executive Overview ZIVA LSE System is a professionally engineered analytical framework designed to interpret market behavior through structural logic and liquidity dynamics. It is not positioned as a conventional indicator. Rather, it functions as a structured execution environment that organizes price action into a clear, disciplined decision-making model. The system is built to deliver consistency, clarity, and controlled
作者のその他のプロダクト
A MetaTrader 4 indicator is a tool used in the MT4 trading platform to help traders analyze price data. It uses mathematical formulas based on price, volume, or time to show patterns or trends on a chart. Indicators can help traders decide when to buy or sell by showing possible entry and exit points. There are many types, such as trend indicators, oscillators, and volume tools. Traders can also create custom indicators to suit their strategies and improve their trading decisions.
Using colors that reflect the prevailing market direction, the indicator is designed to show when the current trend is still dominant. This helps to filter out potential market noise and guides the trader to avoid false signals. By clearly visualizing trend strength and consistency, the tool assists in identifying higher-probability trade setups. It enhances precision by allowing traders to focus on movements that align with the broader market context. As a result, decision-making becomes more
Custom ADX Indicator Based on Open Price Only The standard ADX indicator is usually calculated using the High, Low, and Close prices. This produces a smooth and visually appealing line that represents price action. However, ️ it lacks precision — as the candle moves, the ADX, +DI, and -DI values also change suddenly, potentially triggering false signals based on the candle’s initial plotting. A curious observation: even when the input is modified to use the Open price in the indicator se
Statistical Time-Based Indicator – Directional Candle This indicator analyzes all candles from the past month (30 days) on the current timeframe, identifying at which exact time (hour and minute) bullish or bearish candles occur most frequently. Based on this data, it emits real-time BUY (CALL) or SELL (PUT) signals whenever the behavioral repetition reaches the configured percentage. The statistical logic is based on exact hour and minute . For example, if at 14:15 over the last 30 day
Binary Gap
Teresinha Moraes Correia
A gap is a space on the chart between two consecutive candlesticks where no trading occurred between the close of one candle and the open of the next. In the Forex market, gaps mainly appear at the weekly open, reflecting events or expectations from the weekend. Technically, a gap may indicate an imbalance between supply and demand. Strategies use gaps as signals of possible trend continuation or reversal, offering opportunities for technical analysis based on liquidity and momentum.
` SMS MOMENTUM SR ARROW | Precision in Momentum and Support/Resistance` ` Overview: A Convergence of Momentum and Key Levels` The   SMS MOMENTUM SR ARROW   indicator is a specialized technical tool designed for traders who base their strategies on the critical interplay between momentum shifts and significant support/resistance (S/R) levels. This indicator operates on a clear, two-stage logic: first, it identifies a genuine momentum reversal using a refined oscillator-based calculation; se
インジケーター技術仕様 – Delta Profile for MetaTrader 5 Delta Profile は MetaTrader 5 用に開発されたインジケーターで、指定されたローソク足範囲内の出来高フローを詳細に分析するためのものです。異なる価格レベルにおける正の出来高(上昇に関連)と負の出来高(下降に関連)の不均衡を構造化し、可視化します。その結果、ユーザーは最も多くの取引が集中する価格帯や実際の市場不均衡が形成される領域を明確に把握できます。 以下に、本インジケーターの主要な技術特性と設定パラメータを示します。 基本コンセプト インジケーターは 価格レベル を識別し、それらを正の出来高、負の出来高、および純 Delta(正負の出来高差)に分類します。 各価格レベルは 水平バー としてチャートに表示され、市場の活動ゾーンや不均衡領域を視覚的に確認できます。 ユーザーは 分析対象ローソク足数 、 価格の丸め精度 、 最大表示レベル数 、および 表示スタイル を自由に設定できます。 主要機能 価格レベルのマッピング :設定された精度に基づき価格を丸め、対応するローソク足の
Poc SR Volume
Teresinha Moraes Correia
SR POC VOLUMEインジケーターは、MetaTrader 5向けに設計されており、指定された期間内のローソク足データからコントロールポイント(POC)を識別、集約、可視化する機能を提供します。本インジケーターの目的は、累積取引量とデルタ分布に基づいてサポートおよびレジスタンスゾーンを体系的に特定し、市場における重要な関心領域をトレーダーが理解できるようにすることです。 主な機能 POCの計算 インジケーターは、指定されたバックルック期間内の各ローソク足に対してPOCを計算します。 POCは、ローソク足の高値と安値の中間点として定義されます。 各POCにはデルタ値が関連付けられています。デルタはティックボリュームと方向性のバイアスに基づき、終値が始値より高い場合は正、そうでない場合は負として計算されます。 デルタは買い手と売り手間の方向性の不均衡を強調するためにスケーリングされます。 クラスター形成 POCは、ユーザーが指定した価格比率の許容誤差に基づいてクラスター化されます。 許容誤差は、POC同士がどれだけ近接している場合に同じクラスターとして扱うかを決定します。 各クラスタ
このインジケーターは確率計算を行うことでシグナルを発します。 ユーザーが設定した開始時間と終了時間に基づき、その日のコンテキストを読み取り、データ解析とシグナルの発行を行います。 特定の場面では、ローソク足の上または下にシンボルを表示してシグナルを確認します。これは、シグナル発行時のリアルタイムの変化によって、シグナルがさらに強力になる可能性を意味します。 右上に表示されるテキストシグナルは、現在のローソク足におけるシグナルの強さを示します。シグナルのパーセンテージが高いほど、ローソク足が提案された方向に進む可能性が高くなります。 このインジケーターは短期のタイムフレームで高頻度のシグナルを提供できるだけでなく、長期のタイムフレームでも安定性を維持します。確率計算、リアルタイム確認シンボル、パーセンテージ表示を組み合わせることで、トレーダーは市場のトレンドをより明確に理解し、さまざまな時間軸でより正確な判断を下すことができます。 全体として、このシステムは複数のレベルの参照を提供します。確率分析、視覚的な確認、パーセンテージによる強度表示により、シグ
フィルタ:
レビューなし
レビューに返信