Tabajara Rules II The Best for MT5
- インディケータ
- バージョン: 1.1
- アップデート済み: 12 8月 2025

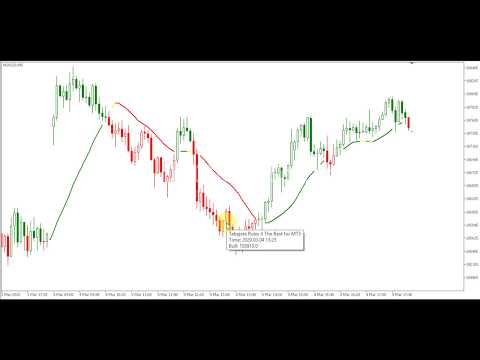
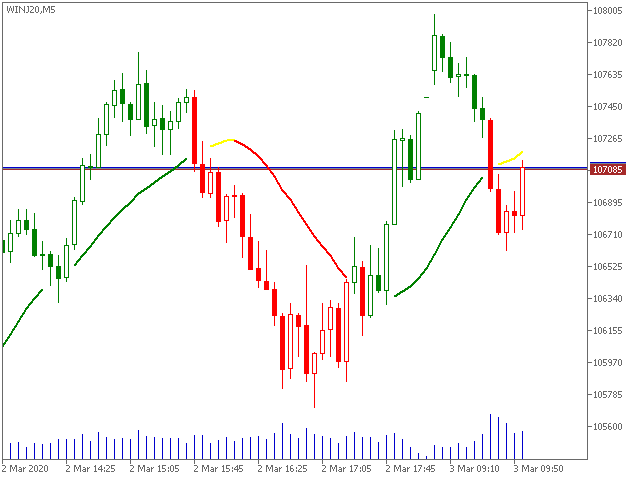
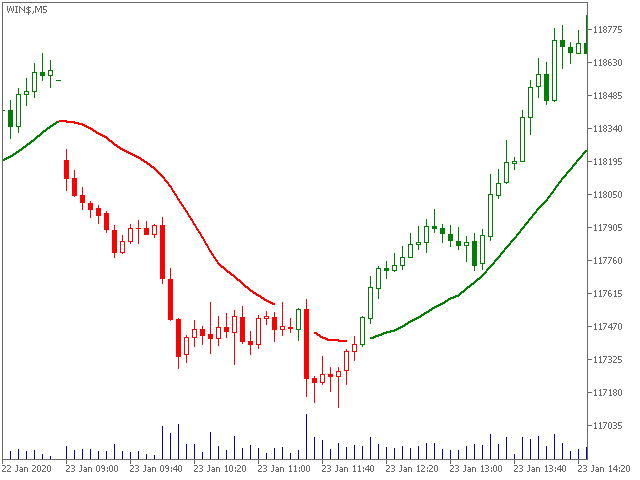
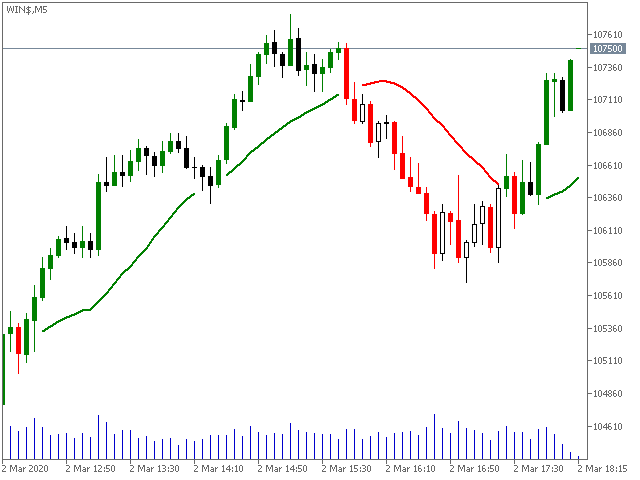
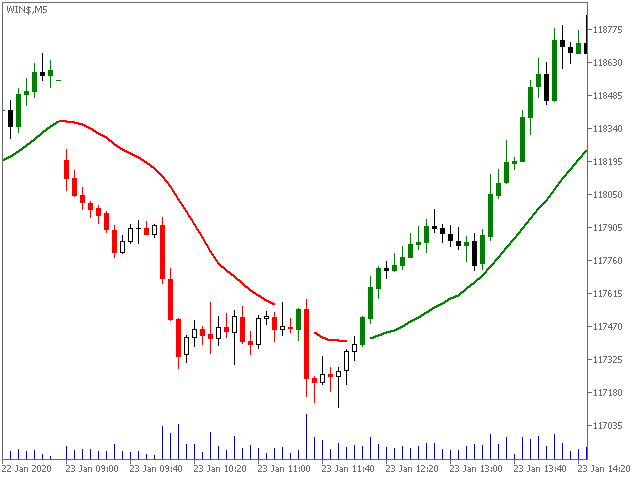
Tabajara Rules for MT5, based on Professor André Machado’s Tabajara Setup, indicates the market direction using moving averages when there are candles aligned with the direction of the moving average.
The indicator contains the color rule applied to the candles and the moving average.
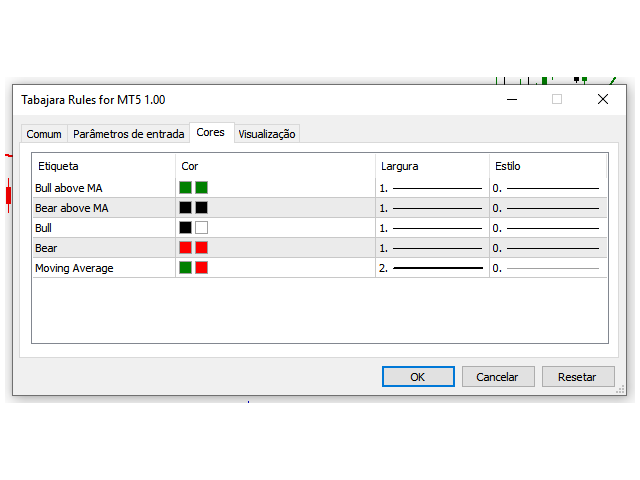
It allows changing the parameters: period and smoothing method of the moving average.
It also allows changing the colors of the candles (borders and filling) and of the moving average.
Professor André Machado’s model includes a 200-period moving average, which is not included in this indicator because no filter is applied to it. However, it can be added separately by anyone interested.


Simples e eficiente. Excelente trabalho, Samuel!