EYeQ Indicator

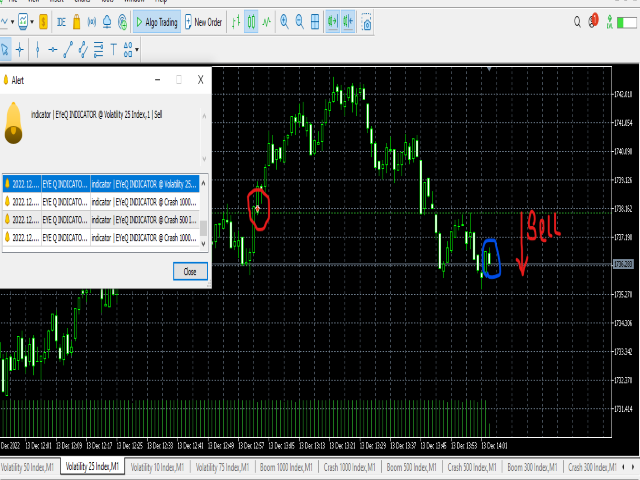
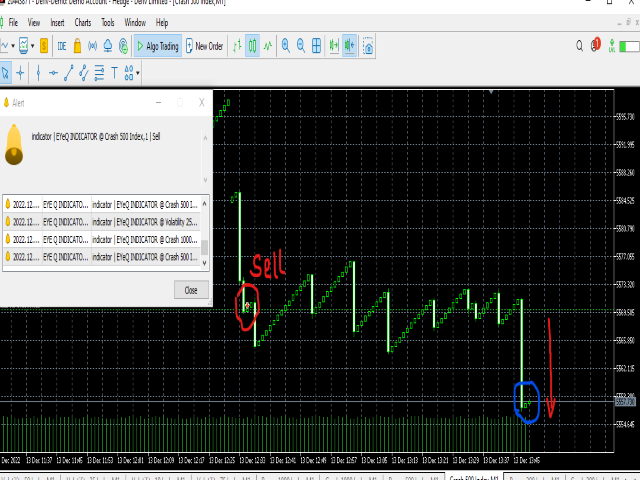
EYeQ インジケーターは、STEP INDEX、VOLATILITY 10、25、50、75 100、BOOM、および CRUSH でエントリーシグナルを提供するための強力なツールです。

BOOMやCRUSH 300、500、1000でのSPIKESをより効果的にキャッチ。

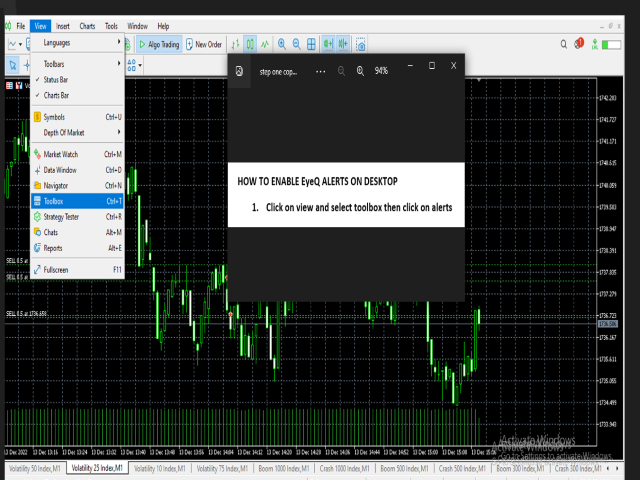
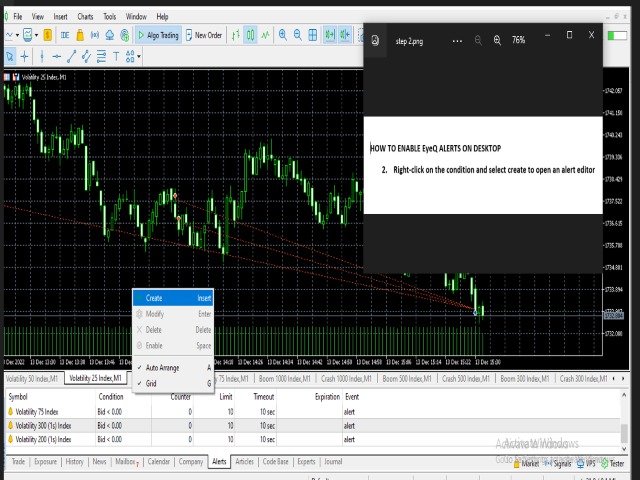
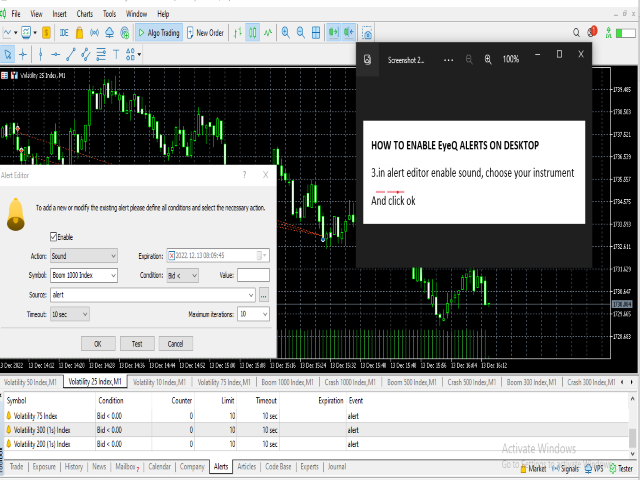
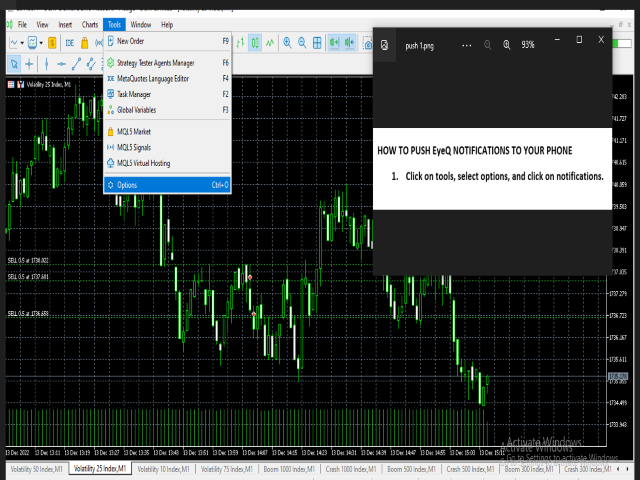
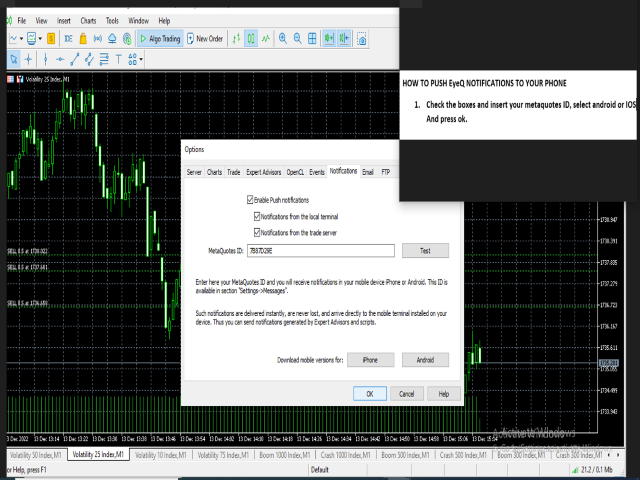
EYeQ インジケーターは、複数の時間枠にわたって市場を分析し、トレンドに基づいて最適なエントリー ポイントを見つけます。デスクトップ アラートをオンにするだけで、シグナルがリリースされたときに通知を受け取ることができます。電話やタブレットなどの他のポータブル デバイスへのプッシュ通知を許可して、そのようなデバイスでのリモート取引のアラートを受け取ります。

N/B: Boom および Crush インデックスでの TRADING TICKS の取引は避けてください。また、指標は終了ポイントを提供しないことに注意してください。MetaTrader プラットフォームの各商品の最小ロット サイズで 3 USD の利益が発生した場合は、終了する必要があります。

例: 最低ロットサイズ;ステップインデックス-0.1


v75-0.001

v50-3

v25-0.5 および残りの楽器にも同じことが適用されます

リアルタイムの信号アラートのために、インジケーターを VPS にインストールすることをお勧めします。そして、常に1分の時間枠チャートにインジケーターをインストールすることを忘れないでください.
おすすめのプロダクト
Product Name: SavasaLaS Tutelage | Pro Price Action Compass Stop guessing. Start trading with Confluence. SavasaLaS Tutelage is not just an indicator; it is a complete trading system designed for the serious Price Action trader. It eliminates chart noise by strictly enforcing the three pillars of institutional trading: Market Structure , Trend Direction , and Candlestick Verification . Unlike standard indicators that flood your chart with weak signals, SavasaLaS Tutelage waits for the "Perfect O
FREE
The new update makes this indicator a complete tool for studying, analyzing and operating probabilistic patterns. It includes: On-chart Multi-asset percentage monitor. Configurable martingales. Twenty-one pre-configured patterns, including Mhi patterns and C3. An advanced pattern editor to store up to 5 custom patterns. Backtest mode to test results with loss reports. Trend filter. Hit operational filter. Martingale Cycles option. Various types of strategies and alerts. Confluence between patter
Impulse fractals indicator - is counter-trend oriented complex market fractal pattern.  Market creates bull/bear impulse, trend starts, fractals on impulsed wave are an agressive pullback signals. Buy arrow is plotted when market is bearish and it's impulse showed up-side fractal, and sell arrow is plotted when market is bullish and it's impulse showed dn-side fractal. Main indicator's adjustable inputs : impulsePeriod - main period of impulse histogram  filterPeriod  - smoothes impulse accordi
概要 外国為替や金融市場では、迅速な反応と正確な意思決定が非常に重要です。しかし、標準のMetaTrader 5端末は最小でも1分のチャートしかサポートしておらず、トレーダーが市場の変動に敏感であることを制限しています。この問題を解決するために、 秒単位チャートキャンドルインジケーター を導入しました。このインジケーターを使用すれば、1秒から30秒の市場の動向をサブチャートで簡単に表示・分析できます。 主な機能 複数の秒単位タイムフレームのサポート :このインジケーターは、以下のタイムフレームを選択でき、さまざまな取引戦略に対応します: S1 : 1秒 S2 : 2秒 S3 : 3秒 S4 : 4秒 S5 : 5秒 S10 : 10秒 S15 : 15秒 S20 : 20秒 S30 : 30秒 リアルタイム更新 :秒単位チャートはリアルタイムで更新され、各瞬間に最新の市場情報を提供します。これにより、迅速な取引判断が可能になります。 ユーザーフレンドリーなインターフェース :インジケーターはサブチャートに表示され、直感的で使いやすいです。異なるタイムフレームに素早く切り替えて市場を迅速
Insight Investor: Advanced Multi-Currency Forex Trading Bot Introduction In the fast-paced world of Forex trading, having the right tools can significantly enhance your trading experience. Insight Investor is an advanced multi-currency trading bot designed to automate and optimize your trading operations. This expert advisor employs modern algorithms to analyze market conditions and execute trades, aiming to deliver consistent results while maintaining controlled risk levels. Key Features of Ins
Limitless MT5 is a universal indicator suitable for every beginner and experienced trader. works on all currency pairs, cryptocurrencies, raw stocks Limitless MT5 - already configured and does not require additional configuration And now the main thing Why Limitless MT5? 1 complete lack of redrawing 2 two years of testing by the best specialists in trading 3 the accuracy of correct signals exceeds 80% 4 performed well in trading during news releases Trading rules 1 buy signal - the ap
Our BOOM SELL ALERT indicator is specifically engineered to   take candles on BOOM 1000 , BOOM 500 is tool is optimized for M1 (1-minute) timeframe, ensuring you receive timely and actionable insights.   The indicator is a combination of   many indicators. -        AO Oscillator -        Stochastic   HOW TO USE THIS INDICATOR To use well this indicator , it   need to use SCHAFF TREND RSX ( 5 MIN OR M5) IF SCHAFF trend RSX is GREEN and you have a signal then SELL when you have ENTRY and out with
このインジケーターは実践的なトレードに最適な自動波動分析のインジケーターです! 場合... 注:   Tang Lun (Tang Zhong Shuo Zen) の命名規則の影響で、私は波のグレーディングに西洋の名前を使用することに慣れていません。基本的な波を ペン 、二次波のバンドを セグメント と名付けました。同時に、 セグメント にはトレンドの方向が指定されます (この命名方法は将来のノートで使用されます。最初に言っておきます)。ただし、アルゴリズムは曲がりくねった理論とはほとんど関係がないため、付けるべきではありません。これは、私の市場分析 によって要約された、絶えず変化する複雑な運用ルール を反映しています。 バンドは標準化され、人によって異なることがないよう定義されており、市場参入を厳密に分析する上で重要な役割を果たす人為的な干渉の描画方法が排除されています。 このインジケーターを使用することは、取引インターフェイスの美しさを改善することと同等であり、元の K ライン取引を放棄し、取引の新しいレベルに連れて行きます。また、宣伝の観点から顧客の認識も向上します。 イ
Manyal trading system, CovEchoTrend Robot, focuses on reliability and flexibility. By employing statistical analysis methods to study the relationships between the base indicator and market patterns, the system enables a deeper understanding of market processes. Intelligent pattern analysis: The application of statistical data processing helps identify key trend reversal points more accurately, signaling significant market shifts. Informed decision-making is based on the intersection of indicato
The BeeKeeper EA – Intelligent Market Scalper with Dynamic Trade Logic Overview BeeKeeper  is a next-generation automated trading system designed for precision, adaptability, and consistent performance across multiple market conditions. BeeKeeper integrates advanced technical logic with real-time position analysis to make smart entry and exit decisions — dynamically adapting to volatility, trend shifts, and recovery phases. Whether you’re a short-term scalper or mid-term trend rider, Met
Automate Gann's Market Geometry: The Ultimate MT5 Indicator for Predicting Price Cycles & Key Levels Stop guessing and start knowing. The indicator does the complex math for you, transforming W.D. Gann's profound theories into clear, actionable trading signals on your chart. Are you struggling to... Manually calculate pivotal support and resistance levels? Identify high-probability reversal zones in a chaotic market? Understand how to apply Gann's concepts to modern trading? Keep track of your a
Introduction to Fractal Pattern Scanner Fractal Indicator refers to the technical indicator that makes use of the fractal geometry found in the financial market. Fractal Pattern Scanner is the advanced Fractal Indicator that brings the latest trading technology after the extensive research and development work in the fractal geometry in the financial market. The most important feature in Fractal Pattern Scanner is the ability to measure the turning point probability as well as the trend probabil
Hello There, Today I want to show you my new researchable fore BUY SELL indicator, it work all asset, and also work Derive Volatility asset! it work all time frame, but i recommend start 5 minute to H1 when you receive a signal just take trade and stay wait for your take profit asset All Major Pair And minor IT WORK ALSO XAUUSD Fantastic results,  for more info,,, message us thank you   
[ MT4 Version ]  [ Kill Zones ]  [ SMT Divergences ] How to trade using Order Blocks:  Click here User Interface Performance:  During testing in the strategy tester, the UI may experience lag. Rest assured, this issue is specific to the testing environment and does not affect the indicator's performance in live trading. Elevate your trading strategy with the  Order Blocks ICT Multi TF  indicator, a cutting-edge tool designed to enhance your trading decisions through advanced order block analysis
Range Directional Force Indicator – Designed for You to Optimize! The Range Directional Force Indicator is a cutting-edge tool designed to empower traders by visualizing market dynamics and directional strength. Built to offer insights into market trends and reversals, this indicator is an invaluable asset for traders seeking precision in their strategies. However, it is important to note that this indicator is not optimized, leaving room for you to tailor it to your unique trading preferences.
Introduction This indicator detects volume spread patterns for buy and sell opportunity. The patterns include demand and supply patterns. You might use each pattern for trading. However, these patterns are best used to detect the demand zone (=accumulation area) and supply zone (=distribution area). Demand pattern indicates generally potential buying opportunity. Supply pattern indicates generally potential selling opportunity. These are the underlying patterns rather than direct price action. T
CRT Bomb Indicator - MT5 Full Version The CRT Bomb is a professional trading indicator that detects high-probability 3-candle reversal patterns (CRT - Candle Reversal Technique) across all timeframes and symbols.   VPS is recomended so that you dont miss any CRT setups as they form , for entries you can use your manual analysis for confirmation like FVG, OBS etc Works on all Pairs ,Metals & Indices Key Features: Identifies impulse-trap-reversal candle structures Provides visual arrows and patter
Ce super EA utilise une intelligence Artificiel spécifiques à l’or le plus récent,  le plus avancé avec une précision inégalée pour identifier les points d’achat et de vente. Il représente une avancée révolutionnaire dans le trading d’or sur le marché Forex. Mélangé à quelques indicateurs, d’un filtre, d’une couverture de grille, Après analyse, il élimine les fausses signaux et détecte de super entré.   L’EA utilise un stop suiveurs adaptatif.
MarketMagnet
Kelly Adediran Raymond
Are you ready to take your trading journey to new heights? Look no further than MarketMagnet, this groundbreaking indicator designed to propel your trading success with excitement and accuracy. Powered by the convergence of Momentum and CCI (Commodity Channel Index), MarketMagnet equips traders with the ultimate tool to determine direction and entry prices for a wide range of recommended currency pairs and instruments. It is designed for traders seeking to scalp for a few pips on lower timeframe
CISD Levels Pro automatically draws CISD Buy and Sell levels directly on your chart. It highlights pending levels while they are forming, then marks confirmed levels after the confirmation candle closes. Optional confirmation arrows help you spot the signal quickly. This tool is designed for traders who want clean, simple CISD level visualization without extra indicators or clutter. Key Features Draws Bullish (BUY) CISD levels and Bearish (SELL) CISD levels Shows Pending levels (dashed) and
Oneiroi
Oleksandr Powchan
5 (1)
Oneiroi trades hard oversold and overbought conditions. On M15 you can achieve a very high hitrate. The system does not trade a lot because meeting the three conditions is quite hard. It will work on any pair and any broker but some are better than others. The EA will work also on small accounts but i would highly recomend to use a 100kcent account. Our Goal is to help you be way more profitable and way more stress free, so you can enjoy the things that are important to you and your family.
All 11 indicators quickly turn off and turn on quickly! Set of indicators: 2 indicators "TREND"   : - fast = line 4 colors - slow = dots 4 colors The coloring of the indicators depends on the direction of the trend and the RSI indicator: 1) uptrend and RSI<50% 2) uptrend and RSI>50% 3) downtrend RSI<50% 4) downtrend RSI   >   50% Set indicator periods for each timeframe: M5 M10 M15 M30 H1 H2 H4 H6 H12 D1 W1 MN Do not enter trades if at least 1 of the indicators is horizontal. For a trade,
Disclaimer : Keep in mind that seasonal patterns are not always reliable. Therefore, thoughtful risk management is crucial to minimize losses.  Seasonal patterns in the financial world are like a well-guarded secret that successful investors use to their advantage. These patterns are recurring price movements that occur during specific periods or around special events. Additionally, there are also intraday patterns that repeat. For example, Uncle Ted from Forex Family suggests examining previou
The implementation of the Trend Turn trend indicator is simple - in the form of lines of two colors. The indicator algorithm is based on standard indicators as well as its own mathematical calculations. The indicator will help users determine the direction of the trend. It will also become an indispensable advisor for entering the market or closing a position. This indicator is recommended for everyone, both beginners and professionals. How to interpret information from the indicator. We sell
Institutional Levels is an intelligent, fully automated Expert Advisor. This algo is arranged in such a way that the EA uses levels of importance combined with price action, without reliance on indicators. The strategy behind it is based on the teachings of a professional traders, and ex traders. It will find untested levels at which institutions are known to be interested in, in the number of candles you’ve set and will make trades based on these levels, re-test and trend. It will automaticall
The Urgently indicator is designed to quickly determine the situation in the market, reflect the state of the market and signal profitable levels for opening trades. Market conditions change quickly enough, requiring constant calibration of trading strategies. Recommended for use in conjunction with any of the oscillators. The Urgently forex market trend indicator shows the trend direction and entry points. It smooths out price fluctuations when generating a signal by averaging the data and the
The Second-Level Tick Candlestick Generator is a professional-grade MT5 indicator tool specifically designed for high-frequency trading and short-term scalping. It can convert raw tick data into highly customizable second-level candlestick charts in real-time, helping traders accurately capture micro-market fluctuations and optimize entry and exit timing. This tool provides clear chart displays, allowing you to more intuitively identify price action patterns and improve trading decision efficien
Entry and exit signals from the Double 7's Strategy by Larry Connors in his book "Short Term Trading Strategies That Work". Larry claims this strategy predicted the market's direction over 80% of the time since 1995. Picking up the gains and being exposed in the market less than 25% of the time. Good for swing trading on Daily charts of SPY, Nasdaq, China's FXI, Brazil's EWZ and the majority of the equity ETFs and World Indices. How does it work? The indicator activates the buy signal when we
Tabajara Rules for MT5 , based on Professor André Machado’s Tabajara Setup, indicates the market direction using moving averages when there are candles aligned with the direction of the moving average. The indicator contains the color rule applied to the candles and the moving average. It allows changing the parameters: period and smoothing method of the moving average. It also allows changing the colors of the candles (borders and filling) and of the moving average. Professor André Machado’s
FREE
このプロダクトを購入した人は以下も購入しています
ARIPoint
Temirlan Kdyrkhan
1 (1)
ARIPoint is a powerful trading companion designed to generate high-probability entry signals with dynamic TP/SL/DP levels based on volatility. Built-in performance tracking shows win/loss stats, PP1/PP2 hits, and success rates all updated live. Key Features: Buy/Sell signals with adaptive volatility bands Real-time TP/SL/DP levels based on ATR Built-in MA Filter with optional ATR/StdDev volatility Performance stats panel (Success, Profit/Loss, PP1/PP2) Alerts via popup, sound, push, or email Cu
+++++++++++++++++++++++++++++++++++++++++++++++++++++++++++++++++++++++++++++++++++++++++++++++++ +++ Link to EURUSD Only Free Version -->  https://www.mql5.com/en/market/product/156904?source=Unknown +++++++++++++++++++++++++++++++++++++++++++++++++++++++++++++++++++++++++++++++++++++++++++++++++ Hallo Trader, This is a traditional GANN & FIBONACCI strategy based on detection of an impulsive move in the opposite direction. This is called a Breakout. At the moment of Breakout, the indicator draw
note: this indicator is for METATRADER4, if you want the version for METATRADER5 this is the link:  https://www.mql5.com/it/market/product/108106 TRENDMAESTRO ver 2.5 TRENDMAESTRO recognizes a new TREND from the start, he never makes mistakes. The certainty of identifying a new TREND is priceless. DESCRIPTION TRENDMAESTRO identifies a new TREND in the bud, this indicator examines the volatility, volumes and momentum to identify the moment in which there is an explosion of one or more of these da
無料の AUX インジケーターと EA サポ   直接ダウンロード — ここをクリック [ D.I.C.E ] The DICE Indicator Divergence in Chaos Environment は、エリオット波動理論とトレーディングカオス手法を組み合わせて使用するトレーダーのために設計された MT5 専用ツールです。価格変動の中の隠れたおよび通常のダイバージェンスを検出し、ビル・ウィリアムズが説明したカオス市場環境と同期します。 主な特徴 エリオット波動に対応したダイバージェンス検出:波動構造と調和した強気・弱気ダイバージェンスを識別。 カオス手法の統合:AO(オーサムオシレーター)と市場構造に整合。 マルチタイムフレームスキャン:異なる時間枠でダイバージェンスを分析し、トレンドの転換を確認。 視覚的アラートとオブジェクト:チャート上の矢印、ライン、マーカーで即座に識別。 市場適応読解:カオス的状況に自動適応し、ノイズを除去して有効なセットアップを維持。 ブレイクプルバックエントリー手法:シンプルなフィボナッチリトレースメントとピボットポイントを使用。 利点 ダイ
FRONTIER PIVOTS - Geometric Levels Indicator This indicator plots support and resistance levels/ranges on the chart using mathematical calculations. It helps traders identify potential price reaction zones based on geometric patterns. Main Features: Automatically calculates and displays key price levels Plots both support and resistance lines Uses daily price data for level calculation Clean visual presentation with different colors for different level types No repainting - levels remain static
「 Dynamic Scalper System MT5 」インジケーターは、トレンド波の中でスキャルピング取引を行う手法のために設計されています。 主要通貨ペアと金でテスト済みで、他の取引商品との互換性があります。 トレンドに沿った短期的なポジションオープンのシグナルを提供し、追加の価格変動サポートも提供します。 インジケーターの原理 大きな矢印はトレンドの方向を決定します。 トレンド波の中では、小さな矢印の形でスキャルピングシグナルを生成するアルゴリズムが機能します。 赤い矢印は強気方向、青い矢印は弱気方向です。 トレンドの方向には敏感な価格変動ラインが描かれ、小さな矢印のシグナルと連動します。 シグナルは次のように機能します。適切なタイミングでラインが現れるとエントリーシグナルが形成され、ラインが開いている間はポジションが保持され、完了すると取引が終了します。 推奨される動作時間枠はM1~H4です。 矢印は現在のローソク足に形成され、次のローソク足が開いている場合は、前のローソク足の矢印は再描画されません。 入力パラメータ Trend Wave Period - トレ
Hello I Want to introduce The Forex Buy Sell Arrow Premium MT5 i recently release this premium indicator! its 1000% Non Repaint Indicator, It Work Perfectly Well,, i tested it day by day, Just mind blowing Result,  Including Powerful trend Algorithm! How It Work? well, it work market trend formula, when trend Bullish Or when trend Bearish,  Recommend Timeframe M30, H1 it work all timeframe, and all currency pair, 100% non repaint, How to take signal From Forex Buy Sell Arrow Premium Ind
Big Player Range
Thalles Nascimento De Carvalho
5 (3)
BigPlayerRange — MT5向け最強インジケーター BigPlayerRange は、MetaTrader 5 で日経ミニやドル先物などの取引において、 最も効果的なインジケーター と評価されています。大口投資家(機関投資家)の行動を可視化し、高精度なテクニカル分析を可能にします。 どのように機能するのか? BigPlayerRangeは、買い圧力ゾーン(緑ライン)と売り圧力ゾーン(赤ライン)を描画し、価格がその範囲を超えるとトレンド方向への動きを示唆します。 緑のライン上で終値: 買いの勢いが強く、上昇トレンドの可能性。 赤のライン下で終値: 売り圧力が優勢で、下落が予想される。 範囲内での価格: レンジ相場でブレイクを待つ段階。 主なメリット: 機関投資家ゾーンの検出: 大口のエントリーポイントを視覚化。 自動ターゲット計算: 利確ポイントを戦略的に設定。 プルバックの可能性分析: リスク管理に役立つ情報提供。 推奨の使い方: Imbalance DOM Pro と併用してゾーンブレイクを確認。 SwingVolum
##   ONLY GOLD ##   Тiльки Золото ## **Mercaria Professional Trading Zones - Complete Guide** ## **Mercaria Professional Trading Zones - Повний посібник** ### **How Mercaria Zones Work / Як працюють зони Mercaria** **English:** Mercaria Zones is an advanced trading indicator that identifies high-probability support and resistance areas using ZigZag extremes combined with mathematical zone calculations. The indicator works on multiple timeframes simultaneously, providing a comprehensive view
インジケーターは任意のポイントから出来高を分析し、その出来高に対する市場のエグゾースト(疲労)レベルを計算します。 Meravith の主なライン: 強気出来高エグゾーストライン – 目標として機能します。 弱気出来高エグゾーストライン – 目標として機能します。 トレンドライン – 市場のトレンドを示します。市場が強気か弱気かに応じて色が変化し、トレンドサポートとして機能します。 使い方: 紫色の縦線をダブルクリックし、希望の位置に移動してください。 トレンドや調整など、あらゆるものを分析できます。インジケーターを市場の上部、下部、または重要と考える任意のポイントに移動します。良い方法は、市場がエグゾーストラインの間に位置するように Meravith を設定することです。こうすることで、追跡できる明確な目標を持つことができます。 初期のエグゾーストラインがブレイクされた場合、新しいエグゾーストラインが出現し、追加の取引可能なチャネルが形成されます。 エグゾーストに到達した後は、インジケーターの位置を変更するか、別の時間枠に切り替えて新しいエグゾーストレベルを特定できます。 トレンドラ
A tool for on-chart strategy backtesting and performance analysis. A utility for developing, debugging, and testing custom trading ideas and indicator functions. An indicator designed to quickly test trading concepts and visualize the effectiveness of different input parameters. An all-in-one sandbox for testing everything from simple crossovers to complex, multi-condition trading systems.
VTrende Pro
Andrii Diachenko
5 (1)
VTrende Pro - MTF indicator for trend trading with a display panel for MT5 *** Videos can be translated into any language using subtitles (video language - Russian) Although the signals of the VTrende Pro indicator can be used as signals of a full-fledged trading system, it is recommended to use them in conjunction with the Bill Williams TS. VTrende Pro is an extended version of the VTrende indicator. Difference between Pro version and VTrende: - Time zones - Signal V - signal 1-2 waves -    S
Enigma 112 Indicator - User Manual Enigma 112 Indicator Complete User Manual - Ultimate Trading Solution Introduction The Enigma 112 is a comprehensive multi-timeframe trading indicator that combines advanced technical analysis concepts including Tesla 3-6-9 Gates, Huddleston Theory, PO3 Dealing Ranges, and sophisticated risk management systems. Tesla 3-6-9 Gates Based on Nikola Tesla's vortex mathematics for precise support and resistance levels Huddleston Theory Volume-based market
The Expert Advisor and the video are attached in the Discussion tab . The robot applies only one order and strictly follows the signals to evaluate the indicator efficiency. Pan PrizMA CD Phase is an option based on the Pan PrizMA indicator. Details (in Russian). Averaging by a quadric-quartic polynomial increases the smoothness of lines, adds momentum and rhythm. Extrapolation by the sinusoid function near a constant allows adjusting the delay or lead of signals. The value of the phase - wave s
Классификатор силы тренда. Показания на истории не меняет. Изменяется классификация только незакрытого бара. По идее подобен полной системе ASCTrend, сигнальный модуль которой, точнее его аппроксимация в несколько "урезанном" виде, есть в свободном доступе, а также в терминале как сигнальный индикатор SilverTrend . Точной копией системы ASCTrend не является. Работает на всех инструментах и всех временных диапазонах. Индикатор использует несколько некоррелируемых между собой алгоритмов для класси
FFx Universal Strength Meter PRO is more than a basic strength meter. Instead of limiting the calculation to price, it can be based on any of the 19 integrated strength modes + 9 timeframes. With the FFx USM, you are able to define any period for any combination of timeframes. For example, you can set the dashboard for the last 10 candles for M15-H1-H4… Full flexibility! Very easy to interpret... It gives a great idea about which currency is weak and which is strong, so you can find the best pai
The FFx Universal MTF alerter shows on a single chart all the timeframes (M1 to Monthly) with their own status for the chosen indicator. 9 indicators mode (MACD-RSI-Stochastic-MA-ADX-Ichimoku-Candles-CCI-PSAR). Each can be applied multiple times on the same chart with different settings. Very easy to interpret. Confirm your BUY entries when most of the timeframes are showing green color. And confirm your SELL entries when most of the timeframes are showing red color. 2 Alert Options : input to s
The FFx Watcher PRO is a dashboard displaying on a single chart the current direction of up to 15 standard indicators and up to 21 timeframes. It has 2 different modes: Watcher mode: Multi Indicators User is able to select up to 15 indicators to be displayed User is able to select up to 21 timeframes to be displayed Watcher mode: Multi Pairs User is able to select any number of pairs/symbols User is able to select up to 21 timeframes to be displayed This mode uses one of the standard indicators
FFx Patterns Alerter gives trade suggestions with Entry, Target 1, Target 2 and StopLoss .... for any of the selected patterns (PinBar, Engulfing, InsideBar, OutsideBar) Below are the different options available: Multiple instances can be applied on the same chart to monitor different patterns Entry suggestion - pips to be added over the break for the entry 3 different options to calculate the SL - by pips, by ATR multiplier or at the pattern High/Low 3 different options to calculate the 2 TPs -
MetaTrader 4 version available here : https://www.mql5.com/en/market/product/24881 FFx Basket Scanner is a global tool scanning all pairs and all timeframes over up to five indicators among the 16 available. You will clearly see which currencies to avoid trading and which ones to focus on. Once a currency goes into an extreme zone (e.g. 20/80%), you can trade the whole basket with great confidence. Another way to use it is to look at two currencies (weak vs strong) to find the best single pairs
MetaTrader 4 version available here: https://www.mql5.com/en/market/product/25793 FFx Pivot SR Suite PRO is a complete suite for support and resistance levels. Support and Resistance are the most used levels in all kinds of trading. Can be used to find reversal trend, to set targets and stop, etc. The indicator is fully flexible directly from the chart 4 periods to choose for the calculation: 4Hours, Daily, Weekly and Monthly 4 formulas to choose for the calculation: Classic, Camarilla, Fibonac
プレミアムレベルは、正しい予測の精度が80%を超える独自の指標です。 この指標は、最高のトレーディングスペシャリストによって2か月以上テストされています。 あなたが他のどこにも見つけられない作者の指標! スクリーンショットから、このツールの正確さを自分で確認できます。 1は、1キャンドルの有効期限を持つバイナリーオプションの取引に最適です。 2はすべての通貨ペア、株式、商品、暗号通貨で機能します 手順: 赤い矢印が表示されたらすぐにダウントレードを開き、青い矢印が表示されたら閉じます。青い矢印の後に開くこともできます。 試してテストしてください!推奨設定はデフォルトです! 日足チャートで最高の精度を示します! インディケータは、2600 Pipsの収益性に対して、約10Pipsという非常に小さなマージンを使用します。
Indicador en base a la pendiente de la linea de precio, dibuja una línea de color cuando sube a base de los precios que previamente has sido procesados o linealizados, y cuando baja la pendiente la linea linealizada toma otro color. En este caso se a considerado 6 lineas de diferentes procesos desde pendientes largas hacia las cortas, observándose que cuando coincidan las pendientes se produce un máximo o mínimo, lo que a simple vista nos permitirá hacer una COMPRA O VENTA.
A scalping indicator based on mathematical patterns, which on average gives signals with relatively small SL, and also occasionally helps to catch big moves in the markets (more information in the video) This indicator has three main types of notifications: The first type warns of a possible/upcoming signal on the next bar The second type indicates the presence of a ready signal to enter the market/open a position The third type is for SL and TP levels - you will be notified every time price re
Индикатор Coefficient Of Determination (COD) представляет собой значение коэффициента детерминации или квадрат коэффициента корреляции между зависимой переменной — ценой и объясняющей переменной — тиковым объемом. Что это дает нам на практике? COD отлично распознает кульминацию трендовых движений, что позволяет подбирать оптимальные точки и ловить развороты рынка. Как использовать индикатор: Наиболее популярная торговая стратегия строится совместно с трендовым индикатором Moving Average (MA), пе
Fibonacci Múltiple 12, utiliza la serie fibonacci plasmado en el indicador fibonacci, aumentadolo 12 veces según su secuencia. El indicador fibonacci normalmente muestra una vez, el presente indicador se mostrara 12 veces empezando el numero que le indique siguiendo la secuencia. Se puede utilizar para ver la tendencia en periodos cortos y largos, de minutos a meses, solo aumentado el numero MULTIPLICA.
Recommended TimeFrame >= H1. 100% Non Repainted at any moment.  Use it carefully, only with Trend Direction. Trading Usage: 2 Variants: as Range System or as BreakOut System (Both Only With Trend Direction)::: (Always use StopLoss for minimise Risk); [1] as Range System: (Recommended) in UP TREND:  - BUY in Blue Line , then if price goes down by 50 points (on H1) open Second BUY.   Close in any Profit you wish: TrailingStop(45 points) or Close when Price touches upper Gold Line. in DOWN TREND
En base a cálculos matemáticos de determino una linea Horizontal que cruza a todas las señales de trading, mostrando los máximos y mínimos. La linea horizontal parte en dos las subidas y bajadas de las señales de trading, de tan manera que es fácil identificar los máximos y mínimos, y es inteligente por que es sensible a las subidas y bajadas, afín de no quedarse en un solo lado por siempre, trabaja excelentemente con otros indicadores suavizadores ya que les garantiza que en un intervalo de tie
this indicator is a Spike detector indicator, it is specially designed to trade Boom 1000, Boom 500, Crash 1000 and Crash 500 We recommend using it on Deriv Boom and Crash indices only Its setting is intuitive, familiar, easy to use it has notification functions; audible notifications and push notifications. this tool is simple to use, easy to handle This update is based on different strategies for spikes
インジケーターは、各チャート時間の6つの信号に基づいて、同じ資産の5つの異なるチャート時間のトレンドを追跡します。 指標の主な目的は、それが置かれた金融資産の大多数の傾向を示すことです。 システムは数回のグラフィカルな時間で傾向の情報を送信します。これにより、ユーザーは資産の動きの広い視野を持つことができます。このタイプのツールは、オペレーターが注文を実行するのを支援することで、ユーザーのヒット率を高めます トレンドを支持して。 Injikētā wa, kaku chāto jikan no muttsu no shingō nimotozuite, onaji shisan no itsutsu no kotonaru chāto jikan no torendo o tsuiseki shimasu. Shihyō no omona mokuteki wa, sore ga oka reta kin'yū shisan no dai tasū no keikō o shimesu kotodesu. Shisutemu wa sū-kai no gurafikaruna ji
作者のその他のプロダクト
El indicador utiliza múltiples marcos de tiempo para analizar las mejores entradas de compra en el auge 1000. Está diseñado para ayudar a operar únicamente en picos de auge. el indicador tiene dos flechas; los rojos y azules. la formación de la flecha roja indica que debe estar preparado para una flecha azul que es una señal de entrada de compra. el indicador no ofrece puntos de salida. siempre recopile 3 pips, es decir, si ingresó a una operación a 10230,200, puede salir a 10260,200 con SL a 1
FREE
フィルタ:
レビューなし
レビューに返信