SwingVolumePro

🎯 概要

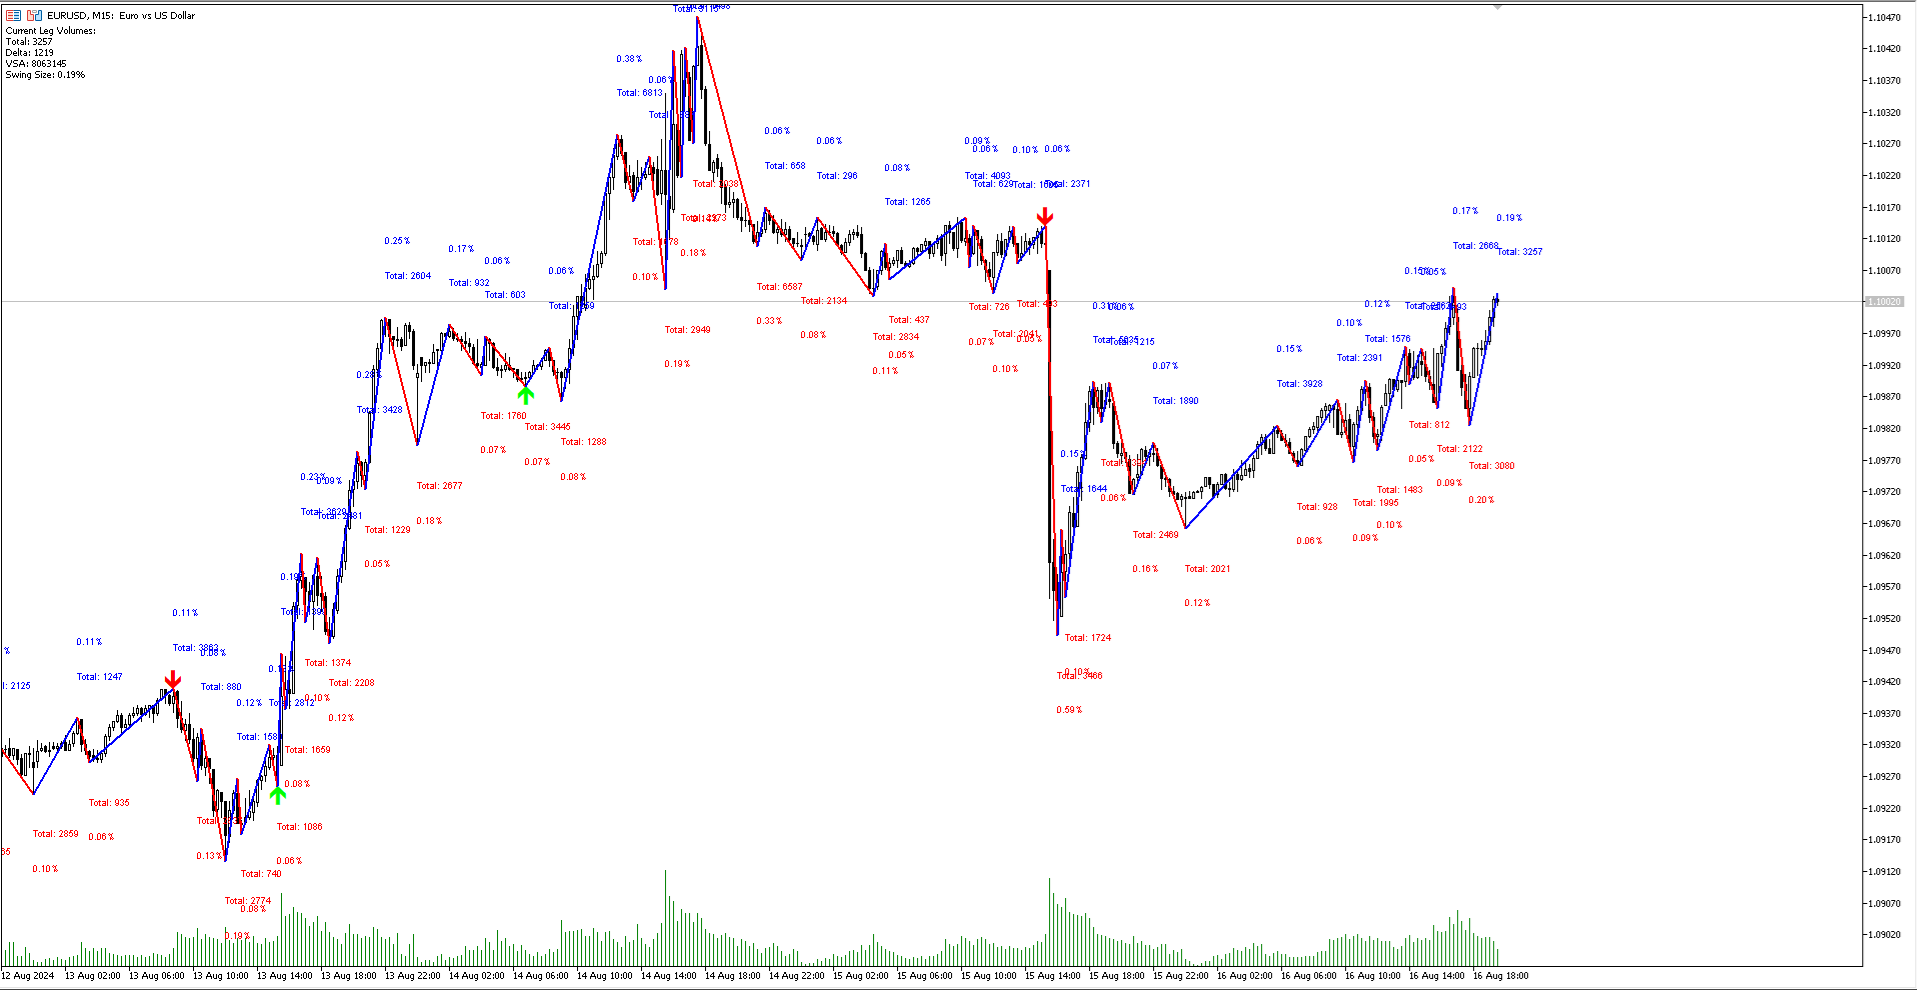
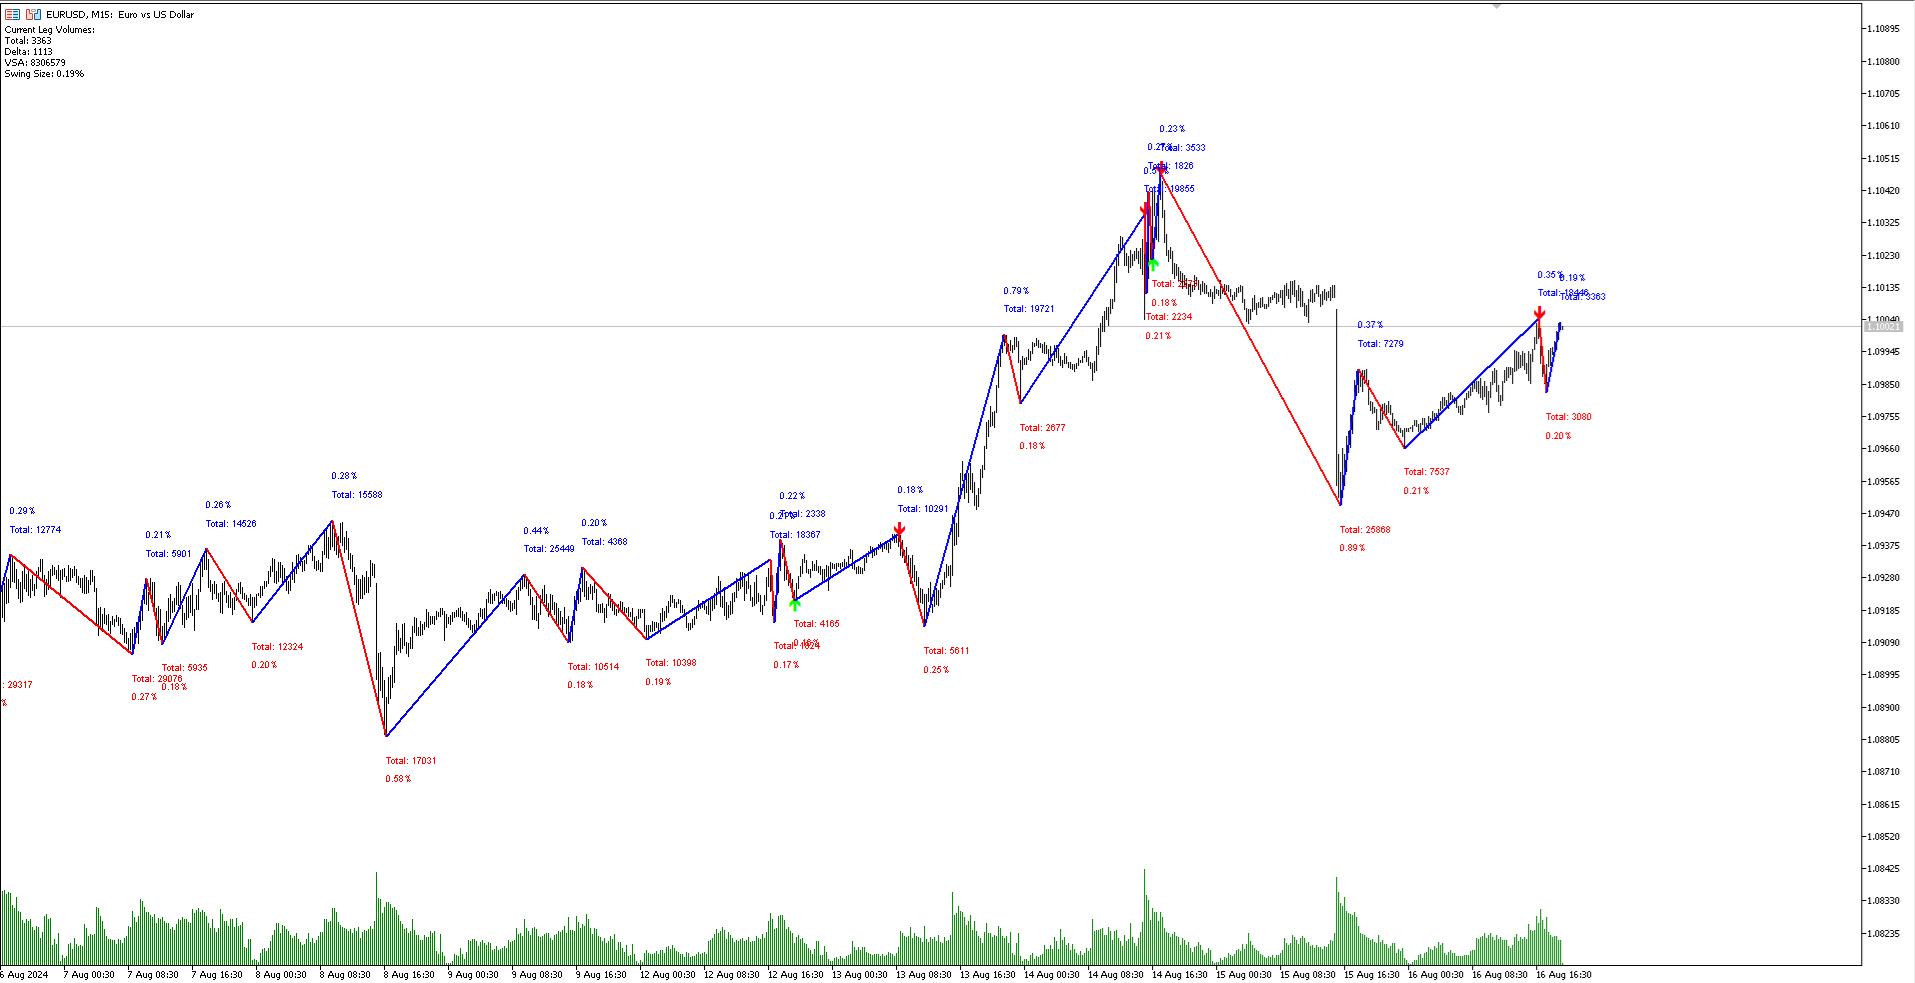
SwingVolumePro は、幅広い金融資産に適用できる高度で多用途なインジケーターであり、さまざまな取引スタイルをサポートします。厳密なボリュームと価格の分析に基づいて開発されており、すべてのレベルのトレーダーが高品質のデータに基づいて情報に基づいた意思決定を行うための明確で正確なシグナルを提供します。


SwingVolumePro.PDF


🔑 主な特徴

  • 🌍 多用途性: SwingVolumePro は、株式、外為(フォレックス)、暗号通貨など、さまざまな資産に適用できます。スキャルピングから長期ポジションまで、さまざまな取引戦略に対応しています。

  • 🎯 正確で信頼できるシグナル: 高精度なシグナルを提供することに重点を置いているSwingVolumeProは、価格吸収パターンや市場のアグレッションを特定するために高度な技術を使用しています。これらのシグナルは明確に表示され、迅速かつ効果的な意思決定が容易になります。

  • 📊 高度なボリュームと価格の分析: インジケーターは、ボリュームと価格の相互作用の詳細な分析を使用して、努力と結果の間にズレがある状況を検出し、市場の潜在的な動きを示唆します。

  • 🧩 解釈の容易さ: 直感的で使いやすいインターフェースを備えたSwingVolumeProは、経験の少ないトレーダーでも理解しやすいシグナルを生成します。努力と結果の関係を示すための矢印の使用により、情報の読み取りがさらに簡単になります。

🤖 EA(エキスパートアドバイザー)との互換性

SwingVolumeProは、エキスパートアドバイザー(EAs)の構築に対応する技術的サポートを提供し、取引戦略の自動化を容易にします。次のバッファーがEAで使用できます:

  1. バッファー 0: UpArrow (上向き矢印) 📈
  2. バッファー 1: DownArrow (下向き矢印) 📉
  3. バッファー 2: UpLine (上向きライン) ⬆️
  4. バッファー 3: DownLine (下向きライン) ⬇️
  5. バッファー 4: TotalVolume (総ボリューム) 🔄
  6. バッファー 5: DeltaVolume (デルタボリューム) ➕➖
  7. バッファー 6: VSAVolume (VSAボリューム) 📊

🔍 動作原理

  • ⏱️ 継続的なモニタリング: SwingVolumeProは、リアルタイムで市場の動的分析を実行し、資産の挙動に潜在的な変化を示すボリュームと価格のパターンを特定します。

  • 💡 シグナルの生成: 価格吸収と市場アグレッションの正確な分析に基づき、インジケーターはさまざまな取引戦略に適用できるシグナルを生成します。

  • 🧠 コンテキスト分析: シグナルを提供するだけでなく、SwingVolumeProは市場の全体的な状況に関する洞察も提供し、トレーダーがシグナルが生成される条件をより良く理解できるようにし、意思決定を最適化します。

🏆 トレーダーへの利点

  • 🗝️ 明確さと精度: SwingVolumeProは市場分析を簡素化するよう設計されており、シグナルは直接的で理解しやすいです。

  • 🌐 ユニバーサルな適用性: 取引する資産に関係なく、SwingVolumeProはさまざまな市場の特性に適応できる効果的なツールです。

  • 🔄 複数の戦略のサポート: このインジケーターは短期から長期の取引戦略に至るまで、さまざまな取引戦略に統合できる柔軟性を持っています。

🚀 結論

SwingVolumeProは、トレーダーが取引操作で明確さ、精度、効率を追求するための不可欠なツールです。高品質な技術シグナルを生成する能力、EA構築との互換性、ボリュームと価格の詳細な分析を通じて、さまざまな市場シナリオにおいて重要なパートナーとなります。SwingVolumeProを試してみて、どのようにしてあなたの取引戦略を強化し、深い分析と信頼できるシグナルを提供できるかをご確認ください。


おすすめのプロダクト
このインジケーターは実践的なトレードに最適な自動波動分析のインジケーターです! 場合... 注:   Tang Lun (Tang Zhong Shuo Zen) の命名規則の影響で、私は波のグレーディングに西洋の名前を使用することに慣れていません。基本的な波を ペン 、二次波のバンドを セグメント と名付けました。同時に、 セグメント にはトレンドの方向が指定されます (この命名方法は将来のノートで使用されます。最初に言っておきます)。ただし、アルゴリズムは曲がりくねった理論とはほとんど関係がないため、付けるべきではありません。これは、私の市場分析 によって要約された、絶えず変化する複雑な運用ルール を反映しています。 バンドは標準化され、人によって異なることがないよう定義されており、市場参入を厳密に分析する上で重要な役割を果たす人為的な干渉の描画方法が排除されています。 このインジケーターを使用することは、取引インターフェイスの美しさを改善することと同等であり、元の K ライン取引を放棄し、取引の新しいレベルに連れて行きます。また、宣伝の観点から顧客の認識も向上します。 イ
Modern Spike Indicator Features: 1. Support and Resistance Lines: Displays dynamic horizontal dashed lines on the chart representing current support and resistance levels calculated from recent price swings. 2. Spike Detection Arrows: Shows up arrows (green) for potential upward spikes and down arrows (red) for potential downward spikes, triggered when price breaks S/R levels with RSI confirmation. 3. Trend Analysis: Incorporates ADX (Average Directional Index) to determine market trend stre
DoubleBB MARSI — デイトレードに最適化されたオールインワン・チャートツール 価格の現在位置 · 市場の雰囲気 · エントリーシグナル — すべてを一画面で 一行サマリー DoubleBB MARSI は、デイトレードに必要な3つの核心情報 — 日次基準ライン · RSI による相場感 · ダブルボリンジャーバンドのシグナル — を一つのチャートに統合し、トレーダーが素早く正確な判断を下せるようサポートします。 トレーダーが得られる3つの価値 DoubleBB MARSI は単なる補助指標ではなく、デイトレードの一日のサイクル全体に必要な情報を一画面に提供します。 1. 「今、価格はどこにある?」 — 日次の重要ラインを自動表示 チャート上に次の3本のラインが自動で描かれます。 · DO (Day Open · 当日始値) · PDH (Previous Day High · 前日高値) · PDL (Previous Day Low · 前日安値) 現在価格が買い優勢ゾーンにあるのか、売り優勢ゾーンにあるのかを一瞬で判断できます。 「今日の始値より上で
Impulse fractals indicator - is counter-trend oriented complex market fractal pattern.  Market creates bull/bear impulse, trend starts, fractals on impulsed wave are an agressive pullback signals. Buy arrow is plotted when market is bearish and it's impulse showed up-side fractal, and sell arrow is plotted when market is bullish and it's impulse showed dn-side fractal. Main indicator's adjustable inputs : impulsePeriod - main period of impulse histogram  filterPeriod  - smoothes impulse accordi
Our BOOM SELL ALERT indicator is specifically engineered to   take candles on BOOM 1000 , BOOM 500 is tool is optimized for M1 (1-minute) timeframe, ensuring you receive timely and actionable insights.   The indicator is a combination of   many indicators. -        AO Oscillator -        Stochastic   HOW TO USE THIS INDICATOR To use well this indicator , it   need to use SCHAFF TREND RSX ( 5 MIN OR M5) IF SCHAFF trend RSX is GREEN and you have a signal then SELL when you have ENTRY and out with
STRUCTURE DU MART SR ULTIMA  Structure ultime du marché et indicateur intelligent de support/résistance SMART STRUCTURE SR ULTIMA est une solution de trading avancée conçue pour fournir une lecture claire, précise et professionnelle de la structure du marché. Conçu pour les traders modernes, cet indicateur combine une structure intelligente (DER/DES) , des niveaux de support et de résistance dynamiques et un système unique de Structure Fan qui visualise la force du marché, son expansion et ses z
Turpial Pullback
Arlos Elias Rivas Romero
Indicator Type Strategy (Pullback) for all Symbols and Periodicity, Preferably from 30M periodicity. Can be used for manual trading. Its workspace corresponds to channel of 3 bars of Bill Willians. Also relies on the indicator Rsi and Atr. BUY when: There is a Green Arrow STOPLOSS to buy, below the bottom line of the channel (red line)" SELL when: There is a Red Arrow. STOPLOSS to sell, above the upper line of the channel (blue line)
EYeQ インジケーターは、STEP INDEX、VOLATILITY 10、25、50、75 100、BOOM、および CRUSH でエントリーシグナルを提供するための強力なツールです。 BOOMやCRUSH 300、500、1000でのSPIKESをより効果的にキャッチ。 EYeQ インジケーターは、複数の時間枠にわたって市場を分析し、トレンドに基づいて最適なエントリー ポイントを見つけます。デスクトップ アラートをオンにするだけで、シグナルがリリースされたときに通知を受け取ることができます。電話やタブレットなどの他のポータブル デバイスへのプッシュ通知を許可して、そのようなデバイスでのリモート取引のアラートを受け取ります。 N/B: Boom および Crush インデックスでの TRADING TICKS の取引は避けてください。また、指標は終了ポイントを提供しないことに注意してください。MetaTrader プラットフォームの各商品の最小ロット サイズで 3 USD の利益が発生した場合は、終了する必要があります。 例: 最低ロットサイズ;ステップインデックス-0.
Crypto_Forex MT5用インジケーター「トレンドエントリーヒストグラム」、リペイント機能なし。 - トレンドエントリーヒストグラムインジケーターは、Entry_barが表示された後、トレンド方向へのエントリーシグナルを探すのに使用できます。 - このインジケーターのユニークな特徴は、価格と出来高の両方を計算に用いることです。 - トレンドエントリーヒストグラムは2色で表示されます。弱気トレンドの場合は赤、強気トレンドの場合は青です。 - 安定したトレンドを確認したら(同じ色のヒストグラムバーが最低10本連続して表示される)、Entry_barを待ちます。 - エントリーシグナルは、ヒストグラム上で反対色の列と、最初のトレンド色の列です(図を参照)。 - ショートターゲットを使用 - 現在のトレンドに応じて、チャート上の最も近い高値/安値。 - インジケーターにはモバイルとPCのアラートが組み込まれています。 インジケーターの使い方: - 買いシグナルの場合:継続的な強気トレンド(青いヒストグラムバー)+ ヒストグラム上の赤いバー1本 + 青いバー1本(ここでロングトレー
Holiday Sales Zones Indicator The Zones Indicator is your everyday Trading tool that  leverages advanced algorithms, including ICT institutional concepts like order blocks , engulfing candle patterns , and Level interactions , to identify critical levels of supply and demand (Resistance & Support). Visual signals are generated and clearly marked on the chart, providing a straightforward guide for traders to spot key opportunities. Key Features Advanced Algorithmic Analysis : Identifies supply
The indicator determines a special pattern of Joe Dinapoli. It gives very high probability buy and sell signals. Indicator does not repaint. Indicator Usage Buy Signal ''B'' Entry : Market buy order at signal bar close Stop : Low of signal bar Take Profit : First swing high Sell Signal ''S'' Entry : Market sell order at signal bar close Stop : High of signal bar Take Profit : First swing low Indicator Parameters Fast EMA : External Parameter (should be kept as default) Slow EMA: External Param
If you are unsure how to use this indicator, please feel free to reach out to me. I will explain it to you and provide reading materials to help you make the most of it. TD Sequential Scanner: An Overview The TD Sequential scanner is a powerful technical analysis tool designed to identify potential price exhaustion points and trend reversals in financial markets. Developed by Tom DeMark, this method is widely used by traders to gauge market cycles and potential turning points with precision. Ho
Indicator of trend deviation with a static level. The deviation coefficient is set for the trend histogram. Signals are the intersection of the level trend histogram in the direction of the trend or during a trend reversal - the option is selected in the indicator settings by the "Revers" parameter. There are all the necessary settings for the design of the indication and sending messages to mail or a mobile terminal. All input parameters have an intuitive name. Analog for MT4: https://www.mql5.
MarketMagnet
Kelly Adediran Raymond
Are you ready to take your trading journey to new heights? Look no further than MarketMagnet, this groundbreaking indicator designed to propel your trading success with excitement and accuracy. Powered by the convergence of Momentum and CCI (Commodity Channel Index), MarketMagnet equips traders with the ultimate tool to determine direction and entry prices for a wide range of recommended currency pairs and instruments. It is designed for traders seeking to scalp for a few pips on lower timeframe
The ZigZag Buy Level is a specialized tool for traders who utilize market structure and classic ZigZag patterns to define key support and entry points. It automatically identifies "Main Highs"—significant highs confirmed by the subsequent price action—and then calculates a high-probability "Buy Level" based on a specified percentage pullback from that Main High to the last corrective low. This indicator helps you anticipate deep retracement entries, clearly marking them on the chart with labels
Caicai L&S Yield Histogram Important Notice: This indicator is an integral tool of the automated EA Caicai Long and Short Pair Trading . This indicator visually displays the percentage deviation (Yield %) of a pair's current spread relative to its own historical mean. It is an excellent tool for quickly visualizing the gross financial potential of a market distortion in Long & Short operations. Main Features: Percentage Visualization: Understand the size of the distortion in palpable percentage
ISIS Indicator - The Power of Moving Average Crossovers for Accurate Trading ISIS Indicator Overview ISIS is an advanced technical indicator for MetaTrader 5, designed to identify accurate buy (BUY) and sell (SELL) signals based on the crossover of two configurable moving averages. It is designed to be used in conjunction with the OSIRIS robot, but can also be applied manually by traders looking for trend-based strategies. With a smart combination of a fast moving average (Fast MA) and a sl
Daily VWAP, continues for a period of hours (eg, 10 hours of history), with color to indicate change of direction and bands to map good entry and exit points. The indicator was created to map the center of the market, and find good buying moments, trend analysis or market correction points are easily detected, allowing you to understand moments of exhaustion and buying and selling points Copyright (c) <year> <copyright holders> Permission is hereby granted, free of charge, to any person obtaini
The patterns of 3 (three) Candles: Three White Soldiers; Three Black Crows; These are reversal patterns widely used by traders, as they have a high probability of showing the inversion of the current market movement. For example, if in a bullish trend there are three black crows, there is a high probability of reversing the current bullish movement. The Three White Soldiers have the following characteristics: There are 3 consecutive candles with a good body, that is, the difference between th
Limitless MT5 is a universal indicator suitable for every beginner and experienced trader. works on all currency pairs, cryptocurrencies, raw stocks Limitless MT5 - already configured and does not require additional configuration And now the main thing Why Limitless MT5? 1 complete lack of redrawing 2 two years of testing by the best specialists in trading 3 the accuracy of correct signals exceeds 80% 4 performed well in trading during news releases Trading rules 1 buy signal - the ap
Ultimate Double Top & Bottom (Pro Volume Matrix) Stop trading retail breakouts. Start trading Institutional Traps. The   Ultimate Double Top & Bottom   is not a standard, lagging pattern scanner. It is a highly advanced, non-repainting structural engine equipped with a proprietary   3-Leg Volume Matrix . Designed exclusively for Smart Money Concepts (SMC) and order flow traders, this indicator mathematically dissects the tick volume inside M and W patterns to reveal true institutional intent:  
Divergence Bomber MultiTF
Gabriel Alejandro Sanchez Lledo
WARLOCK Divergence Bomber MultiTF MT5 Professional Edition v3.0 – Multi-Timeframe Divergence Powerhouse Professional Product Description (Ready for MQL5 Market) WARLOCK Divergence Bomber MultiTF MT5 is a premium, institutional-grade divergence scanner that combines the three most powerful oscillators — RSI, MACD, and Stochastic — across 9 timeframes simultaneously (M1, M5, M15, M30, H1, H4, D1, W1, MN1). It detects Regular and Hidden bullish/bearish divergences in real time, calculates a sophis
A useful scanner/dashboard that shows the RSI values for multiple symbols and Time-frames. It can be easily hidden/displayed with a simple click on the scanner man top left of the dashboard. You can input upper and lower RSI values and the colours can be set to show when above/below these values. The default values are 70 and 30. There are also input colours for when the RSI is above or below 50 (but not exceeding the upper/lower levels Symbols and time-frames are input separated by commas. S
Session Map Pro automatically plots the critical price levels from previous trading days and overlays visual session markers, giving you an instant "roadmap" of potential support and resistance.   It transforms your chart into a strategic trading battlefield.   Detailed Line Reference Guide (For visual display m1-m5 works best but can be attached to any time frame) Default lookbackDays=5. "Set to 1 for today only and a less cluttered display"  1.Horizontal lines (n) Days)    Solid GREEN Line (
VWAP indicator for MT5
Renaud Herve Francois Candel
Moving VWAP Indicator Moving VWAP is an important indicator drawing the Volume-Weighted Average Price (VWAP). The VWAP is a reference used by institutional traders and acts as a level of support / resistance. If price is above VWAP then means market is bullish. If price is below VWAP then means market is bearish. It can be used to enter in the market with low risk (near VWAP) and also identify the correct direction of the market. The Moving VWAP is as simple as a Simple Moving Average. The m
Elliot Wave Pro is an MT5 indicator that automatically detects Elliott Wave structures (impulse and corrective behavior) and calculates key Fibonacci-based retracement/limit levels from the most recent completed wave. It helps turn wave structure into a tradable setup: enter on the pullback, target Wave 1 , and place your stop beyond the wave high / invalidation level . That gives you a clear risk-to-reward model where a single valid setup can outweigh multiple small losses. In short, it shows w
A SmartTrendMA foi projetada para identificar melhor zonas de alta, baixa e consolidação, azul alta, vermelho baixa e branco consolidação, vai te auxiliar a identificar melhor a tendência. Em parâmetro regule melhor conforme sua preferência em grau pois cada par de moeda se adequa diferentemente a cor,mude também o período e se quiser mude exponencial ou simples. 
The Plasma Trend indicator is a simple technical indication that is used to determine the current trend direction in the market. The Plasma Trend indicator is a powerful tool for determining the direction of the trend in the Forex market. It is based on both standard technical indicators and proprietary mathematical calculations, which provides a more accurate and reliable trend determination. Its implementation in the form of lines of two colors simplifies the visual determination of a change
The First Dawn indicator uses a unique mechanism to search and plot signals. This keeps searching for signals, making it a great indicator for scaping and identification of changes in direction, swing trading and trend trading. The    First Dawn     helps you get early signals. The backtest gives the true picture of how the indicator works with real/demo accounts. Although this is a tiny indicator it is packed with advantageous settings that will help you whether you desire to: Snap the Peaks a
VWAP Z-Score (Rolling) Positive values indicate price trading above VWAP, while negative values indicate price trading below VWAP. Typical Use Cases Mean-reversion strategies Overbought / oversold detection VWAP-based statistical analysis Confirmation tool for discretionary or algorithmic trading Risk-aware trade entries and exits Notes Uses tick volume for VWAP weighting (standard for Forex symbols). The indicator does not repaint. Designed for analytical and decision-support purposes only.
このプロダクトを購入した人は以下も購入しています
ARIPoint is a powerful trading companion designed to generate high-probability entry signals with dynamic TP/SL/DP levels based on volatility. Built-in performance tracking shows win/loss stats, PP1/PP2 hits, and success rates all updated live. Key Features: Buy/Sell signals with adaptive volatility bands Real-time TP/SL/DP levels based on ATR Built-in MA Filter with optional ATR/StdDev volatility Performance stats panel (Success, Profit/Loss, PP1/PP2) Alerts via popup, sound, push, or email Cu
SignalTech MT5 is an unique fully rule based trading system for EURUSD, USDCHF, USDJPY, AUDUSD, NZDUSD, EURJPY, AUDJPY, NZDJPY, CADJPY.  All the winning trades with chart setups are published on the comments page. 2026-05 2802 Pips (Until 05-15 NY Closed) 2026-04 2243 Pips 2026-03 2165 Pips 2026-02 2937 Pips 2026-01 2624 Pips 2025-12 1174 Pips It can generate signals with Buy/Sell Arrows and Pop-Up/Sound Alerts. Each signal has clear Entry and Stop Loss levels, which should be automatically flag
Azimuth Pro
Ottaviano De Cicco
5 (7)
Azimuth Pro V2:MT5向けシンセティック・フラクタル構造分析と確認済みエントリー 概要 Azimuth Pro は Merkava Labs によるマルチレベルスイング構造インジケーターです。4つのネストされたスイングレイヤー、スイングアンカーVWAP、ABCパターン検出、3タイムフレーム構造フィルタリング、そして確定バーでの確認済みエントリー — 1つのチャートで、ミクロスイングからマクロサイクルまでを網羅するワークフロー。 これはブラインドシグナル製品ではありません。ロケーション、コンテキスト、タイミングを重視するトレーダーのための構造ファーストワークフローです。 V2発売記念オファー — Azimuth Pro V2をUSD 399で(次の100本)。最終価格:USD 499。 1. V2での変更点 シンセティック・マルチタイムフレームエンジン 上位タイムフレーム分析をMeridian Proと同じ独自のシンセティックアーキテクチャで一から再構築。よりクリーンなHTFコンテキスト、安定したライブ動作、従来のMTF同期問題なし。シンセティックエンジンは 固定比率タ
まず第一に、この取引ツールはノンリペイント、ノンリドロー、ノンラグの指標であり、プロの取引に理想的ですことを強調する価値があります。 オンラインコース、ユーザーマニュアル、デモ。 スマートプライスアクションコンセプトインジケーターは、新米から経験豊富なトレーダーまで、非常 に強力なツールです。Inner Circle Trader AnalysisやSmart Money Concepts Trading Strategiesなど、20以上の有用な指標を1つに組み合わせています。このインジケーターはスマートマネーコンセプトに焦点を当て、大手機関の取引方法を提供し、彼らの動きを予測するのに役立ちます。 特に、流動性分析に優れており、機関がどのように取引しているかを理解しやすくしています。市場のトレンドを予測し、価格の動きを慎重に分析するのに優れています。機関の戦略とトレードを合わせることで、市場の動向についてより正確な予測ができます。このインジケーターは多目的であり、市場構造を分析し、重要な注文ブロックを特定し、さまざまなパターンを認識するのに優れています。 このインジケーター
多くの矢印インジケーターは、シグナルだけを表示して、その後の判断をすべてトレーダーに任せてしまいます。KT Alpha Hunter Arrows は、完整なトレードプランをチャート上に提示します。 各シグナル矢印が表示されるたびに、エントリーライン、ストップロス、4つのテイクプロフィット水準、そして現在の銘柄と時間足が今トレードに値するかどうかを示すリアルタイムのエッジ判定が、すでに描画された状態で表示されます。付属の Trade Manager EA は、あなたが手動でエントリーした後の実行管理を担当し、相場が荒れて判断がぶれやすい場面でも規律あるトレードを保ちやすくします。リペイントなし。確定足シグナルのみ。Forex、ゴールド、指数、その他あなたが取引するあらゆる銘柄に対応します。 主な機能 リペイントしない買い矢印と売り矢印を、足の確定後にのみ表示。 各シグナルに、エントリーライン、構造的ストップロス、4つのテイクプロフィット水準を表示。 Edge Dashboard が、現在のチャートで買いセットアップと売りセットアップを別々に評価。 判定システム:No Edge、Mar
GEM Signal Pro GEM Signal Pro は、MetaTrader 5 向けのトレンドフォロー型インジケーターです。より明確なシグナル、より整理されたトレードセットアップ、そして実用的なリスク管理をチャート上で確認したいトレーダーのために設計されています。 単純な矢印だけを表示するのではなく、GEM Signal Pro はトレード全体の考え方を、より見やすく分かりやすい形で表示します。条件が確認されると、インジケーターはエントリー価格、ストップロス、利確目標をチャート上に表示し、トレードセットアップをより効率的に確認できるようにします。 動作の仕組み このインジケーターは、まず内部ロジックに基づいて有効なシードシグナルを検出します。 確認条件が満たされると、GEM Signal Pro はチャート上に完全なセットアップを表示します。これにより、トレーダーはトレード構造をより明確に把握し、手作業による分析を減らすことができます。 チャート上のトレードレベル 確認済みシグナルに対して、GEM Signal Pro は以下を表示できます。 エントリー価格 ストップロス テ
RelicusRoad Pro: 定量的市場オペレーティングシステム 【期間限定】無制限アクセス 70% OFF - 2,000人超のトレーダーと共に なぜ多くのトレーダーは「完璧な」インジケーターを使っても失敗するのでしょうか? それは、文脈を無視して 単一の概念 だけでトレードしているからです。文脈のないシグナルは単なるギャンブルです。勝ち続けるには、 根拠の重なり(コンフルエンス) が必要です。 RelicusRoad Proは単なる矢印インジケーターではありません。完全な 定量的市場エコシステム です。独自のボラティリティモデリングを用いて、価格が推移する「適正価値の道(Fair Value Road)」をマッピングし、ノイズと真の構造的ブレイクを判別します。 推測はやめましょう。機関投資家レベルの「ロード・ロジック」でトレードを。 コアエンジン:「Road」アルゴリズム システムの中心となる Road Algo は、市場環境にリアルタイムで適応するダイナミックなボラティリティチャネルです。 安全ライン(平衡点) と、価格が数学的に反転しやすい 拡張レベル を投影します。 Si
OmniSync Projection
Antonio-alin Teculescu
5 (1)
Chronos Fractal Engine is an innovative price projection indicator for MetaTrader 5, designed to transform your technical analysis by intelligently identifying and projecting historical price patterns. Built upon an advanced correlation algorithm and the fractal principles of the market, this powerful tool visualizes potential future price movements, giving you a unique edge in your trading decisions. What is Chronos Fractal Engine? At its core, the Chronos Fractal Engine employs a sophisticat
Presenting one-of-a-kind Gann Indicator for XAUUSD IQ Gold Gann Levels is a non-repainting, precision tool designed exclusively for XAUUSD/Gold intraday trading. It uses W.D. Gann’s square root method to plot real-time support and resistance levels, helping traders spot high-probability entries with confidence and clarity. William Delbert Gann (W.D. Gann) was an exceptional market analyst whose trading technique was based on a complex blend of mathematics, geometry, astrology, and ancient calcul
MetaTrader 5 向けスマート多層ブレイクアウト&プルバック検出器 「スマート・シンプル・ファスト!」 高確率のブレイクアウトエントリーを見逃すことにうんざりしていませんか? 複数のチャートを何時間もスキャンし、ブレイクアウトをトレンド方向と通貨のモメンタムに合わせようとして、それでも動きを逃してしまうことはありませんか? Break Pullback は、1つのインジケーターでそのすべてを解決します。 Break Pullback とは何ですか? Break Pullback は、マーケットストラクチャー、ブレイクアウト、トレンド継続のセットアップを取引するトレーダー向けに特別に設計されたプロフェッショナルグレードの MetaTrader 5 インジケーターです。 リアルタイムで複数の通貨ペアにわたるブレイクとプルバックの形成を自動的に検出し、3層の確認を通じてすべてのシグナルをフィルタリングします: ストラクチャラルブレイクアウト検出 — チャート上の主要なブレイクレベルを特定 HTF 日足バイアス — エントリーを支配的な日足トレンド方向に合わせる 通貨強弱指数 —
ARICoin is a powerful trading companion designed to generate high-probability entry signals with dynamic TP/SL/DP levels based on volatility. Built-in performance tracking shows win/loss stats, PP1/PP2 hits, and success rates all updated live. Key Features: Buy/Sell signals with adaptive volatility bands Real-time TP/SL/DP levels based on ATR Built-in MA Filter with optional ATR/StdDev volatility Performance stats panel (Success, Profit/Loss, PP1/PP2) Alerts via popup, sound, push, or email Cust
マーケットメーカーのためのツール。 Meravith は次の機能を提供します: すべての時間足を分析し、現在有効なトレンドを表示します。 強気と弱気の出来高が等しくなる流動性ゾーン(出来高均衡)を強調表示します。 異なる時間足のすべての流動性レベルをチャート上に直接表示します。 テキスト形式の市場分析を生成し、参考情報として表示します。 現在のトレンドに基づいて目標値、サポートレベル、ストップロスを計算します。 取引のリスクリワード比を算出します。 口座残高に基づいてポジションサイズを計算し、潜在的な利益を推定します。 また、市場に大きな変化があった場合には警告を表示します。 インジケーターの主要ライン: 強気/弱気の出来高エグゾーストライン ― 目標値として機能します。 市場のトレンドを示すライン。市場が強気か弱気かによって色が変わり、トレンドのサポートとして機能します。主にその色が市場センチメントを示します。 出来高均衡ライン(Eq)。Eq(Volume Equilibrium)ラインはシステムの中核です。これは買い手と売り手の出来高のバランスポイントを表します。市場の流動性を示し
「 Dynamic Scalper System MT5 」インジケーターは、トレンド波の中でスキャルピング取引を行う手法のために設計されています。 主要通貨ペアと金でテスト済みで、他の取引商品との互換性があります。 トレンドに沿った短期的なポジションオープンのシグナルを提供し、追加の価格変動サポートも提供します。 インジケーターの原理 大きな矢印はトレンドの方向を決定します。 トレンド波の中では、小さな矢印の形でスキャルピングシグナルを生成するアルゴリズムが機能します。 赤い矢印は強気方向、青い矢印は弱気方向です。 トレンドの方向には敏感な価格変動ラインが描かれ、小さな矢印のシグナルと連動します。 シグナルは次のように機能します。適切なタイミングでラインが現れるとエントリーシグナルが形成され、ラインが開いている間はポジションが保持され、完了すると取引が終了します。 推奨される動作時間枠はM1~H4です。 矢印は現在のローソク足に形成され、次のローソク足が開いている場合は、前のローソク足の矢印は再描画されません。 入力パラメータ Trend Wave Period - トレ
プレミアムレベルは、正しい予測の精度が80%を超える独自の指標です。 この指標は、最高のトレーディングスペシャリストによって2か月以上テストされています。 あなたが他のどこにも見つけられない作者の指標! スクリーンショットから、このツールの正確さを自分で確認できます。 1は、1キャンドルの有効期限を持つバイナリーオプションの取引に最適です。 2はすべての通貨ペア、株式、商品、暗号通貨で機能します 手順: 赤い矢印が表示されたらすぐにダウントレードを開き、青い矢印が表示されたら閉じます。青い矢印の後に開くこともできます。 試してテストしてください!推奨設定はデフォルトです! 日足チャートで最高の精度を示します! インディケータは、2600 Pipsの収益性に対して、約10Pipsという非常に小さなマージンを使用します。
AriX
Temirlan Kdyrkhan
1 (4)
AriX Indicator for MT5 A powerful trend-following and signal-evaluation tool AriX is a custom MT5 indicator that combines Moving Averages and ATR-based risk/reward logic to generate clear buy/sell signals. It visualizes dynamic SL/TP levels, evaluates past trade outcomes, and displays win/loss statistics in a clean on-chart panel. Key features include: Buy/Sell signals based on MA crossovers ATR-based SL/TP1/TP2/TP3 levels with visual lines and labels Signal outcome tracking with real-time stat
Introducing Assembler:  The best value for money,  Designed for advanced traders and professionals, yet accessible for ambitious beginners ready to elevate their trading game. Great for ICT, SMC, TREND and breakout traders . Combining advanced analytics, a sleek graphical interface, and highly customizable features, Assembler empowers you to trade with precision, clarity, and confidence. Key Features of Assembler 1. Dynamic Graphical User Interface (GUI): A fully draggable, customizable interf
UZFX SWS {スキャルピング・ウィニング・シグナルズ} Pro v1.0 は、Usman Zabir(UZFX LABS)が開発した強力なノンリペインティング指標です。急変する市場で正確なエントリーシグナルを求めるスキャルパー、デイトレーダー、スイングトレーダー向けに特別に設計されています。遅延や誤った再描画のない、信頼性の高いリアルタイムシグナルを求めるトレーダーに最適です。 私のおすすめ* 最適時間枠:30分以上。 {1時間} が私のお気に入りです。そして結果は驚くべきもの...! 注:{ LTL 164343 }インジケーターと組み合わせることで、シグナルの勝率を高めることができます。 LTLシグナルでトレンドを判断し、SWSシグナルをエントリーシグナルとして活用してください。 このアプローチにより勝率が最大化され、誤ったシグナルの発生を防ぐことができます。 主な機能: 直近および過去のシグナルを明確な視覚的矢印で表示(古いシグナルを点で表示するオプション付き)。 取引ラインの自動計算・描画:エントリー、ストップロス(直近のスイングロー/ハイに基づく)、複数テイクプロフ
Ziva LSE System
Hassan Abdullah Hassan Al Balushi
ZIVA LSE System A Professional Liquidity & Structure Execution Framework Executive Overview ZIVA LSE System is a professionally engineered analytical framework designed to interpret market behavior through structural logic and liquidity dynamics. It is not positioned as a conventional indicator. Rather, it functions as a structured execution environment that organizes price action into a clear, disciplined decision-making model. The system is built to deliver consistency, clarity, and controlled
MATADOR GOLD — XAUUSD M5 ( TimeFrame M5 ) Scalp Signals for MT5 Strategy Tester Visualization Video https://youtu.be/_cWbbyg2RSs Not every move deserves a signal. MATADOR GOLD was built for traders who prefer selective, structured, high-quality decision support over noisy, hyperactive signal tools. Designed specifically for Gold (XAUUSD / GOLD) on M5 , MATADOR helps you read short-term momentum with more discipline by combining trend logic, market-condition filters, momentum timing, spread pro
+++++++++++++++++++++++++++++++++++++++++++++++++++++++++++++++++++++++++++++++++++++++++++++++++ +++ Link to EURUSD Only Free Version -->  https://www.mql5.com/en/market/product/156904?source=Unknown +++++++++++++++++++++++++++++++++++++++++++++++++++++++++++++++++++++++++++++++++++++++++++++++++ Hallo Trader, This is a traditional GANN & FIBONACCI strategy based on detection of an impulsive move in the opposite direction. This is called a Breakout. At the moment of Breakout, the indicator draw
The Zone Trading Indicator is a technical analysis tool for MetaTrader 5 that automatically identifies and displays tradable price zones across multiple timeframes to assist with structured market analysis. The indicator plots Monthly, Weekly, Daily, and H4 tradable zones , allowing traders to view higher- and lower-timeframe price areas simultaneously. These zones are designed to support one-candle–based entry approaches by highlighting predefined areas where price interaction may be monitored.
このインジケーターの独自性と鋭さを支えるコンセプトは、最高のメンターの一人であるArjo氏が考案・監修した「フェアバリューギャップ理論」に基づいています。そして、私自身がそのコンセプトに開発面を加えました。一連の動画には、完全な解説のためのオリジナルのYouTubeリンクと、コンパイル済みのMT4/5システムの動作画面のスクリーンショットが含まれています。 公開されるすべてのシステムは、あらゆるプラットフォームとユーザーの要望に対応するため、MT4とMT5でそれぞれ個別に提供されます。 ボーナス機能として、システムをご購入いただいた先着100名様には、PineScriptツールをプレゼントいたします。これにより、追加料金なしでTradingViewでシステムをご利用いただけるようになります。 リンク: https://youtu.be/gT5SFdwIYC0?si=L_ldI4E_pCx4gVhL 内容: 1. リンクで説明されているように、強気/弱気のフェアバリューギャップボックスが自動的に検出され、描画されます。 2. 巧妙なブレイクアウェイギャップシグナル 3. ブレイクアウェ
A1rum In1 Target V1 は、市場の方向性、ゾーン分析、シグナル品質を1つのプロフェッショナルなダッシュボードにまとめるために設計されたスマートハイブリッド取引インジケーターです。 より見やすいチャートと素早い判断を求めるトレーダー向けに作られており、トレンドバイアス、ゾーンマッピング、タイミング確認、ダイナミックスコアリングを1つのシステムに統合しています。 主な機能 Smart BUY / SELL signal detection Dynamic signal strength meter Professional dashboard interface Trend bias & market quality analysis Zone-based entry confirmation Timing Pulse confirmation engine Daily session zone levels Clean body-only candle coloring Optimized for backtesting and live trading Supports
MightyPips Sentiment Pro is a market sentiment indicator for MetaTrader 5 designed to help traders analyze buying and selling pressure in the market. The indicator evaluates market behavior to provide a clearer view of trend direction, momentum strength, and overall sentiment conditions. It helps traders understand whether buyers or sellers are currently dominating the market. Features Buyer vs Seller Analysis Displays the balance between buying and selling pressure using real-time market data.
The Propfolio Master Suite is the ultimate all-in-one analytical workstation for professional traders. Combining the power of the Beat The Market Maker (BTMM) methodology, Smart Money Concepts (SND/Liquidity), and Advanced Volume Profile, this suite replaces multiple different indicators with one optimized engine. Monitor up to 14 pairs simultaneously from a single chart, instantly identify market cycles, and seamlessly map institutional footprints with the click of a button. The Command Center
First time on MetaTrader, introducing IQ Star Lines - an original Vedic Astrology based indicator. "Millionaires don't use astrology, billionaires do" . - J.P. Morgan, Legendary American financier and banker. Welcome to  the new and updated  IQ Star Lines , the ultimate fusion of ancient planetary harmonic cycles and modern quantitative trading. published for the   first time on Metatrader. This is an indicator built by the developer, who has spent almost 2 decades trading while studying Vedic
UZFX {SSS} スキャルピング・スマートシグナル MT5は、変動の激しい市場において正確かつリアルタイムのシグナルを求めるスキャルパー、デイトレーダー、スイングトレーダー向けに設計された、リペイントしない高性能な取引インジケーターです。(UZFX-LABS)によって開発されたこのインジケーターは、価格行動分析、トレンド確認、スマートフィルタリングを組み合わせることで、すべての通貨ペアおよび時間軸において、高確率の売買シグナルを生成します。 推奨* 最適な時間足:15分足以上。 {1時間足}が私のお気に入りです。そして、その成果は驚くべきものです...! 注:{ LTL 164343 }インジケーターと組み合わせることで、シグナルの勝率を高めることができます。 LTLシグナルでトレンドを判断し、SSSシグナルをエントリーシグナルとして活用してください。 このアプローチにより勝率が最大化され、誤ったシグナルの発生を防ぐことができます。 主な機能 スマートシグナル検出 – 強力なトレンド反転や継続パターンを正確に特定します。 マルチタイムフレーム・スキャルピング – すべての時間
==================================================================== SMC Pro v6.1 APEX AI — XAUUSD Gold Empire MetaTrader 5 Indicator · Smart Money Concepts · Predictive Intelligence Engine ==================================================================== SMC Pro v6.1 APEX AI is a professional Smart Money Concepts indicator system built exclusively for XAUUSD (Gold) on MetaTrader 5. It combines the complete SMC framework — Order Blocks, Liquidity sweeps, Fair Value Gaps, Break of Structure,
SHOGUN Trade - 戦略的市場構造と損小利大の極意 スペシャルセール – 特別価格 (通常価格 $299)! 新作 https://www.mql5.com/ja/market/product/176984 この特別オファーは期間限定です。 私たちは現在、 さらなる製品開発と最適化 に注力しております。皆様からの貴重なフィードバックを製品に反映させるため、レビューへのご協力を条件にこの割引価格で提供させていただきます。皆様からいただくご意見は、次回のアップデートや新機能の追加に直接活用させていただきます。 ショーグントレードプロ ~「迷い」を断ち切り、将軍の視座を手に入れる。ダウ理論・市場構造分析スイート~ MT4版はこちらをクリックしてください https://www.mql5.com/ja/market/product/158467 1. はじめに:なぜ、多くのトレーダーは「森」で迷うのか? あなたは、目の前の1分足の値動きに翻弄され、感情的なエントリーで資金を減らしていませんか? 戦場で地図を持たずに走り回る兵士は生き残れません。生き残るのは、高台から戦況全体を俯瞰し
Niveaux mensuels + PinBar + Marubozu + ALERTES (MQL5) Version : 2.0 FINAL Auteur : KOUAME N'DA LEMISSA See More Description du produit Cet indicateur avancé pour MetaTrader 5 combine l'analyse des niveaux mensuels, la reconnaissance des modèles de chandeliers japonais (PinBar et Marubozu) et un système d'alerte en temps réel. Il aide les traders à identifier rapidement les zones clés du marché et les opportunités de trading à forte probabilité. Caractéristiques principales Affichage automatiqu
作者のその他のプロダクト
Cvd Divergence
Thalles Nascimento De Carvalho
CVD Divergence ― オーダーフローとダイバージェンスのプロフェッショナル分析 CVD Divergence は、価格と Cumulative Delta Volume(CVD)との間に発生する信頼性の高いダイバージェンスを検出するために開発されたテクニカル指標です。実際の注文フローが価格の動きを確認していない局面を正確に捉え、反転、勢いの減衰、そして機関投資家による操作の可能性を示します。 このインジケーターは、アグレッシブボリュームの読み取りと価格構造の分析を組み合わせ、明確で客観的かつ先行性のあるシグナルを提供します。 インジケーターの機能 CVD Divergence は、累積デルタボリュームを用いて注文フローの方向と価格の方向を比較します。両者が大きく乖離した際、チャート上にマーカーを表示し、ダイバージェンスの方向を視覚的に示します。 検出できる内容: 強気ダイバージェンス(価格が下落しているが CVD が上昇している場合) 弱気ダイバージェンス(価格が上昇しているが CVD が下降している場合) 買い手・売り手の勢いの枯渇 機関投資家の不均衡によるフェイクムーブ
Tape Hunter
Thalles Nascimento De Carvalho
Tape Hunter – MT5で努力と結果を見極めるレーダー Tape Hunterは、MetaTrader 5で価格の裏にある真実の動きを見たいトレーダーのための究極のインジケーターです。POC(ポイント・オブ・コントロール)に基づく買いと売りのアグレッシブな出来高を明確かつ直感的に表示し、各ローソク足の市場の努力と実際の結果を視覚化します。 ️ なぜ重要なのか? すべての出来高が価格を動かすわけではありません!Tape Hunterは、努力(アグレッシブな出来高)が価格を本当に動かしているかを示し、以下を見極めるのに役立ちます: 本当のアグレッションとトラップの位置 市場が吸収されているのか押し込まれているのか 支配的な出来高と価格の方向性の一致 Tape Hunterを使えば、プロのテープリーディング視点を得て、より精度の高いエントリーとエグジットの判断が可能になります。 関連インジケーター – フロー分析を強化 より効率的なトレードのために、Tape Hunterと以下の強力なインジケーターを組み合わせて使いましょう: Big Player
Big Player Range
Thalles Nascimento De Carvalho
5 (3)
BigPlayerRange — MT5向け最強インジケーター BigPlayerRange は、MetaTrader 5 で日経ミニやドル先物などの取引において、 最も効果的なインジケーター と評価されています。大口投資家(機関投資家)の行動を可視化し、高精度なテクニカル分析を可能にします。 どのように機能するのか? BigPlayerRangeは、買い圧力ゾーン(緑ライン)と売り圧力ゾーン(赤ライン)を描画し、価格がその範囲を超えるとトレンド方向への動きを示唆します。 緑のライン上で終値: 買いの勢いが強く、上昇トレンドの可能性。 赤のライン下で終値: 売り圧力が優勢で、下落が予想される。 範囲内での価格: レンジ相場でブレイクを待つ段階。 主なメリット: 機関投資家ゾーンの検出: 大口のエントリーポイントを視覚化。 自動ターゲット計算: 利確ポイントを戦略的に設定。 プルバックの可能性分析: リスク管理に役立つ情報提供。 推奨の使い方: Imbalance DOM Pro と併用してゾーンブレイクを確認。 SwingVolum
VWAP FanMaster
Thalles Nascimento De Carvalho
3.5 (2)
VWAP FanMaster: 正確なプルバック戦略をマスターしよう! VWAP FanMaster は、 正確なエントリーポイント と 効率的なプルバック を求めるトレーダーのための究極のインジケーターです。 VWAP(出来高加重平均価格) と フィボナッチファンライン を組み合わせ、市場での重要な価格ゾーンを明確にマッピングします。 主な機能 シンプルかつ強力 : 垂直線を動かすだけで、自動的に VWAP と フィボナッチファンライン を描画します。 賢いトレーディング戦略 : 描かれたゾーンに価格が戻るのを待ち、 完璧なプルバック をサポートとレジスタンスのレベルで捉えます。 高度なビジュアルツール : 価格のコンフルエンスエリア を即座に見つけて、迅速な意思決定をサポートします。 VWAP FanMasterを選ぶ理由 初心者にも使いやすい 。 2つの強力な分析ツール を組み合わせることで、取引精度を向上させます。 リスク管理を改善 し、明確で一貫した価格予測を提供します。 VWAP FanMasterでトレード戦略を最適化
FREE
Book Data Binance
Thalles Nascimento De Carvalho
Book Data Binance! お気に入りの暗号通貨のオーダーブックにアクセスし、価格、ボリューム、バランスの分析を詳しく知ることができるとしたら、あなたの取引所がDOMへのアクセスを提供していなくてもどうでしょうか? Book Data Binanceを使えば、それが現実になります!このMQL5スクリプトは、市場のダイナミクスを深く理解したい暗号通貨トレーダーのために特別に開発されました。 主な機能: スクリプトメニューで利用可能な任意の暗号通貨のオーダーブックへの直接アクセス。 世界の主要な取引所の1つであるBinanceからのリアルタイムデータの更新。 オーダーブックのバランスを正確に分析し、価格の動きを特定して予測することが可能です。 Imbalance DOM Crypto インジケーター との統合により、市場分析を次のレベルに引き上げます。 なぜBook Data Binanceを選ぶべきなのか? これは、各価格レベルにおける買い手と売り手の行動を理解したい人にとって完璧な補完です!このスクリプトを使用することで、深い洞察を得る
FREE
Volume Flow Binance
Thalles Nascimento De Carvalho
Volume Flow Binance! お気に入りの暗号通貨の times and trades データにアクセスし、取引量の流れや価格の動きを分析する詳細を得られるとしたら、あなたのブローカーが取引履歴の完全なアクセスを提供していなくても、それが現実になると思いませんか? Volume Flow Binance を使えば、それが実現します!この MQL5 スクリプトは、リアルタイムの市場のダイナミクスを詳しく理解したい暗号通貨トレーダーのために設計されています。 主な特徴: スクリプトのメニューにある任意の暗号通貨の times and trades データに直接アクセス。 世界的に有名な取引所 Binance からのリアルタイムデータ更新。 価格の動きを予測し、取引量の流れを正確に分析。 Times and Sales Crypto インジケーター と統合し、市場分析を次のレベルに引き上げます。 なぜ Volume Flow Binance を選ぶべきなのか? これは、リアルタイムで売買行動を理解し、行われた取引を観察するための完璧なツールで
FREE
Cumulative Volume Bands
Thalles Nascimento De Carvalho
CVB Cumulative Volume Bands: 累積ボリュームでトレードを強化! CVB Cumulative Volume Bands は、累積ボリュームに基づく正確なシグナルを求めるトレーダー向けに設計された高度なインジケーターです。 このインジケーターは、累積ボリュームバンドを使用して、買いと売りの圧力を明確に読み取り、反転や強い価格変動を特定するのに役立ちます。 Cumulative Volume Bands for MT5 ! 主な特徴: 累積ボリューム分析 : ボリュームに基づいて重要な圧力点を検出します。 明確なエントリー/エグジットシグナル : リアルタイムでチャンスを捉えます。 簡単な解釈 : ユーザーフレンドリーなインターフェースとシンプルなビジュアル。 全ての資産とタイムフレームに対応 : どの市場でも、いつでも使用可能。 CVB Cumulative Volume Bands で一歩先を行き、自信を持ってトレードの判断を改善しましょう! フィードバックをお寄せいただき、改善にご協力ください!
Footprint Hunter
Thalles Nascimento De Carvalho
Footprint Hunter – MT4で努力と結果を見極めるレーダー Tape Hunterは、MetaTrader 4で価格の裏にある真実の動きを見たいトレーダーのための究極のインジケーターです。POC(ポイント・オブ・コントロール)に基づく買いと売りのアグレッシブな出来高を明確かつ直感的に表示し、各ローソク足の市場の努力と実際の結果を視覚化します。 ️ なぜ重要なのか? すべての出来高が価格を動かすわけではありません!Footprint Hunterは、努力(アグレッシブな出来高)が価格を本当に動かしているかを示し、以下を見極めるのに役立ちます: 本当のアグレッションとトラップの位置 市場が吸収されているのか押し込まれているのか 支配的な出来高と価格の方向性の一致 Tape Hunterを使えば、プロのテープリーディング視点を得て、より精度の高いエントリーとエグジットの判断が可能になります。 関連インジケーター – フロー分析を強化 より効率的なトレードのために、Tape Hunterと以下の強力なインジケーターを組み合わせて使いましょう:
Swing Point Volume
Thalles Nascimento De Carvalho
Swing Point Volume, the indicator that signals weakness and strength at the tops and bottoms. This indicador can be for used the Wyckoff Method. Information provided; - Swing on customized ticks. - Volume and points in each balance sheet. - Percentage of Displacement. - Sound alert option on top and bottom breaks. - Volume in ticks and Real Volume. - Volume HL (extreme) or (opening and closing) - Customized volume shapes.
Atr Projection
Thalles Nascimento De Carvalho
ATRプロジェクション指標は、金融市場における価格の潜在的な動きの限界について正確な洞察を提供するために設計され、テクニカル分析において堅牢なツールとして際立っています。その柔軟なアプローチにより、ユーザーは各取引資産の特定のニーズに適応する形で直感的に分析メトリクスをカスタマイズすることが可能です。 カスタマイズ可能な動作: ATRプロジェクションは、デフォルトでは過去100本のローソク足の平均の30%を考慮して動作します。この柔軟性により、ユーザーは好みや各資産の固有の特性に合わせてメトリクスを調整でき、よりパーソナライズされた分析が可能です。 30%および100本のローソク足の選択の裏にある論理: 慎重な割合とローソク足の数の選択は、過去の動きを正確に捉え、より精密なプロジェクションを提供することを目的としています。この戦略的なアプローチは、価格が有意な動きの可能性が高い領域を強調し、トレーダーにより情報を提供します。 ATRプロジェクションの利点: 1. カスタマイズ可能なテクニカル精度: ユーザーは各取引資産の特定の条件に合わせてメトリクスをカスタマイズできます。
Box Weis Wave
Thalles Nascimento De Carvalho
5 (1)
Weis Wave Box で分析力を高めましょう! 取引における正確さと明確さ を求めるなら、 Weis Wave Box が理想的なツールです。この 高度なボリューム波動インジケーター は、市場における努力と結果のダイナミクスを明確に可視化し、フロー読みやボリューム取引を行うトレーダーに不可欠です。 主な特徴: カスタマイズ可能なボリューム波 – ティック単位で調整し、戦略に合わせられます。 調整可能な履歴 – 特定期間の分析をより精密に行えます。 実際のボリューム vs ティック数 – 市場への実際の影響を理解します。 エナジーボックスの視覚化 – 市場が大きな努力を示し、価格変動が小さい箇所を確認できます。 ️ 5種類のスイング形態 – totalVol、length、width、barDVol、lengthDVolに基づきカスタマイズ可能。 実際のメリット: ボリューム論理の視覚的明確化 買い手・売り手の力関係の把握 反転や継続の可能性を示す視覚的シグナル 関連インジケーター Big Player Range – 機関投資家の活動ゾーン
Long Short Pro
Thalles Nascimento De Carvalho
Long & Short インジケーター - Pro バージョン: 市場分析の無限の可能性を解き放とう! すべての資産に制限なし Long & Short インジケーターの Pro バージョンは、すべての金融資産に対して完全な自由を提供します。制限なしで、同じインジケーターをお気に入りのすべての資産に適用できます! 制限なし インジケーターのすべての機能を制限なしでお楽しみください。Pro バージョンは、完全かつ無制限の体験を提供し、市場のあらゆる機会を最大限に活用できるようにします。 Pro バージョンの特徴 無制限のアクセス : インジケーターをすべての金融資産で使用し、その完全な可能性を探ります。 高度な精度 : 詳細な分析と明確なシグナルを活用して、情報に基づいた安全な決定を下すことができます。 完全な柔軟性 : 資産や戦略に関係なく、取引のニーズに合わせてインジケーターを調整します。 重要な機会のアラートを受け取る アラートを有効にして、重要なレベルを注意深く監視し、市場機会の最前線に立ち続けましょう。 EA 作成のためのバッファパラメ
AI Channel
Thalles Nascimento De Carvalho
AI Channel | MT5向け人工知能搭載の価格チャネル分析インジケーター AI Channel:人工知能でテクニカル分析を次のレベルへ AI Channel は、金融市場の価格チャネルを分析するために 人工知能 を活用した強力なツールです。このセクションでは、この革命的なインジケーターが投資家やトレーダーにどのように役立つかを詳しく解説します。 AI Channelとは? AI Channel は、高度な人工知能アルゴリズムで開発されたインジケーターです。過去の価格データを使用して取引チャネルを識別し、グラフ上の重要なサポートとレジスタンスレベルを強調表示します。 この分析に基づき、市場のエントリーやエグジットの可能性があるポイントに関する貴重なインサイトを提供します。 ️ AI Channelの仕組み AI Channelは価格チャネルに人工知能を適用し、資産のトレンド、パターン、過去の動きを分析します。市場の変化に動的に対応し、異なる時間軸や資産に適応します。 チャネルの上限と下限を特定し、トレーダーに反転やトレンド継続の可能性を明確に示しま
Didi Index Volume
Thalles Nascimento De Carvalho
Didiインデックスボリュームをご紹介します。これは、ブラジルのトレーダーであるオディール・アギアールによって開発されたテクニカル分析の指標であり、金融市場での機会を特定するための先進的かつ強力なアプローチで注目されています。さまざまなプラットフォームで利用可能なDidiインデックスボリュームは、正確な洞察と貴重な情報を求めるトレーダーにとって不可欠なツールとなっています。 この指標は、オディール・アギアールによって作成された名高いDidiインデックスと、取引量の知恵を駆使した組み合わせです。この組み合わせにより、価格の動向と取引量の相互作用をより深く分析し、資産の動きに対するユニークな視点を提供します。 洗練されたアルゴリズムと加重平均の計算を用いて、Didiインデックスボリュームは取引量に基づいた価格変動を予測することができます。この特徴は、新興トレンドの特定、市場の反転、そして適切なエントリーポイントや出口ポイントのタイミングを把握する上で非常に重要です。 Didiインデックスボリュームを使用することで、正確な市場の解釈が可能な客観的かつ信頼性の高い情報にアクセスできます。
TimeChannel
Thalles Nascimento De Carvalho
The "Timechannel" is a powerful technical analysis tool designed specifically for traders who want to gain deeper and more accurate insights into price movements across multiple timeframes (multi-timeframe). This indicator is an essential addition to the toolbox of any serious trader seeking to make informed and data-driven trading decisions. Key Features: Advanced Multi-Timeframe Analysis : Timechannel allows traders to analyze price movements on different timeframes simultaneously. This is cr
Master OBV
Thalles Nascimento De Carvalho
MasterOBV:市場のトレンドを正確に把握しよう! MasterOBV は、 ボリューム 、 ポジティブコレレーション 、および 移動平均線(MA) を組み合わせた テクニカル分析指標 で、金融市場でのトレンドの識別を向上させます。 主な機能: スマートボリューム: 取引量を分析し、トレンドの強さにおける重要な変化を特定します。 ポジティブコレレーション: 相関のある資産を組み合わせ、ペアのボリュームに基づいて価格の移動の可能性を強化する、より広範で正確な視点を提供します。 ビジュアルチャンネル: ビジュアルチャンネルを利用して、トレンドの継続と反転の可能性を明確かつ正確に評価し、直感的な視覚分析を提供します。 スムーズな移動平均線: MA が価格の変動を平滑化し、基礎的なトレンドの方向を特定しやすくします。 なぜ MasterOBV を選ぶべきか? 決定の自信: 複数の要素を統合し、自信を持ってエントリーとイグジットの決定ができるようにします。 包括的な分析: 価格だけでなく、ボリューム、資産の相関関係、およびビジュアルチャンネ
VolaMetrics VSA
Thalles Nascimento De Carvalho
VolaMetrics VSA | 技術分析の強力な味方 VolaMetrics VSA は、 Volume Spread Analysis (VSA) メソッドと詳細な 取引量分析 を組み合わせた技術分析指標です。 価格の重要な動き を 特定 し、 追跡 するために設計されたこのツールは、 取引量 と 価格スプレッド の相互作用を利用して、トレーディング決定をサポートする貴重な洞察を提供します。 Volume Spread Analysis (VSA) の基礎 Volume Spread Analysis (VSA) は、技術分析で尊敬されているメソッドで、 取引量 、 価格スプレッド 、および 価格の終値 の関係を特定の期間内で理解することに焦点を当てています。最も情報を持つオペレーター( スマートマネー )が価格の動きに影響を与えるという考えに基づき、VSA は 積み上げまたは分配のシグナル を特定し、価格の重要な変化を予測します。 VolaMetrics VSA の機能 ️ VolaMetrics VSA は、従来の VSA 分析を自動化し、 逆転の可能性があるシ
CVD SmoothFlow Pro
Thalles Nascimento De Carvalho
CVD SmoothFlow Pro - すべての資産に対応した無制限のボリューム分析! CVD SmoothFlow Pro は、精密で無制限のボリューム分析を求めるトレーダーに最適なソリューションです。Cumulative Volume Delta(CVD)の計算と高度なノイズフィルタリングを使用することで、プロ版はあらゆる金融資産の取引に必要な柔軟性と精度を提供します。 CVD SmoothFlow Pro が提供するもの: クリアな分析 :ノイズをフィルタリングし、すべての金融資産における重要なボリュームの動きを際立たせます。 ️ 正確な計算 :買いと売りの差を監視し、外為、インデックス、暗号通貨などの資産におけるボリュームの詳細な動きを提供します。 直感的なインターフェース :データの表示が明確で、分析がわかりやすく効率的です。 トレンドの特定 :市場のトレンドを自信を持って特定し、情報に基づいた意思決定をサポートします。 実用的な用途: リアルタイムで任意の資産における買い手と売り手のバランスを監視します。 ボリュームに基づいてトレンドの反転
Imbalance DOM Pro
Thalles Nascimento De Carvalho
5 (1)
Imbalance DOM Pro:注文帳の不均衡でトレードを強化 MT5で注文帳にアクセスできますか?トレードを新たなレベルに引き上げたいですか? 注文フローを基に意思決定を行っているトレーダーであれば、Imbalance DOM Proはあなたの分析を変革します。スキャルパーや短期トレーダー向けに設計されたこのツールは、注文帳の不均衡を特定し、迅速かつ正確な取引のための貴重な機会を提供します。 小さな価格変動でのチャンスを捉える Imbalance DOM Proは、価格の小さな動きをキャッチしたいトレーダーに最適なツールです。高度な計算により、このインジケーターは注文帳の不均衡を解釈し、素早いエントリーとエグジットのための重要なインサイトを提供します。 重要:MT5で注文帳が利用できることを確認してください Imbalance DOM Proを使用する前に、あなたのブローカーがMT5で注文帳にアクセスできることを確認してください。このインジケーターはリアルタイムデータに依存しているため、MT5は注文帳の履歴を保存しません。そのため、Imbalance D
Cumulative Vol Bands
Thalles Nascimento De Carvalho
CVB Cumulative Volume Bands: 累積ボリュームでトレードを強化! CVB Cumulative Volume Bands は、累積ボリュームに基づく正確なシグナルを求めるトレーダー向けに設計された高度なインジケーターです。 このインジケーターは、累積ボリュームバンドを使用して、買いと売りの圧力を明確に読み取り、反転や強い価格変動を特定するのに役立ちます。 主な特徴: 累積ボリューム分析 : ボリュームに基づいて重要な圧力点を検出します。 明確なエントリー/エグジットシグナル : リアルタイムでチャンスを捉えます。 簡単な解釈 : ユーザーフレンドリーなインターフェースとシンプルなビジュアル。 全ての資産とタイムフレームに対応 : どの市場でも、いつでも使用可能。 CVB Cumulative Volume Bands で一歩先を行き、自信を持ってトレードの判断を改善しましょう! フィードバックをお寄せいただき、改善にご協力ください!
ZigWave Oscillator
Thalles Nascimento De Carvalho
ZigWave Oscillator: オシレーターとZigZagで取引を強化! ZigWave Oscillatorは、金融市場分析において精度と明瞭さを求めるトレーダーに最適なツールです。このインジケーターは、オシレーターの強みとZigZagの視覚的なシンプルさを組み合わせ、迅速かつ効率的に最適な売買機会を見つけるのに役立ちます。 ZigWave Oscillatorを選ぶ理由 精密なオシレーター分析 : RSI、Williams %R、またはCCIを統合し、市場の主要な動きをキャッチします。 動的なZigZagと精密調整 : ZigZagのスイングは、オシレーターの買われすぎや売られすぎの領域で微調整され、反転ポイントを明確に示します。 完全なカスタマイズ ️: オシレーターとZigZagの設定を調整し、自分の戦略に合わせて最適化できます。 直感的で使いやすいデザイン エレガントでカスタマイズ可能なビジュアルレイアウトにより、ZigWave Oscillatorは市場のシグナルを簡単に読み取ることができ、取引に集中できます。 全てのアセット
Times and Sales Pro
Thalles Nascimento De Carvalho
Times and Sales Pro: 取引フローの不均衡であなたの取引を強化 小さな価格変動のチャンス Times and Sales Pro は、 Times and Trades に基づいて注文フローを操作するアナリストにとって欠かせないツールです。スキャルパーに最適で、高精度で小さな価格変動を活用したい方のために設計されています。高度な計算を使用して、このインジケーターは取引の不均衡を特定し、迅速なエントリーとエグジットのための貴重なシグナルを提供します。 重要: MT5でのTimes and Tradesの可用性 Times and Sales Pro を使用する前に、ブローカーがMT5で Times and Trades へのアクセスを提供していることを確認してください。このインジケーターは、正確なリアルタイム計算を生成するためにこのデータに依存しており、MT5は取引履歴を保存しません。したがって、このインジケーターはリアルタイムでのみ機能し、市場で実行された取引の即時の洞察を提供します。 Times and Sales Proの利点 明確
Mini Indice Composition
Thalles Nascimento De Carvalho
Mini Índice Composition: A Revolução na Análise do Mini Índice! O Mini Índice Composition é um indicador inovador que monitora em tempo real as principais ações que compõem o mini índice, trazendo uma visão quantitativa poderosa sobre o fluxo de ordens do mercado! Como Funciona? Diferente de outros indicadores que utilizam apenas dados históricos, o Mini Índice Composition faz uma leitura ao vivo das ordens que entram e saem das ações, pesando o impacto direto no mini índice. Com
Radar DI
Thalles Nascimento De Carvalho
Radar DI – Indicador de Taxa de Juros para Mini Índice e Mini Dólar com Exportação CSV e Integração IA Radar DI é um indicador especializado que transforma as variações da taxa de juros DI (Depósitos Interfinanceiros) em sinais operacionais estratégicos para os ativos mini índice (WIN) e mini dólar (WDO) . NOVA FUNCIONALIDADE: Exportação CSV + Integração com IA Agora o Radar DI permite exportar todos os dados em formato CSV , incluindo: Variações dos DIs Variação do Mini Índice (WIN)
LSTM Library
Thalles Nascimento De Carvalho
LSTM Library - MetaTrader 5用高度神経ネットワーク アルゴリズム取引のためのプロフェッショナル神経ネットワークライブラリ LSTM Libraryは、MQL5の取引戦略にリカレントニューラルネットワークのパワーをもたらします。このプロフェッショナルレベルの実装には、通常は専門的な機械学習フレームワークでしか見られない高度な機能を備えたLSTM、BiLSTM、GRUネットワークが含まれています。 "トレーディングにおける機械学習の成功の秘訣は、適切なデータ処理にあります。 Garbage In, Garbage Out –予測の品質はトレーニングデータの品質を超えることはありません。" — マルコス・ロペス・デ・プラド博士, Advances in Financial Machine Learning 主な機能 LSTM、BiLSTM、GRUの完全実装 より良い一般化のためのリカレントドロップアウト 複数の最適化アルゴリズム(Adam、AdamW、RAdam) 高度な正規化テクニック 包括的な評価指標システム トレーニング進捗の可視化 クラス重みによる不均衡デー
フィルタ:
レビューなし
レビューに返信