PZ Divergence Trading MT5
- インディケータ
- バージョン: 15.0
- アップデート済み: 19 7月 2024
- アクティベーション: 20

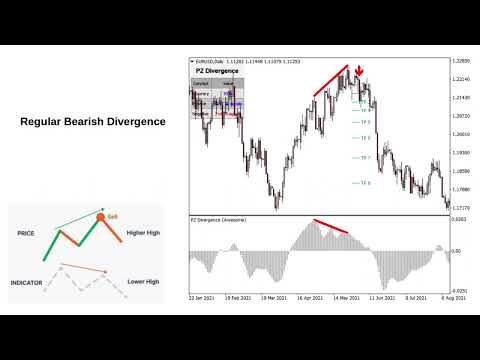
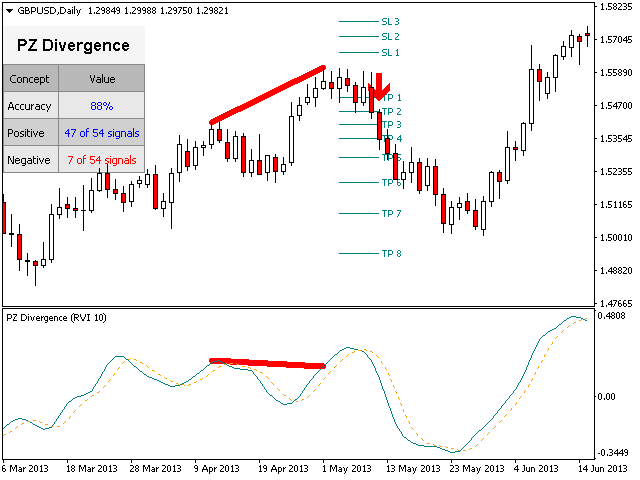
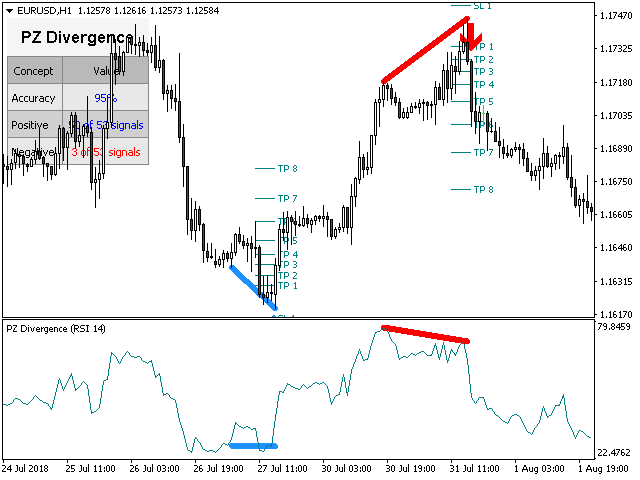
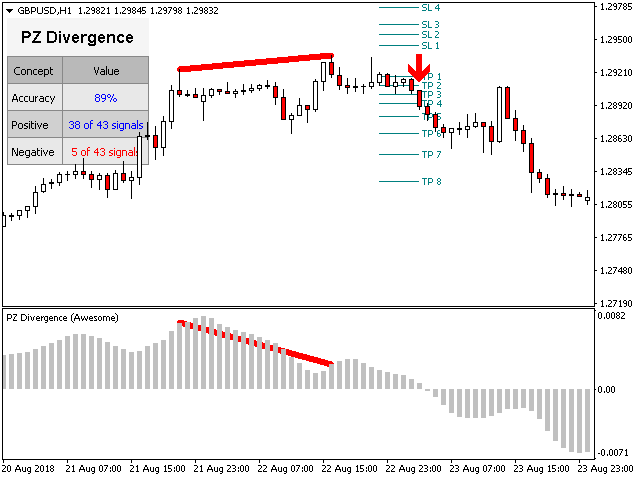
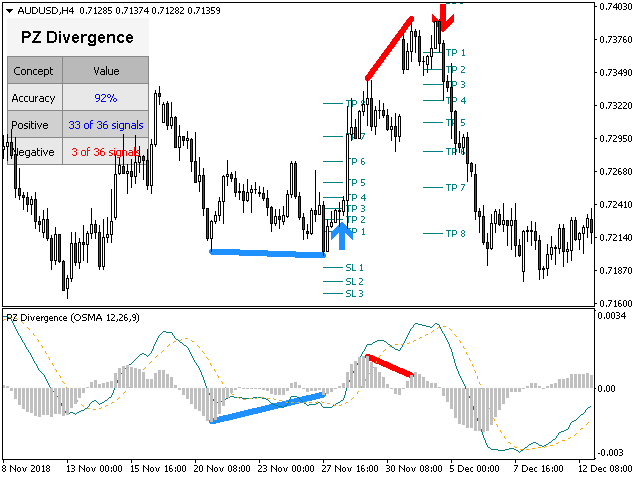
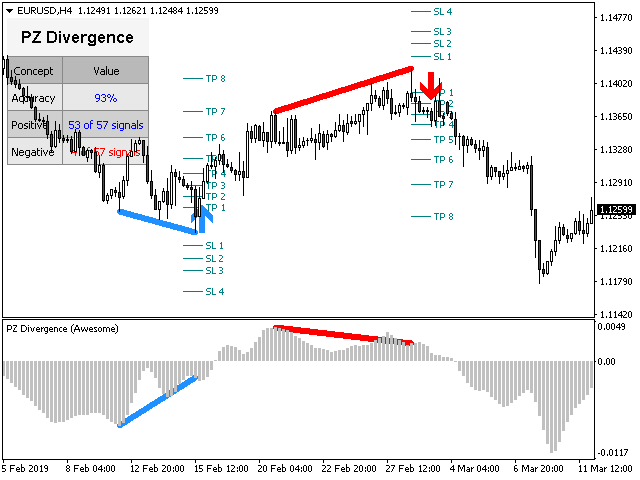
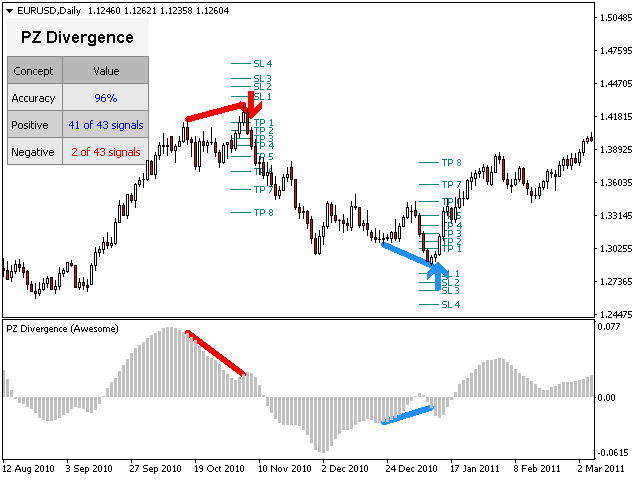
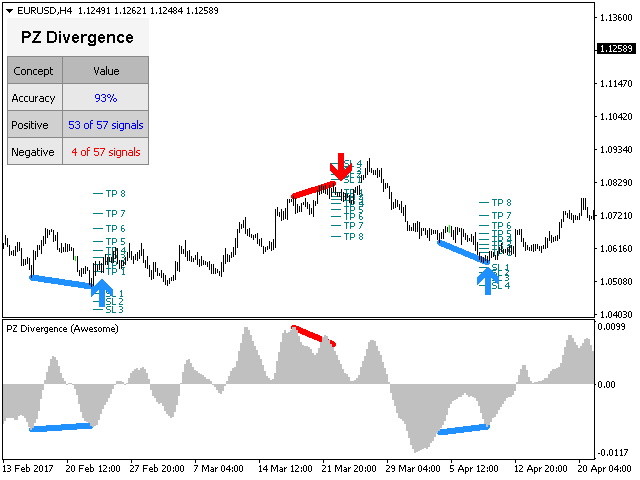
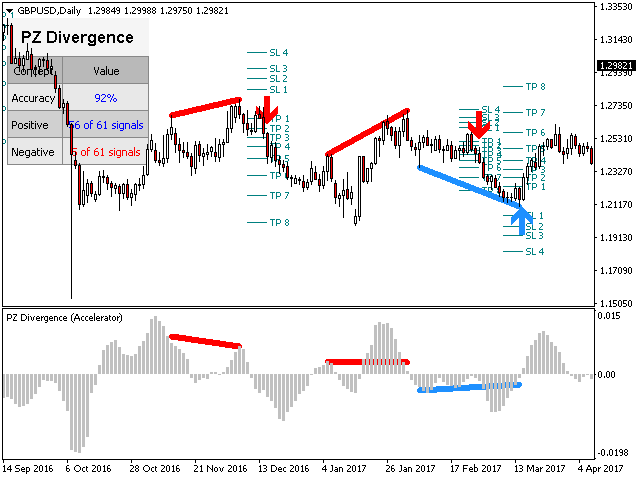
発見が困難で頻度が少ないため、分岐は最も信頼できる取引シナリオの1つです。このインジケーターは、お気に入りのオシレーターを使用して、通常の隠れた分岐点を自動的に見つけてスキャンします。
[ インストールガイド | 更新ガイド | トラブルシューティング | よくある質問 | すべての製品 ]
- 取引が簡単
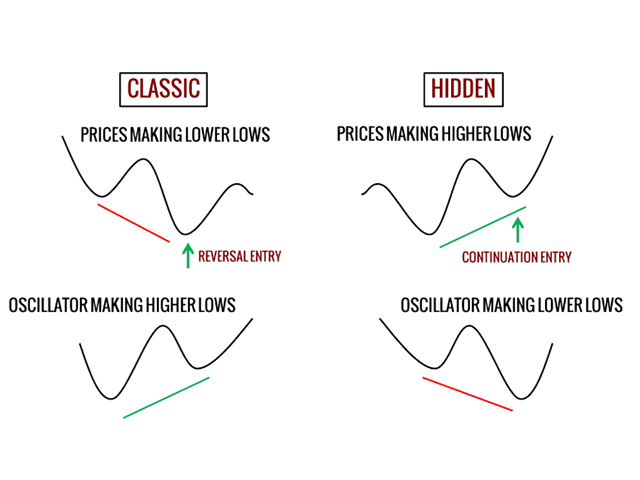
- 通常の隠れた発散を見つけます
- 多くのよく知られている発振器をサポート
- ブレイクアウトに基づいて取引シグナルを実装します
- 適切なストップロスおよび利益レベルを表示します
- 設定可能なオシレーターパラメーター
- カスタマイズ可能な色とサイズ
- バー単位でサイズ別に分岐をフィルタリング
- パフォーマンス統計を実装します
- 電子メール/音声/視覚アラートを実装します
幅広い市場の見通しを提供するために、異なるオシレーターを使用して、干渉なしで同じチャートにインジケーターを何度もロードできます。このインジケーターは、次のオシレーターをサポートしています。
- RSI
- CCI
- MACD
- オスマ
- 確率的
- 勢い
- 素晴らしい発振器
- 加速器発振器
- ウィリアムズパーセントレンジ
- 相対活力指数
特に外国為替市場では、乖離がかなり拡大する可能性があるため、この指標はねじれを実装しています。取引を合図する前に、ドンチャンブレイクアウトが発散を確認するのを待ちます。最終結果は、非常に信頼性の高い取引シグナルを備えた再描画インジケーターです。
入力パラメータ
- 振幅:発散を見つけるために使用されるジグザグ周期
- オシレーター-チャートにロードするオシレーターを選択します。
- ブレークアウト期間-取引シグナルのバーでのブレークアウト期間。
- 発散タイプ-発散タイプを有効または無効にします:非表示、通常、または両方。
- バーの最小発散サイズ-発散を表示するためのバーの最小サイズ。
- バーの最大発散サイズ-表示される発散のバーの最大サイズ。
- 最大履歴バー-インジケーターが読み込まれたときに評価するバーの量。
- インジケーターの設定-関係するすべてのオシレーターに必要なインジケーターの設定。
- RSI期間
- CCI期間
- WPR期間
- 運動量期間
- 確率的期間
- MACD設定
- RVI期間
- 描画設定-分岐の色と線のサイズを選択します。
- アラート-すべての種類のアラートを有効または無効にし、さらにカスタムアラートテキストを設定します。
著者
ArturoLópezPérez、個人投資家および投機家、ソフトウェアエンジニア、Point Zero Trading Solutionsの創設者。


Good indicator. Thank you