YouTubeにあるマーケットチュートリアルビデオをご覧ください
ロボットや指標を購入する
仮想ホスティングで
EAを実行
EAを実行
ロボットや指標を購入前にテストする
マーケットで収入を得る
販売のためにプロダクトをプレゼンテーションする方法
MetaTrader 5のためのテクニカル指標 - 88

This indicator uses candle stick patterns and moving averages to determine trend , the candle sticks patterns it uses are harami Bull harami Bear Bullish Engulf Bearish Engulf this can both be used to catch trends and also for sculping it has 2 take profits and 2 stop losses which can be turned off if they are not ideal for you. the reward parameter is used to scale the take profit lines , if reward is 2 then the take profit will be 2 times the stoploss the are mobile alerts and terminal alerts

The best instrument for scalping. It allows you to always be correctly positioned in the price. It's a simple and extraordinarily powerful visual reference. Very suitable for price action. It consists of four components. 1. Fork. There are two levels that surround the price and mark the rebound points. They can be varied independently with 4 associated controls, two for each level. Its amplitude is indicated in pips in the indicator data. The minimum fork is updated with each tick. It has
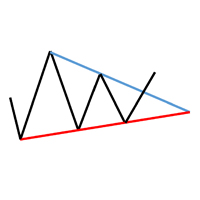
The TrianglesPro indicator for MetaTrader5 draws triangles on the chart based on the local highs and lows. The length of the trendlines can be limited. Optionally, you can display the highs and lows that are used to determine the triangles. It is also possible to determine how far back the identification of triangles should start. Also check out my other indicators.
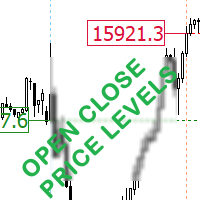
This indicator displays the open and closing price for the selected number of days. Easily identify market open and close Gaps. Select the Day icon to show the open and closing price line. Select the Time icon to show the open and closing hours. Indices and stocks are not a 24hour market as shown on MT5 charts, they open and close at specific times. Marketplace
Time Zone
Trading Hours
New York Stock Exchange (NYSE)
EDT
9:30 a.m. to 4:00 p.m.
Nasdaq Stock Market
EDT
9:30 a.m. to 4:00 p.m.

The fate of a trade depends on knowing the direction of the price trend. Whatever style you trade, you must know that the direction of the main market trend is in the hands of buyers or sell
YZD Trend indicator helps you to find the main direction by using mathematical parameters and ATR This indicator is a good supplement for your strategy, especially price action, which can reduce your trade losses.
How to use: YZD Trend indicator consists of two ranges in the form of bands, when the p

Indicator introduction: A channel and trend line indicator, which is a good tool for manual trading, and also can be used for creating new EAs, without drifting or repainting. It applies to any timeframes and any symbols. The work of the indicator is shown in the screenshots. For any novice and programming trading friend, you can write the signal into the EA to play freely, buffer 0 corresponds to the bold trend line, buffer 4 and 5 respectively corresponds to the channel's upper and lower f
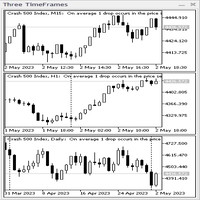
3 つの TimeFrames インジケーター パネル。 インジケーターは、CAppDialog クラスに基づいたパネルの形式で作成されます。パネルは、マウスを使用して最小化したり、現在のチャート上で移動したりできます。 このインジケーターは、パネル内の現在のシンボルの 3 つのタイムフレームを表示します。 現在のバージョンでは、インジケーターには最小限の設定数があります。これらは、「若いタイムフレーム」、「 中間の タイムフレーム 」、「 古い タイムフレーム 」 の 3 つのタイムフレームのパラメーターです 。 インジケーター パネルを起動すると、現在のチャートからすべてのプロパティが自動的にコピーされ、それらが 3 つの時間枠 (たとえば、背景色、バーの色、グリッド、期間区切り記号、ボリュームなど) に適用されます。ただし、インジケーターパネルは、3 つの時間枠のエキスパートアドバイザーやその他のインジケーターをコピーしません。 現在のチャートのプロパティを変更した場合、3 つの時間枠に対する変更は、インジケーター パネルを削除して再接続した後、または現在のチャートの時間枠を切り

The indicator calculates fractal lines, which are technically psychological support/resistance lines. In fact, these are the highs and lows of the price over a period of time. The indicator works on all charts and timeframes. Settings: Fractal Candels - number of candles from which a fractal is built. Calculates the maximum/minimum at which a psychological price can be set. Rigth Candels - number of candles based on which false fractals are filtered to the right of it Left Candels - number of ca

--- StudentK Sync Chart --- 1. Move charts at the same time 2. Cross check among different Symbols and Timeframes 3. Plan your own trading strategies
--- Context --- StudentK is not indicated as a master or K Sir for knowledgeable person who claims for winning all the time. (But lots of traders should know the fact that it is rarely truth, especially in fluctuated period of time)
StudentK is a group of years-experienced traders who want to share amazing tools in Free and Paid versions. Aiming

Nadaraya-Watson Envelope Indicator convert to MT5 Nadaraya Watson Envelope Indicator is one of the monst popular indicator in TradingView. TradingView(Chrome, Edge) eats a huge of CPU, so I convert this to MT5 version.
As you can see the screenshot, it's good with Schaff trend RSI Indicator (or others) If you want to get Schaff trend RSI Indicator , Link: https://www.mql5.com/en/market/product/98011
Window Size - determines the window size for calculating smoothed values. A larger window siz

There are many linear regression indicators out there, most of them draw lines or channels, but this one actually draws a chart. The beauty of the indicator like Heiken Ashi is it removes a lot of market noise. 4 (OHLC) arrays are filled with Linear Regression(LR) values of each price for the LR period (default=14). The period of the Linear Regression is adjustable dependant on the market conditions. The SMA (default=14) also has period adjustment. Candles are generated with Green for 'Up' cand
Schaff trend RSI indicator (It is related with EMA and RSI) It is suited for sub-Indicator to undertand trend(or direction change)
As you can see the screenshot, it's good with Nagaraya-Watson Envelope Indicator (or others) I am using this indicator as Screenshot setting. (Schaff value is default value. 23, 50, 9, close) If you want to get Nagaraya-Watson Envelope, Link: https://www.mql5.com/ko/market/product/97965
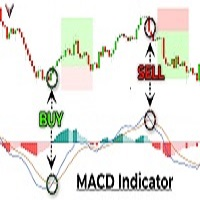
The MACD Gold Scalping Indicator is a powerful tool designed to help traders like you extract profits from the gold market. This indicator is based on the popular Moving Average Convergence Divergence (MACD) indicator, but it's been customized specifically for trading gold. When you use this indicator, you'll be able to quickly identify key entry and exit points in the gold market. It uses a combination of trend analysis, momentum indicators, and support and resistance levels to generate highly

The Off Trend MT5 Forex Indicator is a trend-following tool. Its signals are presented in the cloud. When the cloud is green, the trend momentum is bullish, and traders should take buy opportunities. Conversely, the trend momentum is bearish when the cloud is pink, and traders should take sell opportunities. The Off Trend mt5 Forex Indicator fits all timeframes and mt4 currency pairs.

This MT5 version indicator is a unique, high quality and affordable trading tool. The calculation is made according to the author's formula for the beginning of a possible trend. MT4 version is here https://www.mql5.com/ru/market/product/98041 An accurate MT5 indicator that gives signals to enter trades without redrawing!
Ideal trade entry points for currencies, cryptocurrencies, metals, stocks, indices! The indicator builds buy/sell arrows and generates an alert. Use the standart B
Detector Fix indicator.
Currency pairs never rise or fall in a straight line. Their ups and downs are interspersed with rollbacks and reversals. Every rise and fall is reflected in your emotional state: hope is replaced by fear, and when it passes, hope appears again. The market uses your fear to prevent you from taking advantage of a strong position. At such moments you are most vulnerable.
Everything will change if you use the Detector Fix indicator.
The Detector indicator was created to n

--- StudentK RVI --- 1. Advanced strategy based on RVI 2. EA adapted (especially for StudentK's EA)
--- Context --- StudentK is not indicated as a master or K Sir for knowledgeable person who claims for winning all the time. (But lots of traders should know the fact that it is rarely truth, especially in fluctuated period of time)
StudentK is a group of years-experienced traders who want to share amazing tools in Free and Paid versions. Aiming helping people getting out of "The Rat Race" by u
--- StudentK CCI --- 1. Advanced strategy based on CCI 2. EA adapted (especially for StudentK's EA)
--- Context --- StudentK is not indicated as a master or K Sir for knowledgeable person who claims for winning all the time. (But lots of traders should know the fact that it is rarely truth, especially in fluctuated period of time)
StudentK is a group of years-experienced traders who want to share amazing tools in Free and Paid versions. Aiming helping people getting out of "The Rat Race" by u

--- StudentK MACD --- 1. Advanced strategy based on MACD 2. EA adapted (especially for StudentK's EA)
--- Context --- StudentK is not indicated as a master or K Sir for knowledgeable person who claims for winning all the time. (But lots of traders should know the fact that it is rarely truth, especially in fluctuated period of time)
StudentK is a group of years-experienced traders who want to share amazing tools in Free and Paid versions. Aiming helping people getting out of "The Rat Race" b

The main purpose of this indicator is to determine the moments of entries and exits from transactions, so the Trend Factorial indicator displays only the trend line and entry points, i.e. it displays market entry points.
Despite the apparent simplicity of the indicator, it has complex analytical algorithms inside, with the help of which the system determines the moments of entries.
The indicator gives accurate and timely signals to enter and exit a trade that appear on the current candle.
Us
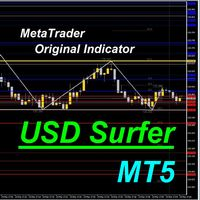
Based on data from the Bank for International Settlements, 78.8% of the world's major 8 currency pairs can be checked instantly. It tells you whether the U.S. dollar is being bought or sold in a matter of seconds. So, even in the fast-moving phase after the release of economic indicators, you can see the flow and pushes of the U.S. dollar,
We are live-streaming the actual operation of the system. Please check for yourself if it is usable. Please check it out for yourself. https://www.youtube.c
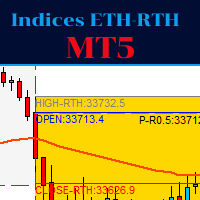
This indicator is for trading indices.
The RTH sessions (regular trading hours) where the underlying cash market is open are distinguished from ETH: for example for the American indices from 9:30 to 16:15 East Coast (New York) time, while for the Dax from 09:00 to 17:35 CET.
For the ETH session (outside RTH) the Fibonacci levels are plotted, as well as sensitive levels such as 25,50,75% retracement from the minimums and maximums.
Also for the RTH session the Fibonacci levels are graphed, as
JPYTraderSR は、 JPYTrader Expert Advisor 専用のシンプルなサポートとレジスタンスのインジケーターです。 いつでも市場構造を形成するサポートとレジスタンスのレベルを示すことにより、エキスパートアドバイザーに追加の確認を提供します。 JPYTrader に複数の合流基準を提供することが唯一の目的であるため、このインジケーターに提供される設定はありません JPYTraderSR wa, JPYTrader Expert Adviso r sen'yō no shinpuruna sapōto to rejisutansu no injikētādesu. Itsu demo ichiba kōzō o keisei suru sapōto to rejisutansu no reberu o shimesu koto ni yori, ekisupātoadobaizā ni tsuika no kakunin o teikyō shimasu. JPYTrader ni fukusū no gōryū kijun o teikyō suru koto

Market Viewer gives a quick glance on correlation and direction. This indicator takes a list of symbols (max 8) Leave a symbol setting empty if you wish not to use that many - like in the defaults… It will check for each timeframe (Monthly, Weekly, Daily, H4, H1, 30min, 15min, 5min and 1min) if the current candle on that timeframe is bullish or bearish. This will give a good indication of the direction for us to trade in. We need to be in sync with the bigger timeframes.

Max Min Reversal Arrows MT5 - an arrow reversal indicator for predicting price movement. The indicator is built on the support and resistance levels at the local lows and highs of the price. Product features
Arrows appear on the current candle. The indicator does not redraw.
Can be used on all time frames and trading instruments. Recommended timeframes to use M30, H1, H4.
The dotted lines are the support and resistance levels within the signal. Price movement from these levels means a reversa

Introducing the POWER TRADE indicator created by a small group of traders with a few years trading trading the financial market profitably . This is a plug and play indicator that provides you with POWERFUL Entry signals with Profit Taking and rebound zones. The indicator Works with all MT5 trading instruments. The indicator uses previous chart data as receipt to speculate on future market moves.

当社の製品を使用する前に、英語の免責事項を注意深くお読みください。当社の製品は、市場の潜在的なトレンドや価格の動きに関する情報を提供するために設計されています。しかしながら、当社の製品を利用することによって特定の結果を保証することや、利益を保証することはできません。金融市場取引にはリスクが伴いますので、慎重にご判断いただき自己責任でご利用いただくようお願い申し上げます。詳細については、英語の免責事項をご参照ください。
当社の製品を使用する前に、英語の免責事項を注意深くお読みください。当社の製品は、市場の潜在的なトレンドや価格の動きに関する情報を提供するために設計されています。しかしながら、当社の製品を利用することによって特定の結果を保証することや、利益を保証することはできません。金融市場取引にはリスクが伴いますので、慎重にご判断いただき自己責任でご利用いただくようお願い申し上げます。詳細については、英語の免責事項をご参照ください。
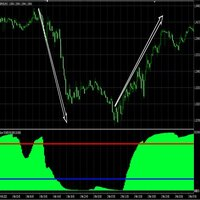
Absolute High Low indicator is a discretionary tool for assessing extremes in the price. It is very self-explanatory, and you can test against other default oscillators to see the difference. Combine with your trend following systems to master entry and exit at extremes. Back test and study the indicator to see the results up against a system or indicator. The indicator calculates a number of max bars so a gap will appear at the end, and it will restart. MT4 Version: https://www.mql5.com/e

This is a predictive indicator ( leading indicator ) that uses Bayes' formula to calculate the conditional probability of price increases given the angular coefficient. The indicator calculates the angular coefficient and its regression and uses it to predict prices.
Bayes' theorem is a fundamental result of probability theory and is used to calculate the probability of a cause causing the verified event. In other words, for our indicator, Bayes' theorem is used to calculate the conditional pro

The Visual Volatility Clustering indicator clusters the market based on volatility. The indicator does not redraw and gives accurate data, does not use closing prices. Uses the opening prices or the highs or lows of the previous completed bar. Therefore, all information will be clear and unambiguous. The essence of the indicator is to divide the price market into certain areas according to a similar type of volatility. This can be done in any way. In this example, the indicator is configure

The Visual Volatility Clustering indicator clusters the market based on volatility. The indicator does not redraw and gives accurate data, does not use closing prices. Uses the opening prices or the highs or lows of the previous completed bar. Therefore, all information will be clear and unambiguous. The essence of the indicator is to divide the price market into certain areas according to a similar type of volatility. This can be done in any way. In this example, the indicator is configure

This is an Immediate Reversal Indicator, a powerful tool designed to help traders and investors to identify trend reversal points in the financial market quickly and efficiently.
Indicator Description: Our immediate reversal indicator is an arrow based on a combination of technical analysis and advanced algorithms, which aims to identify the moments when a market trend is about to reverse, can be used in all TimeFrames, can configure to send an alert when the signal appears. It is designed to
Provlepsisインジケーターへようこそ。
「Provlepsis」は、MQLマーケット向けに設計された高度なインジケーターです。 同じ時間帯の過去のローソク足を分析することで、市場の動きの潜在的な範囲を正確に計算し、将来の価格変動に関する貴重な洞察を提供します。 従来のATRインジケーターとは異なり、「Provlepsis」は時間の要素を考慮に入れており、異なる市場状況に適応するより強力なツールとなっています。 夜間には狭い範囲を予測し、活発な取引時間帯ではより広い範囲を予測します。 「Provlepsis」による包括的な範囲分析で、トレード戦略に競争力を持ちましょう。 最初の20ダウンロードの価格:35.00ドル
次の価格:60.00ドル
なぜProvlepsisを使用するのか
レンジベースのトレード:市場の動きの潜在的な範囲を特定する能力は、レンジベースのトレード戦略にとって価値があります。トレーダーは、指標を使用して予測される範囲内の主要なサポートとレジスタンスレベルを特定し、それに応じて取引を実行することができます。 ボラティリティ分析:時間要素を考慮することで、「

Pack Volatility 75 1/3 In this indicator stage 1 I am pleased to present you the volatility 75 Buy/Sell Professional indicator. where in each temporary structure it will mark a sale and a safe purchase to operate manually, where the strategy is based on the lines EMA of 7 exponential periods and the EMA of 50 exponential periods. where purchasing a product comes 2 as a gift (it's the pack) purchasing any of the 3 products will be sent the remaining indicators, to be able to apply the strategy we

The Your Trend indicator not only signals an immediate buy or sell. It indicates a short-term and long-term trend. operations. The simplest way to use the indicator is to open a trade in the direction of an existing trend. The indicator allows you to study the real and historical market trends in more detail! Shows the opening points of transactions for sale or purchase, and also indicates the direction of the trend on: short-term and long-term periods. The analysis is based on the selected tim
On this occasion I am pleased to present the (Boom 300 Professional Pack) where it consists of 4 indicators for the Boom 300 index of synthetic indices (Deriv Broker) Acquiring this indicator enables you the pack of the 4 boom 300 indicators where the rest of the indicators will be sent, This indicator is 1 of the 4 that includes the Buy/Sell strategy, sending you clear alerts where there buy or sell the pair It is recommended to use in a period of 15 minutes, to have a greater profit since the
Professional Pack Crash 300 Indicators, On this occasion I present the trend indicator that is for the crash index 300 (Deriv Broker) The indicator consists of a strategy where trends are caught in periods of 15 minutes, very clearly the indicator shows the purchase marking the tip of red until the trend develops, and then mark the green point of purchase, it is very simple to use, It is recommended to use in that temporality since it serves to catch longer trends and increase profit, the indica
Channel Stochastic Boom 1000 I am pleased to present the pack (Tendence Boom 1000) where on this occasion I present the Channel Stochastic Boom 1000 indicator for (Deriv Broker) where is 1 of the 4 indicators that the pack brings! The indicator consists of the sthochastic strategy, where it reaches the point of (0 Level) the purchase is made, taking advantage of hunting spike, where it reaches the point of (90 Level) the sale is made taking advantage of the trend candles! It is used in 1 minute

The Fisher Transform is a technical indicator created by John F. Ehlers that converts prices into a Gaussian normal distribution. The indicator highlights when prices have moved to an extreme, based on recent prices. This may help in spotting turning points in the price of an asset. It also helps show the trend and isolate the price waves within a trend. The Fisher Transform is a technical indicator that normalizes asset prices, thus making turning points in price clearer. Takeaways Turning poi

"Advanced Daily VWAP with Standard Deviation and Trading Bands" Description: "The 'Advanced Daily VWAP with Standard Deviation and Trading Bands' indicator offers a comprehensive view for traders who wish to make the Volume Weighted Average Price (VWAP) the crux of their trading strategy. It not only calculates the VWAP on a daily basis but also incorporates standard deviation to give an accurate representation of market volatility. The trading bands are calculated using a 1.5% multiplier for th

Probability-Based Indicator This indicator analyses price movements of a given period to obtain crucial information for probability distribution analysis such as their mean and standard deviation, Once it has such piece of information it does all the necessary calculations and finally calculates the probability that the current market value will go above or below the given period bars. Since this indicator effectively leverages the power of probability which doesn't lie, It is a powerful indicat
Palantir インジケーターは、設定でユーザーが指定したポイント数によって価格の反転を予測します。 関心のあるトレンドのサイズを選択すると、インジケーターは価格が最も近い極値から指定されたポイント数だけ反対方向に移動する確率を予測します。
インジケーターの操作は、過去の傾向の統計的計算に基づいています。 Palantir は、設定で指定されたサイズで履歴の傾向を分析し、統計を収集し、それらに基づいて結果を生成します。 たとえば、トレンド サイズを 500 ピップスに設定するとします。 このインジケーターは、修正が 500 ピップスを超えなかったトレンドを分析します。 次に、最新(現在)のトレンドと過去のトレンドを比較し、現在のトレンドが歴史の中でどのような位置を占めているかを示します。 指標の読み取り値が 50% を超える場合は、現在のトレンドが過去のトレンドの半分よりも大きいことを示し、その逆も同様です。 さらに、50% レベルは中央値であり、この付近でトレンドの反転が最も頻繁に発生します。 70/80/90% 以上の測定値も、高いトレンドの強さを示します。 最新の 300

キングオブドラゴンチャンネル、キングオブドラゴンインジケーター、キングオブドラゴンシステム、キングオブドラゴンMT5、キングオブドラゴンクラシックインジケーター、キングオブドラゴンスワイプシステム、 キング オブ ドラゴン オールインワン
King of Dragon チャネル取引システムは古典的なチャネル取引システムであり、多くのユーザーが MT5 バージョンを強く要望しています。 このプログラムは複数のバージョンでパフォーマンスが最適化されており、すでに比較的スムーズなシステムになっています。 49$ → 59$ 赤いエリア、ロングトレンド、ロングのみ、ショートではない 緑のエリア、短いトレンド、短いだけ、長くない 灰色の領域、統合トレンド、ショック指標の長期および短期運用を参照 https://www.mql5.com/ja/market/product/96760
パラメータ "===== メイン ===== int CalcalueBars = 1000;//計算されたバーの数 color BeltColor = clrGray;//トレンドベルトの色 bool Dis

*This is trading view indicator converted in mql5*
The HA Market Bias Indicator is a popular tool used in trading and technical analysis, designed to help traders identify market bias and potential trend reversals. It is commonly used in conjunction with candlestick charts and provides valuable insights into market sentiment. The indicator is based on the Heiken Ashi (HA) candlestick charting technique, which aims to filter out market noise and provide a smoother representation of price action.

This is a powerful crash spike detector indicator. It design to work on crash only it might be crash 100 ,crash 500 or crash 300 .binary.com broker provide crash indices .on 1minete only make sure to take signals consistence .it have a notification that makes sound whenever the spike it about to shown ,it proven 98% correct since 2017 . Try it now. check the recent result on the screenshot.

The Breaker Blocks with Signals indicator aims to highlight a complete methodology based on breaker blocks. Breakout signals between the price and breaker blocks are highlighted and premium/discount swing levels are included to provide potential take profit/stop loss levels.
This script also includes alerts for each signal highlighted.
SETTINGS
Breaker Blocks
Length: Sensitivity of the detected swings used to construct breaker blocks. Higher values will return longer term break
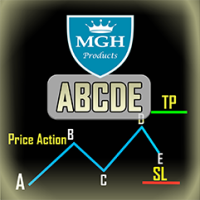
ABCDEインジケーター
このインジケーターは、価格アクションの主要なabcパターン(つまり、ブレイク、プルバック、ムーブメント)に基づいています。これらのパターンはラリーベースラリーパターンに似ており、トレンド分析やダイバージェンス分析などの一連の分析がチェックされ、正確なシグナルを発行します。それはかなり正確な取引シグナルを提供し、トレードを開始し、終了するのが最適なタイミングを伝えます。これは、外国為替、暗号通貨、金属、株式、指数など、どんな金融資産にも適用できます。
主な特徴:
• 非常に使いやすい
• マルチタイムフレームアラート
• 固定価格でストップロスとテイクプロフィットのオーダーが可能。
• どんな取引インストゥルメントとも連携可能(Forex、CFD、Futures その他)
• メール通知
• 電話通知
• かなり正確なトレードシグナルを提供し、いつトレードを開始・終了するのが最適かを教えてくれます。
• オープニングライン、ストップロス、テイクプロフィットをグラフ上に表示します。
• 無料デモ版があり
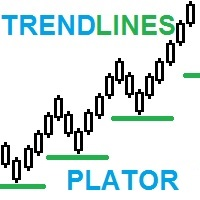
TrendPlator: 最適化された取引戦略のための強力なトレンド予測指標 当社の新しい指標のパワーを発見してください!大きなタイムフレームのトレンドラインを計算し、直接現在のタイムフレームに投影する能力を持つため、トレーダーの注目を集める戦略的なサポートを提供します。これらのポイントは、取引における強力なサポートまたはレジスタンスレベルとなり、取引戦略を推進します。 パワーアクションの指標コレクションに完璧にマッチする指標にアクセスできることを想像してみてください。当社の新しい指標がまさにそれです!それの精度に驚かれるでしょう。これは、戦略に欠けていた部分であり、結果を推進することができるかもしれません。 時間を無駄にしないでください!この素晴らしいツールを取引の武器庫に追加する機会を活用してください。その価値とポテンシャルを認識した場合、今すぐ入手することを躊躇しないでください。強力な指標で成功の新たな段階に到達し、正答率を高めましょう! 最新情報をお知らせします 独占的なリリース情報を受け取るために今すぐ登録してください。 フランシスコ・ゴメス・ダ・シルヴァ を友達として追加し
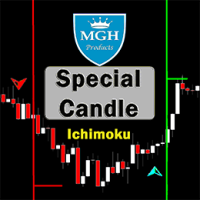
スペシャルキャンドル
成功した一目均衡表戦略を持つ最高の外国為替指標の1つを使いたいですか?この一目均衡表戦略に基づく素晴らしいインジケーターを利用できます。
MT4バージョンはこちらです。
第1戦略:
この戦略では、まれに発生する類似した強いクロスを特定することが含まれます。
この戦略に最適な時間枠は、30分(30M)および1時間(H1)です。
30分間隔の適切なシンボルには以下が含まれます:
• CAD/JPY
• CHF/JPY
• USD/JPY
• NZD/JPY
• AUD/JPY
• EUR/USD
• EUR/GBP
1時間のタイムフレームに適したシンボルには以下が含まれます:
• GBP/USD
• GBP/NZD
• GBP/AUD
• USD/CAD
• USD/CHF
• USD/JPY
• EUR/AUD
第2戦略:
この戦略では、トレンドと同じ方向に発生した強力なTenkunsenおよびKijunsenのクロスを特定することが含まれます。
この戦略に最適な時間枠は、1分(1M)から15分(15M)です。
この戦略はほとんどの通貨およびシンボルに適用でき

-- BEST SWING --
L'indicateur BEST SWING est un indicateur technique personnalisé, un excellent outil pour négocier les cassures en fonction des niveaux de support et de résistance horizontaux. L'indicateur BEST SWING utilise une formule complexe en analysant des données de prix autrement incongrues sur les cours de clôture de chaque période, ainsi que les hauts et les bas du prix, afin de donner un aperçu de la force ou de la faiblesse de la tendance du marché et de sa probabilité

Trading Hours インジケーターは、チャート内の具体的な取引所の開始時間と終了時間を表すフレームを描画します。 入力: 入力パラメータ「UTC タイム ゾーン シフト」は、UTC からのユーザーのタイム ゾーン シフトを設定します。 他のパラメータは、フレームの表示/非表示、または色の設定に使用されます。 特徴: 具体的な取引所の開始時間と終了時間を表す枠をチャートに描画し、 選択した交換のフレームを表示/非表示にします。 選択した交換の色を設定します。 17 の最大の取引所をサポート、 1 日より短い期間のみをサポートします。 Market-Instruments によって開発されました
Trading Hours インジケーターは、チャート内の具体的な取引所の開始時間と終了時間を表すフレームを描画します。 入力: 入力パラメータ「UTC タイム ゾーン シフト」は、UTC からのユーザーのタイム ゾーン シフトを設定します。 他のパラメータは、フレームの表示/非表示、または色の設定に使用されます。 特徴: 具体的な取引所の開始時間と終了時間を表す枠をチャートに描画

A visual Order Book is a powerful tool used in the financial market to provide a detailed view of buy and sell orders in a given financial instrument in real time.
This visual representation allows traders to observe the liquidity available in the market, identify the supply and demand levels at different prices and follow the evolution of orders as they are placed, modified or withdrawn.
By analyzing the visual Order Book, traders can identify trading patterns, detect possible reversal point
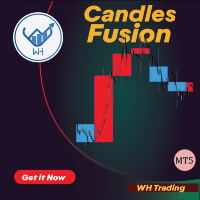
Candles Fusion は、 現在の時間枠でより高い時間枠のキャンドルを表示することで取引分析を強化する強力な MT5インジケーターです。
このユニークな機能により、トレーダーはさまざまな時間枠にわたる価格動向の包括的なビューを提供し、より多くの情報に基づいた取引決定を行うことができます。
特徴:
マルチタイムフレームオーバーレイ。 カスタマイズ可能な時間枠の選択。 明確な視覚化。 リアルタイム更新。 ユーザーフレンドリーなインターフェイス。
Candles Fusionは、より高い時間枠のキャンドルを現在のチャートにマージすることで、 市場のダイナミクスを包括的に理解し、取引の精度を向上させたいトレーダーにとって必須のツールです。これにより、トレーダーは主要なサポートとレジスタンスのレベルを特定し、
トレンドの反転を特定し、隠れた取引を発見することができます。 より正確なチャンスをもたらします。

Boom Scalper Gold It is an indicator, programmed to scalp in a timeframe of 1/5 and 15 Minutes, perfect for hunting spikes and trend sails, where in the parameters of (70) it sends you a sale/sell alert and in the level parameter (8) it sends you a buy signal It is used for indices (BOOM) of synthetic indices (Deriv) It's easy and simple to use, it does all the work by sending you the alerts! the indicator during this period will remain on SALE! Without further ado, enjoy! Good profit. World Inv
Crash Scalper Gold It is an indicator, where it marks points of purchase and points of sale As the name says, it is used to scalp in the pairs of (Crash) 1000/500/300 where it sends you signals of sale/Sell and purchase/Buy at level points (90) he sends you the sell signal, (Spike) at the level point (27) it sends you the buy signal, (Trend Candles) It is very simple and easy to use. to make the best tickets possible! For this period it will remain on sale! Without further ado, enjoy! Good profi

Introducing the Power Trade Plus indicator designed by a small group of traders with a few years of experience trading the market profitably. The Power Trade Plus is derived from the Power Trade indicator, the indicator strive in powerful sniper entries and take profit levels, with an algorithm that's can determine the markets volatility and Provides entries based on the current market volatility. This indicator is much more effective in stock ,currencies and indices.

The "AI Forecast" indicator is the result of a unique experiment in which I asked an AI how to create the best indicator to anticipate the market. The AI suggested measuring the past history of the price and its reactions to different levels, and then calculating the probabilities of the price reaction in the future.
With this idea, I designed with the help of another AI the "AI Forecast" indicator, which adapts to any MetaTrader chart and shows you three lines: one for entry and two for possi
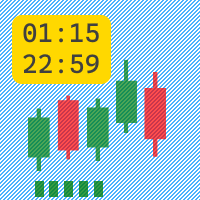
The Active Session indicator displays an active trading session in the form of green candles in a separate window.
Indicator parameters:
Monday = true/false - trade on Monday if the parameter is true.
Tuesday = true/false - trade on Tuesday if the parameter is true.
Wednesday = true/false - trade on Wednesday if the parameter is true.
Thursday = true/false - trade on Thursday if the parameter is true.
Friday = true/false - trade on Friday if the parameter is true.
StartHour - start o
Xau/Usd Scalper It is a unique indicator where it counts the low/high to make buy and sell entries! where you mark the entries with arrows next to the lows and highs used in m15/H1 to make longer and more valuable entries It is very simple and easy to use It also works for forex pairs and synthetic indices! Without further ado, enjoy! good profit World Investor!!

出来高加重平均価格インジケーターは、MT5 のメインチャートウィンドウに表示されるラインスタディインジケーターです。インジケーターは、典型的な価格と、インジケーターラインを頻繁に取引される価格に自動的に押し上げるために使用される取引量を監視します。これらの価格は、最も多くの契約 (またはロット) が取引された価格です。次に、それらの加重価格がルックバック期間にわたって平均化され、インジケーターはそれらのプッシュされた価格でラインスタディを表示します。
この投稿のインジケーターを使用すると、トレーダーはルックバック期間の毎日の開始時間を設定できます。MT5 を初めて使用するトレーダーの場合、マウスポインターで各バーをロールオーバーするだけで、チャート上の各バーの開始時間を表示できます。このインジケーターは、日中取引のみを対象としています。 このインジケーターを使用すると、VWAP とバンドの開始を最新の主要な高値または安値に固定できます。その高値または安値が数日前にチャートに表示された場合でも同様です。機関投資家や流動性プロバイダーは、VWAP を使用して市場を取引することがよくありま
Step Scalper , It is an indicator with alerts, where it sends you buy and sell alerts accompanied by a moving average of 21 periods It is very easy and simple to use. where on the path of the green period marks the purchase of the asset , and the path of the red period marks the sale of the asset, It is used for scalping on M5/M15 but it is also recommended use it in periods of 1 hour since it captures the buying or selling trend, to get more profit! no more to enjoy good profit World Investor!
対数移動平均インジケーターは、指数移動平均の式を逆にした移動平均です。
多くのトレーダーは対数チャートを使用して価格変動の長さを分析することが知られています。 この投稿のインジケーターは、標準的な時間スケール チャートで価格の対数値を分析するために使用できます。
トレーダーは次の入力パラメータを設定できます。
MAPeriod [デフォルト: 9] - 価格をより平滑化するには大きい数値に設定し、対数移動平均線調査の反転を速くするには小さい数値に設定します。
MAShift [デフォルト: 3] - 価格のクロスオーバーの量を減らすにはより高い数値に設定し、より頻繁に価格のクロスオーバーを行うにはより低い数値に設定します。
インジケーター ライン (インジケーター バッファー) は、Expert Advisor ビルダー ソフトウェアまたはカスタム コード化された Expert Advisor で作成された Expert Advisor の iCustom を使用して呼び出すことができます。
空の値はありません。 そして
再塗装は無

5/10 30$でコピー ---> 次は50$ // MT4版
Forex Vigor は、8つの主要通貨(EUR、GBP、AUD、NZD、USD、CAD、CHF、JPY)の勢いの強さを評価するテクニカル指標です。このインディケータは、28の通貨ペア間の相関性の欠如を測定する数学的計算 に依存しています。その値を計算するために、線形加重平均法(LWMA)と、モデルにおいて有意性を示さない値を排除する統計システムを使用して、終値の差の割合を分析します。この方法は、最近の値動きをより重要視する加重平均を提供するものです。この割合の差を考慮することで、この指標は、通貨のモメンタムの強さと方向性を示す指標となります。
主要通貨のモメンタムの強さを評価し、市場力学に関する貴重な洞察を提供するこの指標は、トレーダーが潜在的な取引機会を特定し、より多くの情報に基づいた取引決定を行い、効果的にリスクを管理するのに役立つ。
特徴 リペイントなし 新しいデータが届いても、このインジケータの値は変わりません。 取引ペア 28の取引ペア 時間枠 全て (M1, M5, M15, M30, H1

If you have been anywhere near Forex forums or social media lately, you have no doubt been hearing people talk about Smart Money Concepts (SMC) trading. You may be wondering what SMC is, and whether it deserves all the hype. In this post, we will introduce Smart Money Concepts trading to you so you can make an informed decision about whether or not to give this strategy a try in your own trading. What is SMC Forex trading? Smart Money Concepts (SMC) is one of many forex trading methods. SMC

Indicator show best signals for buy and sell orders. Indicator uses only 2 inputs: DEMA Fast Period - fast double exponential moving average period DEMA Slow Period - slow double exponential moving average period Crossings of fast and slow double double exponential moving averages shows buy and sell signals, which are drawn as green and magenta arrows respectively.

https://youtu.be/JJanqcNzLGM , https://youtu.be/l70MIHaQQa4 , https://youtu.be/pg0oiT5_8y0 Automated Supply and Demand Trading Edge MT5. These videos demonstrate how we apply the supply and demand system to our latest trading review and market analysis
Enhance your Trading Strategy with the Supply and Demand Trading Edge MT5. Gain a competitive market advantage with the Supply and Demand Trading Edge MT5 indicator, a powerful tool that combines MACD signals with supply and demand zones. By

Indicator show best signals for buy and sell orders. Indicator uses only 3 inputs: DEMA Fast Period - fast double exponential moving average period DEMA Slow Period - slow double exponential moving average period DEMA Trend Period - trend double exponential moving average period
Position of price according to trend double double exponential moving average and crossings of fast and slow double double exponential moving averages shows buy and sell signals, which are drawn as gre

Indicator show best signals for buy and sell orders. Indicator uses only 2 inputs: PEMA Bounce Period - bounce percentage exponential moving average period PEMA Confirm Period - confirm percentage exponential moving average period Positions of price according to bounce and confirm percentage exponential moving averages and directions of bounce and confirm percentage exponential moving average shows buy and sell signals, which are drawn as green and magenta arrows respecti
Automated Supply and Demand Tracker MT5. The following videos demonstrate how we use the system for trade setups and analysis.US PPI, Fed Interest Rates, and FOMC Trade Setup Time Lapse: U.S. dollar(DXY) and Australian dollar vs U.S. dollar(AUD/USD) https://youtu.be/XVJqdEWfv6s The EUR/USD Trade Setup time lapse 8/6/23. https://youtu.be/UDrBAbOqkMY . US 500 Cash Trade Setup time lapse 8/6/23 https://youtu.be/jpQ6h9qjVcU . https://youtu.be/JJanqcNzLGM , https://youtu.be/MnuStQGjMyg,  ;
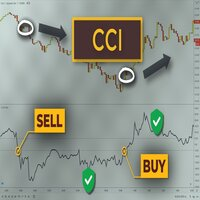
CCI Indicator Super is based on Pending Position strategy ( PPS ) and a very advanced secretive trading algorithm. The strategy of CCI Indicator Super is a combination of a secretive custom indicator, Trendlines, Support & Resistance levels ( Price Action ) and most important secretive trading algorithm mentioned above. DON'T BUY AN EA WITHOUT ANY REAL MONEY TEST OF MORE THAN 3 MONTHS, IT TOOK ME MORE THAN 100 WEEKS(MORE THAN 2 YEARS) TO TEST BONNITTA EA ON REAL MONEY AND SEE THE RESULT
MetaTraderマーケットは自動売買ロボットとテクニカル指標を販売するための最もいい場所です。
魅力的なデザインと説明を備えたMetaTraderプラットフォーム用アプリを開発するだけでいいのです。マーケットでプロダクトをパブリッシュして何百万ものMetaTraderユーザーに提供する方法をご覧ください。
取引の機会を逃しています。
- 無料取引アプリ
- 8千を超えるシグナルをコピー
- 金融ニュースで金融マーケットを探索
新規登録
ログイン