LT Force
- インディケータ
- バージョン: 1.2
- アップデート済み: 18 5月 2025

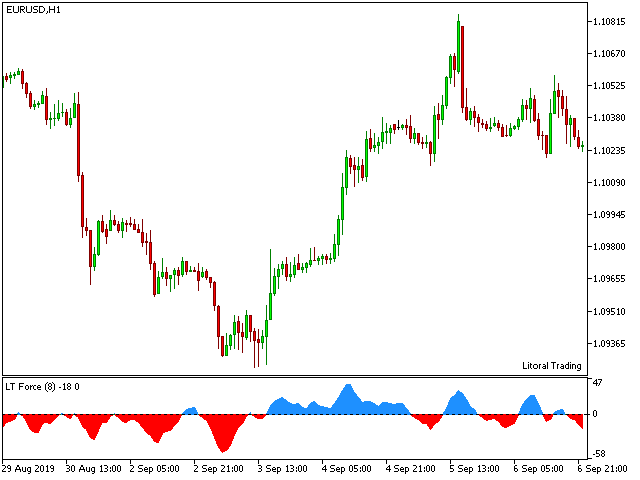
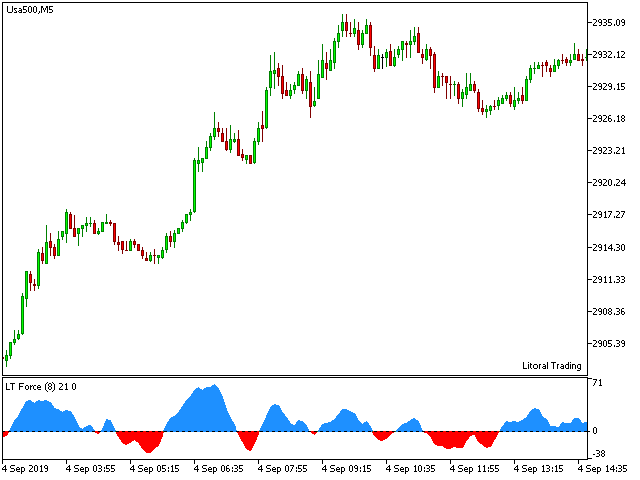
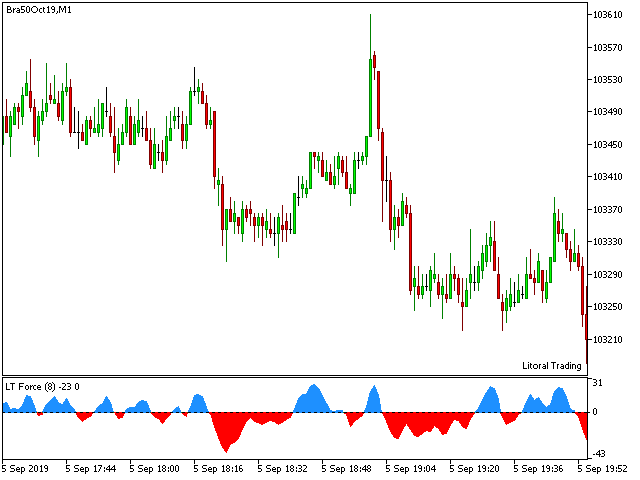
For those who like trend the Force will be a very useful indicator. This is because it is based on the famouse ADX, which measure the strenght of a trend, but without its 3 confusing lines.
Force has its very simple interpretation: if the histogram is above zero level the trend is up, otherwise it is down.
You can use it to find divergences too, which is very profitable.
Thanks to Andre Sens for the version 1.1 idea.
If you have any doubt or suggestion, please, contact me.
Enjoy!
MT4 version: https://www.mql5.com/en/market/product/139421
This is a free indicator, but it took hours to develop. If you want to pay me a coffee, I appreciate a lot <3
PayPal: pceduardo732@gmail.com
USDT TRC-20: TU7yT6qFGTrM3DtytVu8cTU5YSxQZ1VuoA


super