Dashboard PRO MT5

5

Hi Traders,

I coded a free analysis tool for you to use for your trading accounts, because there is nothing more important than tracking and understanding results. 

Take a look at our website for full EA validation, and the deepest anti curv-fitting analysis: https://ergodiclabs.co/

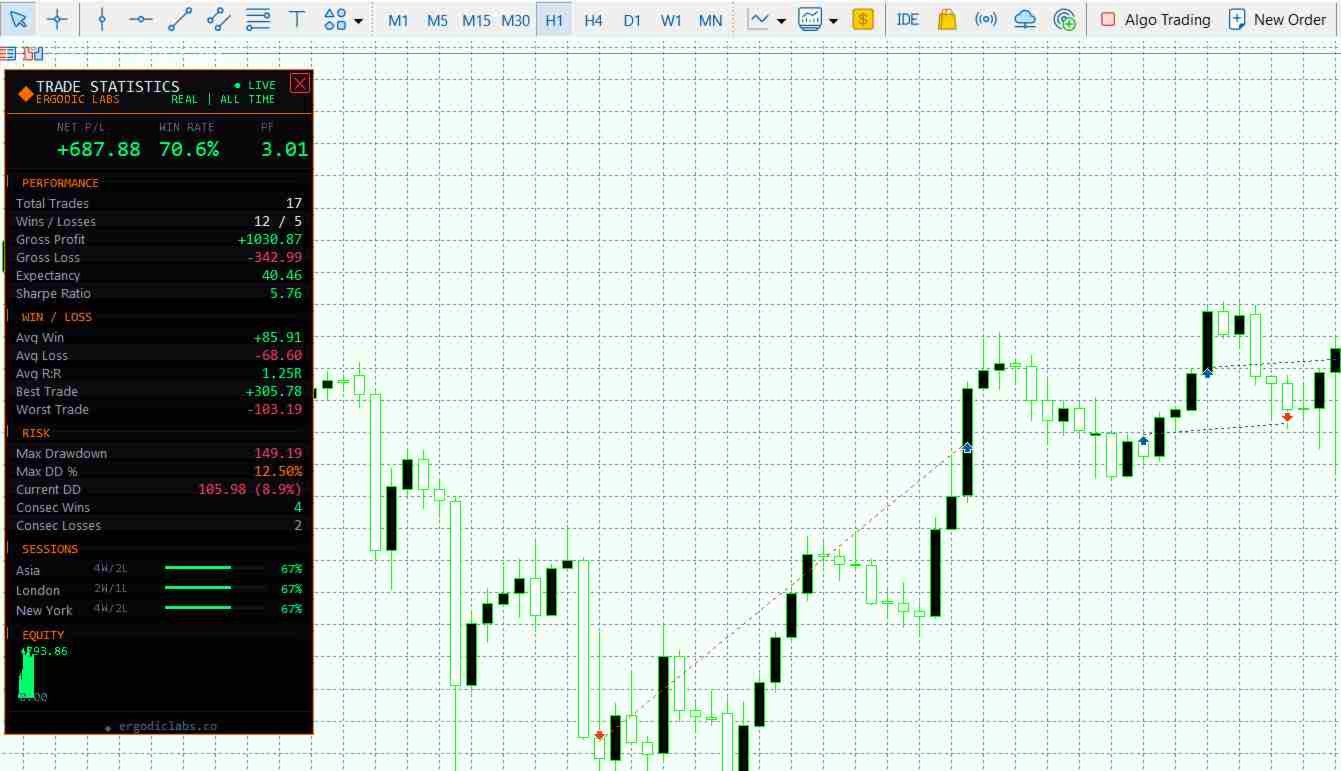
Trade Statistics Dashboard Pro is a real-time on-chart performance analytics panel that gives you instant visibility into your trading results. Built with an institutional-grade dark interface, it displays every critical metric a serious trader needs — without leaving the chart.

Whether you are running Expert Advisors, trading manually, or monitoring a signal service, this dashboard keeps your performance data front and center at all times.


🔗 From the Developer

This free dashboard is developed by Ergodic Labs, the team behind professional-grade trading tools and algorithmic validation systems.

For professional trading robots and Expert Advisors, visit:
https://nomadforexrobots.com/

For free online Monte Carlo simulation to stress-test your strategy beyond what any backtest can show:
https://ergodiclabs.co/monte-carlo/

Monte Carlo simulation helps you understand the probability distribution of your drawdowns and returns — essential for proper position sizing and risk management. Use it alongside this dashboard for a complete performance analysis workflow.


📊 Key Statistics Displayed

The dashboard calculates and displays the following metrics in real time:

- Net Profit/Loss with color-coded positive and negative values
- Win Rate percentage with dynamic threshold coloring
- Profit Factor calculated from gross profit divided by gross loss
- Expectancy per trade showing your average edge
- Sharpe Ratio annualized using 252 trading day standard
- Average Win and Average Loss with signed formatting
- Average Reward to Risk ratio
- Largest single winning and losing trade
- Maximum Drawdown in currency and percentage
- Current Drawdown with live tracking against equity peak
- Maximum Consecutive Wins and Consecutive Losses
- Session Breakdown showing win rate for Asia, London, and New York sessions with visual progress bars
- Mini Equity Curve plotted directly on the panel


⚙️ Flexible Filtering

Filter your statistics by multiple criteria to analyze exactly what you need:

Data Source options:
- All Account History — every closed trade on the account
- Filter by Magic Number — isolate a specific EA
- Current Symbol Only — see stats for the active chart symbol
- Magic plus Symbol — combine both filters for precise analysis

Time Period options:
- All Time, Today, This Week, This Month
- Last 30 Days, Last 90 Days, Year to Date


🎨 Fully Customizable Interface

Every visual element can be adjusted to match your chart setup:

- Panel corner placement — top left, top right, bottom left, or bottom right
- Adjustable X and Y offset for pixel-perfect positioning
- Configurable panel width
- Toggle equity curve, session breakdown, and branding individually
- Full color control for accent, positive, negative, cyan, and all text levels
- Refresh interval from 1 to 60 seconds
- Click header to minimize or expand the panel
- Built-in remove button to delete the indicator from chart


🏦 Institutional Design

The dashboard features a Bloomberg terminal inspired dark theme with:

- Solid black opaque background that never bleeds through to the chart
- Orange accent borders and section headers
- Consolas monospace font for precise data alignment
- Alternating row backgrounds for easy scanning
- Color-coded values that change based on performance thresholds
- Live or Demo account detection displayed in the header


📋 Input Parameters

Data Source section:
- Data Source — select All History, Magic Number, Symbol, or Magic plus Symbol
- Magic Number — specify the magic number when using filtered mode
- Time Period — choose from All Time through Year to Date

Panel Layout section:
- Corner — panel anchor position on chart
- X Offset — horizontal distance from corner in pixels
- Y Offset — vertical distance from corner in pixels
- Width — panel width in pixels, default 310
- Show Equity Curve — toggle the mini equity chart
- Show Sessions — toggle the session breakdown section
- Show Branding — toggle the Ergodic Labs footer
- Refresh Interval — update frequency in seconds

Colors section:
- Accent — main highlight color, default orange
- Positive — profit and bullish color, default green
- Negative — loss and bearish color, default red
- Cyan — secondary accent for ratios and badges
- Primary Text — main label color
- Secondary Text — row label color
- Muted Text — dimmed information color


📌 Important Notes

- The indicator reads closed deal history only. Open positions are not included in calculations.
- Swap and commission are included in all profit and loss calculations for accurate net figures.
- Session hours are based on server time. Asia is 00 to 08, London is 08 to 13, New York is 13 to 22.
- The Sharpe Ratio uses annualized calculation with square root of 252 scaling factor.
- Drawdown percentage is calculated relative to starting balance plus peak equity.
- Works on any symbol and any timeframe.
- Compatible with both Netting and Hedging account types.

レビュー 2
Tahj-R Scott
21
Tahj-R Scott 2026.05.17 17:44 
 

Thanks Botond, it looks great. any planned updates or is this the final product?

おすすめのプロダクト
VFI Quantum
Nikita Berdnikov
5 (1)
Introducing VFI (Volume Flow Indicator) – a trading indicator that analyzes the relationship between volume and price movement to identify key trading opportunities. The indicator displays the strength and direction of volume flow, providing clear signals about potential entry and exit points. Signals are formed based on zero line crossovers, crossovers between the VFI line and its exponential moving average (EMA), and when the indicator exits overbought and oversold zones. Attention! This stra
FREE
Shadow Flare インジケーターは、MetaTrader 5 向けの 非リペイント型トレンド & 流動性ツール です。設定可能な移動平均ベースライン(HMA / EMA / SMA / RMA から選択)を計算し、その上下に ATR(Average True Range)ベースのバンドを巻き付けることで「粘着性」のあるトレンド状態を生成します。トレンド状態は、価格の終値が上側バンドまたは下側バンドを明確にブレイクしてクローズしたときにだけ反転します。同じトレンドエンジンが自動サプライ・デマンドゾーンモジュールも駆動し、スイングハイ/スイングローを検出してその周囲に色付きボックスを描画し、価格がクローズでゾーンを抜けた瞬間にそのゾーンを無効化(ミティゲート)します。 トレンド状態が反転したバーで買い・売りシグナルが発生し、オプションの出来高フィルターと RSI フィルターにより、弱いエントリーやモメンタムに逆行するエントリーをブロックできます。内蔵ダッシュボードはリアルタイムでトレンドバイアス、モメンタム(RSI ベース)、出来高ステータスを表示します。ポップアップ、サウンド、モ
FREE
Value Chart Candlesticks
Flavio Javier Jarabeck
4.57 (14)
The idea of a Value Chart indicator was presented in the very good book I read back in 2020 , " Dynamic Trading Indicators: Winning with Value Charts and Price Action Profile ", from the authors Mark Helweg and David Stendahl. The idea is simple and the result is pure genius: Present candlestick Price analysis in a detrended way! HOW TO READ THIS INDICATOR Look for Overbought and Oversold levels. Of course, you will need to test the settings a lot to find the "correct" one for your approach. It
FREE
Trading Sessions by Mahefa R is an indicator for MetaTrader 5 that visually identifies the four main trading sessions: New York, London, Tokyo, and Sydney . Designed to provide a clean, intuitive, and professional market view, it highlights the most active periods of the Forex market using smart visualization of session ranges , session-specific candle colors , and daily separators . Main Features: Automatic detection of the 4 major sessions New York London Tokyo Sydney Each session is fully c
FREE
Smart Trend Suite Pro – Advanced Trend Indicator with Dashboard & Alerts Overview: Smart Trend Suite Pro is a powerful trend-detection indicator that offers traders a complete set of tools for accurate trend analysis and actionable insights. Designed for versatility and precision, Smart Trend Suite Pro adapts seamlessly to multiple timeframes and market conditions, making it suitable for various trading styles, including scalping and swing trading. Key Features: Real-Time Trend Detection: Identi
FREE
価格波形パターン MT5へようこそ --(ABCD パターン)-- ABCD パターンは、テクニカル分析の世界で強力で広く使用されている取引パターンです。 これは、トレーダーが市場での潜在的な売買機会を特定するために使用する調和的な価格パターンです。 ABCD パターンを使用すると、トレーダーは潜在的な価格変動を予測し、いつ取引を開始および終了するかについて十分な情報に基づいた決定を下すことができます。 EA バージョン:     Price Wave   EA MT5 MT4バージョン:   Price Wave Pattern MT4 特徴 :  ABCDパターンの自動検出。 強気パターンと弱気パターン。  任意のシンボルと任意の時間枠で機能します。 主要なレベルと価格目標。 カスタマイズ可能な設定と繊維レベルの調整。 アラートと通知。 今後  さらに多くの 機能が追加される  予定です 。
FREE
Mae Pla Green Pen Analysis Framework The Mae Pla Green Pen Analysis Framework is a multi-timeframe price action scanner for XAUUSD (Gold Spot) . It monitors all 9 timeframes simultaneously — M1, M5, M15, M30, H1, H4, D1, W1, and MN — and displays pattern detection results on a real-time dashboard drawn directly on the chart. The indicator is based on the Mae Pla Green Pen trading methodology, which uses structured price action patterns to identify potential trade setups. Pattern Detection Three
FREE
この情報インジケーターは、アカウントの現在の状況を常に把握したい人にとって役立ちます。 VERSION MT 4 -   More useful indicators このインジケーターには、ポイント、パーセンテージ、通貨での利益、現在のペアのスプレッド、現在の時間枠でバーが閉じるまでの時間などのデータが表示されます。 チャート上に情報線を配置するには、いくつかのオプションがあります。 価格の右側 (価格の後ろにあります)。 コメントとして (グラフの左上隅に); 画面の選択した隅。 情報区切り記号を選択することもできます。 | / \ # このインジケーターは使いやすく、非常に有益です。設定で不要な情報項目を無効にすることも可能です。 設定 外観の種類     - 情報行の表示タイプ。次の 3 つのオプションがあります。 価格に従ってください     - 価格に従う。 コメントとして     - コメントとして; 画面の選択した隅に     - 画面の選択した隅にあります。 添付用グラフコーナー     - 表示タイプを選択した場合 画面の選択されたコーナーでは、この項目を使用して
FREE
Golden Delta Library — Free MT5 Tools Market Description This indicator is also integrated into the advanced   Golden Delta EDGE   trading panel. Short Description Golden Delta Library is a free MT5 toolkit for traders who want cleaner chart structure, Renko-based context, risk planning, and practical execution panels. The collection includes Renko indicators, SuperTrend / ADX Renko variants, XAUUSD helper panels, and RiskLab TradeDesk tools. Each product is designed to be lightweight, visual
FREE
Phoenix Measured Box
Nigel Nii Darku Narnor Darko
PHOENIX MEASURED BOX DASHBOARD, engineered specifically for Phoenix Au Trading to provide "No dreams, just the tools" for high-precision institutional-style trading. 1. THE INDICATOR DEFINITION The Phoenix Measured Box is a multi-dimensional analysis tool designed for SMC (Smart Money Concepts) and ICT-style traders. It combines time-segmented price action with real-time volume metrics and automated target projections. Key Components: 15m Range Boxes: Automatically identifies and boxes every 15
FREE
Force Candle Pro
Samuel Henrique Almeida Ferreira
5 (1)
Force Candle Pro is an advanced indicator designed to identify strong momentum candles in the market, helping traders detect high-probability movements and institutional activity. This tool analyzes candle strength based on body size, volatility, and directional consistency, filtering out weak and indecisive movements. Unlike common indicators, Force Candle Pro focuses on market impulse, allowing traders to identify when the market is truly moving with strength. MAIN FEATURES: - Detection o
FREE
(Special New Year promotion - free price!) The indicator displays the actual 'Scale in points per bar' (identical to the manual setting in the Terminal, see screenshot) in the upper right corner of the chart. The displayed value changes INSTANTLY whenever the chart scale is changed! (This is very convenient when planning screenshots). In Settings: Change language (Russian/English), font size of the displayed text, text label offset coefficient from the graph corner, equally in X and Y directi
FREE
One of the simplest Pivot Point indicator, easy to operate, and most complete for a single chart in determining    Resistance   and   Support  level lines. In single chart,  it will show R&S Level Line with 5 popular types of Pivot Point, Highest&Lowest of closing price Include the Trend and up to 3 Time Frames. Five   types   (Floor, Woodie, Camarilla, DeMark, & Fibonacci)   of popular   Pivot Points   in determining   Resistance   and   Support   levels. With just using simple button on the
FREE
DRX SPREAD MONITOR は、ブローカーのスプレッドをリアルタイムで可視化・分析するために設計されたプロフェッショナルなユーティリティです。ニュースイベント、ロールオーバー、または流動性の低いセッション中のスプレッド拡大によって引き起こされる隠れたコストを特定するのに役立ちます。 このツールは、約定品質を確保し、取引コストが統計的に高すぎる場合のトレードを回避する必要があるスキャルパーやゴールドトレーダーにとって不可欠です。 主な機能 リアルタイムヒストグラム: 別のウィンドウにスプレッド履歴を表示し、通常、高、極端なレベルを色分けします。 動的移動平均(MA): 平均スプレッドの傾向を計算し、一時的なスパイクと構造的なスプレッドの増加を区別するのに役立ちます。 視覚的「イコライザー」モード: チャートを乱雑にすることなく、市場の流動性状況に関する即時フィードバックを提供する独自のバーチャート表示です。 ライブデータパネル: チャート上のコンパクトなダッシュボードで以下を表示します: 現在のスプレッド 平均スプレッド(時間ベース) 最小/最大記録 音声警告システム: スプレ
FREE
Volatility Break Signals Description: The  Volatility Break Signals  is an indicator designed to detect potential trend changes while partially filtering market noise. It uses an adaptive volatility measure based on the selected price (Close, Open, High, Low, etc.) and generates Buy and Sell signals when the price shows a reversal relative to the previous direction. How it works: Price Volatility Measurement The indicator calculates the absolute price changes from bar to bar ( |price - previous
FREE
Multi Currency Strength Dashboard Mini(無料)– MetaTrader 5 用 通貨強弱メーター Multi Currency Strength Dashboard Mini は MetaTrader 5 向けの無料インジケーターで、 8つの主要通貨 (USD / EUR / GBP / JPY / CHF / CAD / AUD / NZD)の相対的な強弱を、見やすいダッシュボードでリアルタイム表示します。 目的:強い通貨・弱い通貨を数秒で把握し、ウォッチリスト作成や「 強い通貨 vs 弱い通貨 」の組み合わせ選定を効率化します。 主な機能(Mini 無料版) 8主要通貨 の強弱を1つのパネルに表示。 強弱バー +パーセンテージの視覚的ダッシュボード。 自動リアルタイム更新(軽量更新)。 全タイムフレーム対応 (計算は選択した時間足で実行)。 多くのブローカーに対応(一般的なシンボルのサフィックスを考慮)。 仕組み Market Watch に表示されている主要FXペアの価格変化をもとに通貨ごとの強弱を算出し、0〜100に正規化してランキング形式
FREE
Description The Institutional Cycle Filter (ICF) is a sophisticated trend-following tool that replaces standard moving averages with a "Signal Dot" system. It is designed to minimize lag while maintaining smoothness, making it highly effective for identifying trend reversals in volatile markets like Gold. How It Works (The Logic) Cosine Weighting: Unlike a Simple Moving Average (SMA) or Exponential Moving Average (EMA), this algorithm uses a Cosine function to calculate weights. This allows the
FREE
Indicator and Expert Adviser  EA Available in the comments section of this product. Download with Indicator must have indicator installed for EA to work. Mt5 indicator alerts for bollinger band and envelope extremes occurring at the same time. Buy signal alerts occur when A bullish candle has formed below both the lower bollinger band and the lower envelope  Bar must open and close below both these indicators. Sell signal occur when A bear bar is formed above the upper bollinger band and upper
FREE
フラワーインジケーターは、主にトレンドを特定し、スキャルピングやデイトレード戦略を支援するテクニカル分析ツールです。 フラワーインジケーターは、テクニカル分析と価格動向分析に基づいたシグナルトレンドインジケーターです。色付きの花を使ってトレンドを視覚的に示します。青い花は上昇トレンド、赤い花は下降トレンドを示します。 各レベルはサポートラインとレジスタンスラインのように機能します(チャート上に+/- 200レベルとドットが表示されたら注意してください)。 買われ過ぎ/売られ過ぎの静的レベル、付随するバンド、両方、またはどちらかを突破した時にドットが表示されるように設定できます。 このインジケーターは、アキュムレーション/ディストリビューションゾーンを特定しながら、市場の反転の可能性を探ります。あらゆる銘柄と時間枠に対応しており、パラメータは自由に調整できます。各レベルはサポートラインとレジスタンスラインのように機能します。
FREE
Trading Session Indicator The Trading Session Indicator visualizes the high and low points as well as the start and end times of the Asian, London, and New York trading sessions directly on your chart. Features: Visualization of major trading sessions Highlighting of high and low points Display of start and end times for each session Customizable session times User-friendly and efficient Customizability: Each trading session (Asian, London, New York) can be individually customized to match speci
FREE
STAMINA HUD – Advanced Market & Trend Dashboard (MT5) STAMINA HUD   is a professional   market information panel   designed for traders who want   clarity, speed, and control   directly on the chart. It provides a   clean heads-up display (HUD)   with essential market data and   multi-timeframe trend direction , without cluttering the chart or generating trading signals. What STAMINA HUD Shows   Current Price   Spread (in real pips)   Today High–Low range (pips)   Average D
FREE
Indicator Description Range Filter Pro is a sophisticated trading tool for XAUUSD (Gold) that combines adaptive price filtering with volume analysis and real-time market monitoring. Designed for both novice and professional traders, this indicator helps identify trend direction, potential reversals, and significant market movements through its multi-layered approach. Key Components 1.Dynamic Range Filter 2.Volatility-Adjusted Bands 3.Volume-Enhanced Candles 4.Professional Trading Dashboard 5.M
FREE
Original supertrend indicator in Tradingview platform.  Indicator type: Price Action indicator Introduction:   The Supertrend Indicator - Enhancing Your Trend Analysis.  If you haven't yet found a Supertrend indicator with good graphics on the MQL5 platform, this is the indicator for you. Overview:   The Supertrend Indicator is a powerful tool designed to provide traders with valuable insights into the current and historical trends of financial markets. It serves as a valuable addition to any t
FREE
AZ session scalper A small but useful session indicator, designed primarily for scalping. Enable the session you plan to trade, watch the reaction of the M5/M15 candlesticks to the level of the previous trading session, and enter. We always look at the reaction of the current session to the previous one. For example, if you trade the Americas, enable the European session, and watch how one session takes away liquidity from another. Important: adjust the time to your broker's time zone in the i
FREE
Donchian Pro
Paulo Henrique Faquineli Garcia
4.75 (4)
The Donchian Channel Channels are among the most popular tools of technical analysis, as they visually convey to the analyst the limits within which most price movement tends to occur. Channel users know that valuable information can be obtained at any time, whether prices are in the central region of a band or close to one of the border lines. One of the best known techniques to explore these concepts is Bollinger Bands. However, John Bollinger was not the only one to research the application
FREE
TideMarks Basic — Session Highs & Lows (NY, London, Tokyo) This is the free version of TideMarks. It displays today's session highs and lows for Tokyo, London and New York with no configuration required — just add it to your chart and it works. The full version adds: On-chart toggle buttons per session Open-Close range lines Session candle coloring with directional tick marks Two fully customisable extra sessions Extend lines as live support and resistance Full alert suite (8 alert types) Config
FREE
Enhanced Volume Profile: The Ultimate Order Flow & Liquidity Analysis Tool Overview Enhanced Volume Profile is an indicator for MetaTrader 5 that displays the traded volume at specific price levels over a defined period. It separates the total volume into buy and sell components, presenting them as a side-by-side histogram on the chart. This allows users to observe the volume distribution and the proportion of buy and sell volumes at each price level. Graphics Rendering The indicator uses the
FREE
Inside Bar Radar
Flavio Javier Jarabeck
4.67 (6)
The Inside Bar pattern is a very well known candlestick formation used widely by traders all over the world and in any marketplace. This approach is very simple and adds a little confirmation candle, so it adds a third past candlestick to the count to confirm the direction of the move (upward or downward). Obviously, there is no power on this candlestick formation if the trader has no context on what it is happening on the market he/she is operating, so this is not magic, this "radar" is only a
FREE
The idea of the system is to indentify the reversal patterns using the calculation of the composite candle. The reversal patterns is similar to the "Hammer" and "Hanging Man" patterns in Japanese candlestick analysis. But it uses the composite candle instead the single candle and doesn't need the small body of the composite candle to confirm the reversal. Input parameters: Range - maximal number of bars, used in the calculation of the composite candle. Minimum - minimal size of the composite can
FREE
HammerStar
Arismario Verissimo Neves
3.4 (5)
The HammerStar indicator is designed to search for the Hammer and Shooting Star patterns on charts of any currency pairs. Hammer Downward trend. The lower shadow is not less than 2 and no more than 3 times larger than the body. There is no upper shadow, or it is very short (no more than 10% of the candlestick range). The color of the body in the long game is not important, with the short - white hammer is much stronger than the black one. Confirmation is suggested. Shooting Star Uptrend. The u
FREE
このプロダクトを購入した人は以下も購入しています
SuperScalp Pro
Van Minh Nguyen
4.64 (25)
SuperScalp Pro – 高度なマルチフィルタースキャルピングインジケーターシステム SuperScalp Pro は、クラシックな Supertrend と複数のインテリジェント確認フィルターを組み合わせた高度なスキャルピングインジケーターです。M1 から H4 まで複数の時間足で効率的に動作し、XAUUSD、BTCUSD、主要 Forex 通貨ペア向けに最適化されています。 このインジケーターは明確な Buy / Sell シグナルを提供し、ATR に基づいてエントリー価格、Stop Loss、Take Profit を自動計算します。Fibonacci Take Profit 機能により、重要な価格帯で早期決済し、到達時に通知を送信します。 初期設定では Fibonacci Take Profit が有効化されており、より安定した取引体験を重視しています。チャートに適用するだけですぐ利用可能です。上級者向けに、すべてのパラメータは自由にカスタマイズできます。 追加の設定ガイド、推奨セットファイル、および最適化された設定はこちらでご覧いただけます: https://www.
このインジケーターを購入された方には、以下の特典を 無料 で提供しています: 各トレードを自動で管理し、ストップロスとテイクプロフィットを設定し、戦略ルールに基づいてポジションを決済する補助ツール 「Bomber Utility」 様々な銘柄に合わせたインジケーターの設定ファイル(セットファイル) 「最小リスク」、「バランスリスク」、「待機戦略」 の3つのモードで使用できる Bomber Utility 用の設定ファイル このトレーディング戦略をすぐに導入・設定・開始できる ステップバイステップのビデオマニュアル ご注意: 上記の特典を受け取るには、MQL5のプライベートメッセージシステムを通じて販売者にご連絡ください。 オリジナルのカスタムインジケーター 「Divergence Bomber(ダイバージェンス・ボンバー)」 をご紹介します。これは、MACDのダイバージェンス(乖離)戦略に基づいた 「オールインワン」型のトレーディングシステム です。 このテクニカルインジケーターの主な目的は、価格とMACDインジケーターの間に発生するダイバージェンスを検出 し、将来の価格の動きを示す
SignalTech MT5 is an unique fully rule based trading system for EURUSD, USDCHF, USDJPY, AUDUSD, NZDUSD, EURJPY, AUDJPY, NZDJPY, CADJPY.  All the winning trades with chart setups are published on the comments page. 2026-05 3493 Pips (Until 05-21 NY Closed) 2026-04 2243 Pips 2026-03 2165 Pips 2026-02 2937 Pips 2026-01 2624 Pips 2025-12 1174 Pips It can generate signals with Buy/Sell Arrows and Pop-Up/Sound Alerts. Each signal has clear Entry and Stop Loss levels, which should be automatically flag
Gold Entry Sniper – ゴールドスキャルピング&スイングトレード用プロフェッショナル多時間足ATRダッシュボード Gold Entry Sniper は、XAUUSDや他の銘柄向けに正確な 売買シグナル を提供する、MetaTrader 5用の高度なインジケーターです。 ATRトレーリングストップロジック と 多時間足分析ダッシュボード を搭載し、スキャルピングからスイングトレードまで対応します。 主な特徴と利点 多時間足シグナル分析 – M1、M5、M15 のトレンドを同時表示。 ATRベースのトレーリングストップ – ボラティリティに応じて動的に調整。 プロ仕様のチャートダッシュボード – シグナル状況、ATRレベル、回帰線、売買方向を表示。 明確な売買マーカー – 自動矢印とテキストラベル。 エグジットアラートとトレード管理 – 利益確定のための自動検出。 完全カスタマイズ可能 – パネル位置、色、フォント、ATR/回帰設定を調整可能。 ゴールド(XAUUSD)に最適化 – M1〜M15のスキャルピングに最適、FXや指数、暗号資産にも対応。 Gold Entry
Entry In The Zone and SMC Multi Timeframe is a real-time 2-in-1 market analysis tool that combines market structure analysis and a No Repaint BUY / SELL signal system into a single indicator, built on Smart Money Concepts (SMC) — a widely adopted framework used by professional traders to understand market structure. This indicator helps you see the market more clearly, make decisions based on structure rather than guesswork, and focus on high-probability zones where price is more likely to react
まず正直に言いましょう。 どんなインジケーターも、それ単体であなたを利益化させることはできません。もしそう言う人がいるなら、それは夢を売っているだけです。完璧な売買シグナル(矢印)を表示するインジケーターは、いくらでも“完璧に見せる”ことができます。正しい過去の区間を拡大して、勝ちトレードだけを切り取ればいいだけです。私たちはそれをしません。 SMC Intraday Formula はツールです。 市場構造を読み取り、最も高い確率の価格ゾーンを特定し、今この瞬間のスマートマネーの痕跡をシンプルな言葉で正確に示します。最終判断はあなたが行います。トレードを実行するのもあなたです。しかし今は「希望」ではなく「精度」でエントリーできます。 私たちはこのインジケーターを、ゴールド(XAUUSD)および主要FX通貨ペアで約3年間、日々のスキャルピングに使用してきました。M1、M5、M15、M30の主要ツールです。これは未来を予測しようとするのではなく、今まさに形成されている高確率セットアップを示し、その理由を説明します。 他のすべてのインジケーターと何が違うのか? ほとんどのトレーディングイ
Azimuth Pro
Ottaviano De Cicco
5 (7)
Azimuth Pro V2:MT5向けシンセティック・フラクタル構造分析と確認済みエントリー 概要 Azimuth Pro は Merkava Labs によるマルチレベルスイング構造インジケーターです。4つのネストされたスイングレイヤー、スイングアンカーVWAP、ABCパターン検出、3タイムフレーム構造フィルタリング、そして確定バーでの確認済みエントリー — 1つのチャートで、ミクロスイングからマクロサイクルまでを網羅するワークフロー。 これはブラインドシグナル製品ではありません。ロケーション、コンテキスト、タイミングを重視するトレーダーのための構造ファーストワークフローです。 V2発売記念オファー — Azimuth Pro V2をUSD 399で(次の100本)。最終価格:USD 499。 1. V2での変更点 シンセティック・マルチタイムフレームエンジン 上位タイムフレーム分析をMeridian Proと同じ独自のシンセティックアーキテクチャで一から再構築。よりクリーンなHTFコンテキスト、安定したライブ動作、従来のMTF同期問題なし。シンセティックエンジンは 固定比率タ
Power Candles V3 - 自己最適化型強弱インジケーター Power Candles V3は 、通貨や銘柄の強さを、適用されたすべてのチャート上で実行可能なトレードプランに変換します。単にローソク足を色分けするだけでなく、バックグラウンドでリアルタイムの自動最適化を実行し、目の前の銘柄に対して最適なストップロス、テイクプロフィット、およびシグナルの閾値を提示します。ワンクリックで実取引に適用でき、エントリーポイント、ストップロス、テイクプロフィットのラインが正確な価格位置にチャート上に表示され、方向性を示すアラートがリアルタイムで発動します。 このツールは、Stein Investmentsのエコシステムの一部です。  18種類以上のツールをすべて閲覧し、AIを活用したセットアップの推奨事項を入手し、  https://stein.investments でコミュニティに参加しましょう クローズしたバーごとに3,000回以上のトレードシミュレーション。9つの強さの状態。2つの戦略を並行してテスト。勝率の高い設定をワンクリックで適用。 なぜこれが必要なのか ほとんどの強
トレンドキャッチャーインジケーター トレンドキャッチャーインジケーターは、開発者独自の適応型トレンド分析指標を組み合わせることで、市場価格の動きを分析します。短期的なノイズを除去し、根底にあるモメンタムの強さ、ボラティリティの拡大、価格構造の挙動に焦点を当てることで、真の市場方向性を特定します。また、移動平均線、RSI、ボラティリティフィルターなどの平滑化およびトレンドフィルタリング機能を備えたカスタマイズ指標も使用します。 実際の運用状況のモニタリングやその他の製品については、こちらをご覧ください: https://www.mql5.com/en/users/mechanic/seller ご注意ください。私はTelegramでEAや設定を販売していません。詐欺です。すべての設定はブログで無料で公開しています。 重要!ご購入後すぐにご連絡ください。手順とボーナスをお送りします!
このインジケーターを購入すると、プロ仕様のトレードマネージャーを無料で差し上げます。 まず第一に、このトレーディングシステムがノンリペイント、ノンリドロー、ノンラグのインジケーターであることを強調する価値がある。これにより、手動取引とロボット取引の両方に理想的なものになっています。 オンラインコース、マニュアル、プリセットのダウンロード。 「スマートトレンドトレーディングシステム MT5」は、新規および経験豊富なトレーダー向けにカスタマイズされた包括的なトレーディングソリューションです。10以上のプレミアムインジケーターを組み合わせ、7つ以上の堅実なトレーディング戦略を備えており、多様な市場状況に対応する多目的な選択肢となっています。 トレンドフォロー戦略:トレンドを効果的に乗り越えるための正確なエントリーとストップロス管理を提供します。 リバーサル戦略:潜在的なトレンドの反転を特定し、トレーダーがレンジ相場を活用できるようにします。 スキャルピング戦略:高速で正確なデイトレードおよび短期取引のために設計されています。 安定性:すべてのインジケーターはノンリペイント、ノンリドロー、ノ
Gann Made Easy   は、ミスター・ギャンの理論を使用した取引の最良の原則に基づいた、プロフェッショナルで使いやすい外国為替取引システムです。 W・D・ガン。このインジケーターは、ストップロスとテイクプロフィットレベルを含む正確な買いと売りのシグナルを提供します。 PUSH通知を利用して外出先でも取引可能です。 ご購入後、取引方法の説明と優れた追加インジケーターを無料で入手するには、私にご連絡ください! おそらく、ギャンの取引手法についてはすでに何度も聞いたことがあるでしょう。通常、ギャンの理論は初心者のトレーダーだけでなく、すでにある程度の取引経験がある人にとっても非常に複雑なものです。なぜなら、ギャンの取引手法は理論的にはそれほど簡単に適用できるものではないからです。私はその知識を磨き、最良の原則を私の外国為替インジケーターに組み込むために数年を費やしました。 このインジケーターは非常に簡単に適用できます。必要なのは、それをチャートに添付し、簡単な取引推奨事項に従うだけです。このインジケーターは常に市場分析の仕事を行い、取引の機会を探します。適切なエントリーポイントを検
ARIPoint
Temirlan Kdyrkhan
1 (1)
ARIPoint is a powerful trading companion designed to generate high-probability entry signals with dynamic TP/SL/DP levels based on volatility. Built-in performance tracking shows win/loss stats, PP1/PP2 hits, and success rates all updated live. Key Features: Buy/Sell signals with adaptive volatility bands Real-time TP/SL/DP levels based on ATR Built-in MA Filter with optional ATR/StdDev volatility Performance stats panel (Success, Profit/Loss, PP1/PP2) Alerts via popup, sound, push, or email Cu
FX Trend NG:次世代マルチマーケット・トレンドインテリジェンス 概要 FX Trend NG は、複数の時間足に対応したプロフェッショナル向けトレンド分析およびマーケット監視ツールです。 市場全体の構造を数秒で把握することができます。 複数のチャートを切り替える必要はありません。どの銘柄がトレンド中なのか、どこでモメンタムが弱まっているのか、そしてどの時間足で強い整合性があるのかを瞬時に確認できます。 ローンチ特別オファー – FX Trend NG を $30(6ヶ月) または $80 永久ライセンス でご利用いただけます。 すでに Stein Investments のユーザーですか? -> メッセージを送信 して、プライベートグループへアクセスしてください。 セットアップや詳細情報が必要ですか? -> Stein Investments 公式ページ をご覧ください。 1. FX Trend NG が他と異なる理由 3ステート・トレンドロジック ― Buy と Sell だけではない • 多くのインジケーターは Buy または Sell の2状態のみを表示します。
まず第一に、この取引ツールはノンリペイント、ノンリドロー、ノンラグの指標であり、プロの取引に理想的ですことを強調する価値があります。 オンラインコース、ユーザーマニュアル、デモ。 スマートプライスアクションコンセプトインジケーターは、新米から経験豊富なトレーダーまで、非常 に強力なツールです。Inner Circle Trader AnalysisやSmart Money Concepts Trading Strategiesなど、20以上の有用な指標を1つに組み合わせています。このインジケーターはスマートマネーコンセプトに焦点を当て、大手機関の取引方法を提供し、彼らの動きを予測するのに役立ちます。 特に、流動性分析に優れており、機関がどのように取引しているかを理解しやすくしています。市場のトレンドを予測し、価格の動きを慎重に分析するのに優れています。機関の戦略とトレードを合わせることで、市場の動向についてより正確な予測ができます。このインジケーターは多目的であり、市場構造を分析し、重要な注文ブロックを特定し、さまざまなパターンを認識するのに優れています。 このインジケーター
トレンド スクリーナー インジケーターでトレンド取引の力を解き放ちます。ファジー ロジックと複数通貨システムを活用した究極のトレンド取引ソリューションです。 ファジー ロジックを活用した革新的なトレンド インジケーターである Trend Screener を使用して、トレンド取引を向上させます。 これは、13 を超えるプレミアム ツールと機能、および 3 つの取引戦略を組み合わせた強力なトレンド追跡インジケーターであり、Metatrader をトレンド アナライザーにする多用途の選択肢となります。 期間限定オファー : トレンド スクリーナー インジケーターは、わずか 65 ドルで生涯ご利用いただけます。 (元の価格 50$ ) (オファー延長) Trend Screener の 100% 非再描画精度の揺るぎない精度を体験して、取引の決定が過去の価格変動の影響を受けないようにしてください。 マルチタイムフレームおよびマルチ通貨機能の多用途性を解放し、比類のない自信を持って外国為替、商品、暗号通貨、インデックスの世界を取引できるようにします。 Trend Screener の包括的な戦
多くの矢印インジケーターは、シグナルだけを表示して、その後の判断をすべてトレーダーに任せてしまいます。KT Alpha Hunter Arrows は、完整なトレードプランをチャート上に提示します。 各シグナル矢印が表示されるたびに、エントリーライン、ストップロス、4つのテイクプロフィット水準、そして現在の銘柄と時間足が今トレードに値するかどうかを示すリアルタイムのエッジ判定が、すでに描画された状態で表示されます。付属の Trade Manager EA は、あなたが手動でエントリーした後の実行管理を担当し、相場が荒れて判断がぶれやすい場面でも規律あるトレードを保ちやすくします。リペイントなし。確定足シグナルのみ。Forex、ゴールド、指数、その他あなたが取引するあらゆる銘柄に対応します。 主な機能 リペイントしない買い矢印と売り矢印を、足の確定後にのみ表示。 各シグナルに、エントリーライン、構造的ストップロス、4つのテイクプロフィット水準を表示。 Edge Dashboard が、現在のチャートで買いセットアップと売りセットアップを別々に評価。 判定システム:No Edge、Mar
ご紹介     Quantum Breakout PRO は 、ブレイクアウト ゾーンの取引方法を変革する画期的な MQL5 インジケーターです。 13年以上の取引経験を持つ経験豊富なトレーダーのチームによって開発されました。     クォンタム ブレイクアウト プロ   は、革新的でダイナミックなブレイクアウト ゾーン戦略により、あなたのトレーディングの旅を新たな高みに押し上げるように設計されています。 クォンタム ブレイクアウト インジケーターは、5 つの利益ターゲット ゾーンを備えたブレイクアウト ゾーン上のシグナル矢印と、ブレイクアウト ボックスに基づいたストップロスの提案を提供します。 初心者トレーダーにもプロのトレーダーにも適しています。 量子EAチャネル:       ここをクリック 重要!購入後、インストールマニュアルを受け取るためにプライベートメッセージを送ってください。 推奨事項: 時間枠: M15 通貨ペア: GBPJPY、EURJPY、USDJPY、NZDUSD、XAUUSD アカウントの種類: ECN、Raw、またはスプレッドが非常に低い R
GEM Signal Pro GEM Signal Pro は、MetaTrader 5 向けのトレンドフォロー型インジケーターです。より明確なシグナル、より整理されたトレードセットアップ、そして実用的なリスク管理をチャート上で確認したいトレーダーのために設計されています。 単純な矢印だけを表示するのではなく、GEM Signal Pro はトレード全体の考え方を、より見やすく分かりやすい形で表示します。条件が確認されると、インジケーターはエントリー価格、ストップロス、利確目標をチャート上に表示し、トレードセットアップをより効率的に確認できるようにします。 動作の仕組み このインジケーターは、まず内部ロジックに基づいて有効なシードシグナルを検出します。 確認条件が満たされると、GEM Signal Pro はチャート上に完全なセットアップを表示します。これにより、トレーダーはトレード構造をより明確に把握し、手作業による分析を減らすことができます。 チャート上のトレードレベル 確認済みシグナルに対して、GEM Signal Pro は以下を表示できます。 エントリー価格 ストップロス テ
FX Levels: あらゆる市場における非常に高精度なサポート&レジスタンス 概要 通貨ペア、株式指数、個別銘柄やコモディティなど、どのような市場でも信頼できるサポートとレジスタンスを特定したいですか? FX Levels は伝統的な “Lighthouse” メソッドと先進的な動的アプローチを融合し、ほぼ汎用的な精度を実現します。ブローカーの実務経験を活かし、自動化されたデイリー更新とリアルタイム更新を組み合わせることで、 FX Levels は反転ポイントを見つけ、利益目標を設定し、自信をもってトレードを管理するための手助けをします。今すぐ試してみて、サポート/レジスタンス分析の正確性がどれほどトレードを向上させるかを実感してください! 1. FX Levels がトレーダーにとって非常に有用な理由 非常に正確なサポート&レジスタンスゾーン • FX Levels は異なるブローカー環境でもほぼ同一のゾーンを生成するよう設計されており、データフィードの差異や時刻設定のずれによる不一致を解消します。 • つまり、どのブローカーを利用していても一貫したレベルが得られるため、戦
Market Structure Order Block Dashboard MT5 は、市場構造と主要な価格反応ゾーンをチャート上で直接読み取りたいトレーダー向けに設計された MT5 インジケーターです。BOS、ChoCH、オーダーブロック、Fair Value Gap (FVG)、流動性、Kill Zones、Volume Profile、そして素早い分析のためのコンパクトなダッシュボードを組み合わせています。 本インジケーターは、市場構造、ICT、Smart Money の概念を意思決定の枠組みとして使用するトレーダーを対象としています。トレンド継続、反転の可能性、価格の不均衡、流動性ターゲット、注目ゾーンをより構造的に特定する助けとなります。 購入者向けの付属リソース 購入後、MQL5 のプライベートメッセージにてご依頼いただくと、完全な PDF ユーザーガイドとパラメータ設定のヒントを提供いたします。MQL5 のプライベートメッセージによる直接的な技術サポート。 バージョン 1.20 では 2 つの重要な追加機能があります: Pending BOS / Pending Cho
FX Power: 通貨の強弱を分析して、より賢い取引を実現 概要 FX Power は主要通貨と金の実際の強弱をあらゆる市場状況で理解するための必須ツールです。強い通貨を買い、弱い通貨を売ることで、 FX Power は取引の意思決定を簡素化し、高い確率の取引機会を見出します。トレンドを追従する場合でも、極端なデルタ値を使用して反転を予測する場合でも、このツールはあなたの取引スタイルに完全に適応します。ただ取引するだけではなく、 FX Power で賢く取引をしましょう。 1. なぜ FX Power がトレーダーにとって非常に有益なのか 通貨と金のリアルタイム強弱分析 • FX Power は主要通貨と金の相対的な強弱を計算し、マーケットダイナミクスに関する明確な洞察を提供します。 • どの資産がリードしているか、または後れを取っているかを監視して、取引するペアを賢く選びましょう。 マルチタイムフレームの包括的なビュー • 短期、中期、長期のタイムフレームで通貨と金の強弱を追跡し、マーケットトレンドに基づいて取引戦略を調整できます。 • スキャルピングからスイングトレード
BTMM State Engine Pro is a MetaTrader 5 indicator for traders who use the Beat The Market Maker approach: Asian session context, kill zone timing, level progression, peak formation detection, and a multi-pair scanner from a single chart. It combines cycle state logic with a built-in scanner dashboard so you do not need the same tool on many charts at once. What it does Draws the Asian session range; session times can follow broker server offset or be set in inputs. Tracks level progression (L
Reversal Master for MT5 Reversal Master for MT5 は、MetaTrader 5 向けのノンリペイント型リバーサルインジケーターです。潜在的な市場の転換ポイントを検出し、各ヒストリカルシグナルの後に発生した最大の有利な値動きを表示することで、過去の類似した局面で価格がどのように動いたかをより深く理解するのに役立ちます。 MT5 版では、元の MT4 版 Reversal Master のおなじみの反転シグナルロジックを維持しつつ、ビジュアル面の強化、ヒストリカル統計、ポイントベースのサマリーパネルを追加しています。MetaTrader 5 がサポートするあらゆる銘柄・時間足で動作し、単体のリバーサルツールとしてはもちろん、既存ストラテジー内の追加フィルターや、Expert Advisor 用のシグナルソースとしても利用できます。 Key Features 潜在的なトレンド転換ポイントを自動検出。 ノンリペイントの矢印シグナル:バーが確定した後は位置が変わらず、消えません。 2 つの動作モード:Mode 1 Classic(従来型 MT4 ロジ
OrderFlux | MetaTrader 5 用フットプリント・オーダーフロー バージョン 2.0 – アクティブトレーダー向けのリアルタイム Bid/Ask 可視化 OrderFlux は MT5 用のフットプリントおよびオーダーフローインジケーターです。価格がどこに動いたかだけでなく、その動きの中で何が起きているか(各価格レベルの Bid/Ask ボリューム、デルタ、インバランス、ボリューム分布)を表示します。 多くのチャートはローソク足の最終結果しか表示しません。OrderFlux はそこに至るまでの過程を表示します。ローソク足の形状だけでなく、市場参加者の動向を読み取りたい場合にまさに役立ちます。 Manual   -->   Klick ライブチャートにおいて、OrderFlux は主に次の3つの質問に答えます: 現在、どこで積極的な買いまたは売りの圧力が市場に参入しているか? どの価格レベルでボリュームが吸収、または拒否されているか? 現在の動きはセッションのコンテキスト(背景)にどう適合しているか? インターフェースで得られるもの メインチャートは、Canvas ベー
Quantum TrendPulse を ご紹介します。これは、   SuperTrend   、   RSI   、および Stochastic のパワーを 1 つの包括的なインジケーターに組み合わせて、取引の可能性を最大限に引き出す究極の取引ツールです。精度と効率を求めるトレーダー向けに設計されたこのインジケーターは、市場のトレンド、勢いの変化、最適なエントリー ポイントとエグジット ポイントを自信を持って特定するのに役立ちます。 主な特徴: SuperTrend 統合: 現在の市場動向に簡単に追従し、収益性の波に乗ることができます。 RSI精度: 買われすぎと売られすぎのレベルを検出し、市場の反転のタイミングに最適で、SuperTrendのフィルターとして使用されます。 確率的精度: 確率的振動を活用して、変動の激しい市場で隠れたチャンスを見つけます。SuperTrend のフィルターとして使用されます。 マルチタイムフレーム分析:   M5 から H1 または H4 まで、さまざまなタイムフレームで市場を常に把握します。 カスタマイズ可能なアラート: カスタム取引条件が満たされ
まず第一に、この取引インジケーターは再描画されず、再描画されず、遅延しないことを強調する価値があります。これにより、手動取引とロボット取引の両方に理想的なものになります。 ユーザーマニュアル:設定、入力、戦略。 アトミックアナリストは、価格の強さとモメンタムを利用して市場でより良いエッジを見つけるためのPA価格アクションインジケーターです。ノイズや誤ったシグナルを除去し、取引ポテンシャルを高めるための高度なフィルターを備えています。複雑なインジケーターの複数のレイヤーを使用して、アトミックアナリストはチャートをスキャンし、複雑な数学的計算をシンプルなシグナルと色に変換します。これにより、どのような初心者トレーダーでも理解して使用し、一貫した取引の決定を行うことができます。 「アトミックアナリスト」は、新規および経験豊富なトレーダー向けにカスタマイズされた包括的な取引ソリューションです。プレミアムインジケーターとトップノッチの機能を1つの取引戦略に組み合わせ、すべてのタイプのトレーダーにとって汎用性のある選択肢にします。 デイリートレーディングとスキャルピング戦略:高速で正確なデイ
RelicusRoad Pro: 定量的市場オペレーティングシステム 【期間限定】無制限アクセス 70% OFF - 2,000人超のトレーダーと共に なぜ多くのトレーダーは「完璧な」インジケーターを使っても失敗するのでしょうか? それは、文脈を無視して 単一の概念 だけでトレードしているからです。文脈のないシグナルは単なるギャンブルです。勝ち続けるには、 根拠の重なり(コンフルエンス) が必要です。 RelicusRoad Proは単なる矢印インジケーターではありません。完全な 定量的市場エコシステム です。独自のボラティリティモデリングを用いて、価格が推移する「適正価値の道(Fair Value Road)」をマッピングし、ノイズと真の構造的ブレイクを判別します。 推測はやめましょう。機関投資家レベルの「ロード・ロジック」でトレードを。 コアエンジン:「Road」アルゴリズム システムの中心となる Road Algo は、市場環境にリアルタイムで適応するダイナミックなボラティリティチャネルです。 安全ライン(平衡点) と、価格が数学的に反転しやすい 拡張レベル を投影します。 Si
Trend Forecaster – Since 2023. The Trend Forecaster indicator utilizes a unique proprietary algorithm to determine entry points for a breakout trading strategy. The indicator identifies price clusters, analyzes price movement near levels, and provides a signal when the price breaks through a level. The Trend Forecaster indicator is suitable for all financial assets, including currencies (Forex), metals, stocks, indices, and cryptocurrencies. You can also adjust the indicator to work on any time
Meridian Pro
Ottaviano De Cicco
5 (2)
Meridian Pro 2.00:MT5向けプロ仕様マルチタイムフレーム・トレンドマトリクス Meridian Pro 2.00 は、MetaTrader 5 向けのプロ仕様の適応型トレンドマトリクスです。オリジナルの Meridian トレンドエンジン、クリーンなチャート ribbon、確定足ベースのシグナル矢印、8時間足 dashboard、Fuel momentum、weighted consensus、synthetic HTF processing、そしてチャート上に直接表示される上位足コンテキストラインを統合します。 目的はシンプルです。現在のトレンド、マルチタイムフレーム構造、強度、momentum、EA-ready 状態を、複数チャートに無関係なインジケータを重ねるのではなく、1つの整理された workflow で読むことです。 Meridian Pro の違い 1つの適応型エンジン - 同じ volatility-aware Meridian ロジックを M1 から W1 まで適用します。 Synthetic HTF architecture - 上位足行は下位足デ
このダッシュボードは、選択されたシンボルの最新の利用可能なハーモニックパターンを表示するので、時間を節約し、より効率的に /   MT4バージョン 。 無料インジケーター:   Basic Harmonic Pattern インジケーター列 Symbol : 選択したシンボルが表示されます。 Trend :   強気または弱気 Pattern : パターンの種類(ガートレー、バタフライ、バット、カニ、サメ、サイファー、ABCD) Entry : エントリー価格 SL: ストップロス価格 TP1: 1回目の利食い価格 TP2: 2回目の利食い価格 TP3:   3回目の利食い価格 Current price :   現在値 Age (in bars):    最後に描画されたパターンの年齢 主な入力項目 Symbols:   "28 Major Currency Pairs "または "Selected Symbols "から選択。 Selected Symbols:   カンマで区切られた監視したいシンボル("EURUSD,GBPUSD,XAUUSD")。ブローカーがペアに接
作者のその他のプロダクト
Apex EA MT5
Botond Ratonyi
5 (3)
The Apex Daytrader EA —an advanced and safe trading solution designed for those who seek consistent and reliable results in the forex market without resorting to dangerous methods. This expert advisor combines sophisticated price action analysis with meticulously calibrated indicators, robust money management techniques, and dynamic exit strategies to navigate the complexities of the market. Latest sets in the comment section! : https://www.mql5.com/en/market/product/122633/comments?source=Site
Check out our website at ergodiclabs.co . Trade Health Indicator A vital-signs monitor for your trading account. Most stats panels show you win rate and profit — this one reads the health of your strategy and tells you, in plain language, whether your edge is real or just lucky. It reads your closed trade history directly from the account, reconstructs every position, and surfaces the diagnostics that a pretty equity curve hides — starting with the single most overlooked one: how long you hold
FREE
Check out my youtube channel about forex trading robots:  https://www.youtube.com/channel/UCL_p6fuQtNkg-1rRY69t5Ig Message me on telegram if you have any questions:  https://t.me/BRobotTrader H1 TIMEFRAME Updates and improvements(2021.08.12): USE THE SET FILES FROM THE COMMENT SECTION! This is the biggest update in the life of the KILIMANJARO EA, it got new features and NEW engine, plus many new parameters to optimize and play around with. ---It got the official TheNomadTrader Dynamic e
Imperium Pattern EA   USE IT ONLY WITH THE SET FILES I POSTED TO THE COMMENT SECTION.  This is the biggest update in the life of the Imperium Pattern EA, it got new features and engine. ---It got the official TheNomadTrader Dynamic engine system alongisde with good risk:reward ratio ---New feature that allows traders to tell the EA after how much time(X value in minutes) the EA can close trades by dynamic exit. This feature boosts the EA perfoemance and it is a key feature in crisis situati
Taurus is a high quality EA designed to be consistently profitable in the long run. Strategy: It is a Swing Trading Strategy that finds key turning points and trades them. It uses fix tight stop loss and dynamic TP to catch swings. It is working on the 7 best pairs for diverzification calculated by AI to maximize reliability and minimize DD.  EA works on the following Pairs:(set files in the comments) -- EURUSD H4(DEFAULT) -- AUDUSD H4 -- CADCHF H4 -- NZDCAD H4 -- AUDNZD H4 -- USDJPY H4 -- A
Powerful Price Action Engulfing Doji Robot MT4 version Package Contains: (Price includes both versions) SET files in Comment section. 1. Powerful Price Action EA Advanced Version with NomadTrader Money Management System: --Full EA with all adjustable settings and parameters to tweak or optimize. --It uses the NomadTrader Money Management system with Dynamic exit strategy based on Price %(percent) based Stop loss, Take Profit and Adjustable Time Filter to 1 minute preciseness, all parameters a
This is a gold trader robot. Gold trading is very much different than forex trading because of many variables and sentiment differences about the assets. I created and coded a completely new algorithm for this strategy. The algorithm doesnt use any technical indicators or well known price action patterns. Based on all my testing and and analyzing the different kind of patterns and indicators i realized that, to make a unique gold trading strategy it is just not enough to combine existing tool
This EA does not use martingale, averaging, grid, or any dangerous strategies. This EA is always using hard stop loss and take profit. Always use the set files I published in the comment section! More sets will come for wheat, gasoline, and other commodities) (All pairs were tested for 10 years with 99.9% every tick data, More come soon for minor and exotic pairs) Package Contains: --Full EA with all adjustable settings and parameters to tweak or optimize. --It uses the NomadTrader Money Mana
Get to know Our cutting-edge trading algorithm: The EA is currently working on 17 currency pairs on the H4 timeframe. Set files are provided in the comment sectio n, always use them! The recommended testing period is minimum 5 years since it is a long term EA. The EA has been tested for 10 years with high quality tick data + variable spread + commision + swap, and stress tested with extreme settings is quant analyzer's Monte Carlo analysis. You can see the full portfolio analysis in the screensh
The Apex Daytrader EA —an advanced and safe trading solution designed for those who seek consistent and reliable results in the forex market without resorting to dangerous methods. This expert advisor combines sophisticated price action analysis with meticulously calibrated indicators, robust money management techniques, and dynamic exit strategies to navigate the complexities of the market. Once you bought the EA write me and I am going to add you to the private support and discussion group of
This EA was researched and coded for years to come to life. It was tested with 99.9% tick data with spread swap and commission on all the currencies. The package includes fully tested and stress tested set files. Always use the latest set files from the comment section! Recommendations: Minimum 1000$ starting deposit VPS for better trading experience The set files are for H1 timeframe At least 1:10 leverage Introducing the Leopard EA for MT5: This Expert Advisor has been meticulously develop
Powerful Price Action Engulfing Doji Robot MT5 version Package Contains: (Price includes both versions) SET files in Comment section. 1. Powerful Price Action EA Advanced Version with NomadTrader Money Management System: --Full EA with all adjustable settings and parameters to tweak or optimize. --It uses the NomadTrader Money Management system with Dynamic exit strategy based on Price %(percent) based Stop loss, Take Profit and Adjustable Time Filter to 1 minute preciseness, all parameters ar
USE IT ONLY WITH THE SET FILES I POSTED TO THE COMMENT SECTION.  Youtube video: https://www.youtube.com/watch?v=kQN5LTd91rk&amp ;t=2s This is the biggest update in the life of the Imperium Pattern EA, it got new features and engine. ---It got the official TheNomadTrader Dynamic engine system alongisde with good risk:reward ratio ---New feature that allows traders to tell the EA after how much time(X value in minutes) the EA can close trades by dynamic exit. This feature boosts the EA perfoe
Always use the official set files from the comment section! Currently set files are available for the following currencies: EURUSD H4 USDJPY H4 NZDUSD H4 AUDUSD H4 CHFJPY H4 XAUUSD H4 More sets will come for wheat, gasoline, and other commodities) (All pairs were tested for 20 years with 99.9% every tick data, More come soon for minor and exotic pairs) Strategy: The strategy uses cutting edge technology to find the best entry signals and calculate if it fits into the database of statistics tha
Get to know Our cutting-edge trading algorithm: The EA is currently working on 17 currency pairs on the H4 timeframe. Set files are provided in the comment sectio n, always use them! The recommended testing period is minimum 5 years since it is a long term EA. The EA has been tested for 10 years with high quality tick data + variable spread + commision + swap, and stress tested with extreme settings is quant analyzer's Monte Carlo analysis. You can see the full portfolio analysis in the screensh
Laguerre-Geometric Moving Average with Range Filter This is the first Indicator I am uploading from my series of indicators, that I am using in my professional EAs. Overview The Laguerre-Geometric Moving Average indicator is an advanced technical analysis tool that combines three sophisticated mathematical approaches to provide enhanced trend detection and market analysis. This hybrid indicator integrates the Laguerre Filter, Geometric Moving Average (GMA), and intelligent range filtering to de
Spectrum Trend Pro MTF Professional Multi-Timeframe Moving Average Analyzer Spectrum Trend Pro MTF is a powerful yet lightweight tool designed for traders who want a clear, structured view of market direction across multiple timeframes. It builds a full-spectrum map of the trend by analyzing dozens of moving averages — from fast intraday shifts to long-term momentum — and visualizes the overall sentiment in a compact on-chart dashboard. Whether you’re trading trends, pullbacks, or reversals, Sp
フィルタ:
Tahj-R Scott
21
Tahj-R Scott 2026.05.17 17:44 
 

Thanks Botond, it looks great. any planned updates or is this the final product?

Botond Ratonyi
5536
開発者からの返信 Botond Ratonyi 2026.05.17 18:42
I am planning updates for this, but not too complex, I want it to be a simple app for some easy to read stats on the screen. I am going to have other high complexity dashboard apps, that I finished, just have to put up to MQL5.
lioness0
14
lioness0 2026.03.04 17:18 
 

ユーザーは評価に対して何もコメントを残しませんでした

Botond Ratonyi
5536
開発者からの返信 Botond Ratonyi 2026.03.05 17:53
Thanks, I am planning to develop it further!
レビューに返信