YouTubeにあるマーケットチュートリアルビデオをご覧ください
ロボットや指標を購入する
仮想ホスティングで
EAを実行
EAを実行
ロボットや指標を購入前にテストする
マーケットで収入を得る
販売のためにプロダクトをプレゼンテーションする方法
MetaTrader 4のための新しいテクニカル指標 - 22

Secured Profits – 本当に確保された利益を即座に表示 各取引で実際にどれだけの利益を保護しているかご存知ですか?
Secured Profits は、保有中のポジションに基づき、ストップロスによって 実際に確保された利益 の金額をリアルタイムで表示する、MT4用のスマートで強力なインジケーターです。 他のツールと異なり、 Secured Profits は単に「見えている」浮動利益やストップで守られている利益を合計するだけではありません。すべてのポジションを 総合的に比較 し、実際に守られている金額を計算します。たとえば、1つのポジションで $10 利益が確保されていても、他のポジションが -$5 のリスクを抱えていれば、実際に確保されているのは $5 だけであり、それが画面に表示される金額です。 主な特徴: すべての未決済ポジションのストップロスを考慮し、 本当に確保された利益 を表示 誤った安心感を排除 し、未保護のリスクを含めた後に残る本当の保護額のみを表示 デフォルトで左下に表示される カスタマイズ可能なラベル をチャート上に表示
FREE
Nexus Pulse Detector — 価格構造に基づく高度なシグナルシステム
仕組み
Nexus Pulse Detector は再構築されたトレンドツールでも、精度を装ったリペイント系インジケーターでもありません。これは、価格の圧縮および拡張フェーズにおける方向的な不均衡を監視する、構造ベースのシグナルエンジンです。各シグナルは、買い手と売り手の主導権の移行を反映し、複数の条件によりブレイクアウトの正当性が検証されます。
ノイズではなく価格構造にフォーカス
単純な高値・安値に反応するのではなく、最近の構造的な極値と短期的な価格平均との関係性から圧力ポイントを抽出します。それらのレベルが吸収されたか、拒否されたか、十分な勢いで突破されたかを判断し、その結果としてのみ反応します。
市場が証明したときのみシグナルを表示
あらゆる変動でシグナルが発生するわけではありません。Nexus Pulse Detector は、構造の逸脱、内部トレンドの変化、そして直近の市場対称性からの明確なブレイクという複数の要因の合致を待ちます。これらが重なったときにのみ、シグナルが表示され

XAU PulseEdge — ゴールド向け精密エントリーシステム
ゴールド専用に設計
XAU PulseEdge は単なるトレンドフォローや遅延パターンへの反応を目的としたものではありません。短期と長期の市場リズムの乖離を評価し、XAUUSD における高精度なエントリーポイントを特定するよう設計されています。一般的な閾値ベースのロジックではなく、モメンタムの速いサイクルと遅いサイクルの間に存在する内部の対立構造をマッピングします。
静的ではなく動的な条件
エントリーシグナルは、複数の構造的要素がリアルタイムで整合したときにのみ生成されます。モメンタム中央値のクロスオーバー、加重スムージングを用いたシグナルラインの確認、カスタムEMAフィルターによって捉えられるRSIの内部的な不均衡。これらは単なるトリガーではなく、多層分析によって導かれた戦略的な転換点です。
No Repaint
インジケーターは固定された非リペイントの矢印を描画します。これは視覚的な演出ではなく、モメンタムの逆転が高速/低速の中央値の間で発生し、さらに RSI がエネルギー的に整合したときの結果です。
Breakout Box Sentinel Signal
システムのロジック
Breakout Box Sentinel Signal は単なるグラフィックのオーバーレイではありません。これは価格の圧縮によって形成されるブレイクアウトゾーンを通じて、方向性のある動きを検出するための構造的なツールです。従来の指標のように滑らかにしたり視覚的なノイズを発生させたりすることはなく、市場のボラティリティに基づいた動きを、セッションに対応したクリーンなフレームで捉えます。
動作の仕組み
Breakout Box Sentinel Signal は遅延シグナルに頼るのではなく、繰り返されるパターンによって形成された価格構造の不均衡を観察します。これらのゾーンは、価格拡大の前兆として機能し、トレーダーが予測に頼らずにエントリーポイントを視覚的に把握するのに役立ちます。ロジックは、ボラティリティによる衝動と重要なゾーンへの価格反応に基づいています。
セッションへの適応
市場の動きは流動性によって異なります。このインジケーターはアジア、ロンドン、ニューヨークなどの主要取引セッションに自動的

Binary Chronos – MT4用バイナリーオプションインジケーター バッファー信号 :矢印表示でエントリーが簡単、自動売買にも対応。 ️ 満期 :デフォルトは1本のローソク足。 トレンドフォロー :トレンドを分析し、最適なエントリーポイントを検出。 現在の足でエントリー :シグナルは即時エントリー用。 ️ マーチンゲール :初回取引が失敗したら 次の足で1回だけマーチン 。 LevelEn :値が高いほど、シグナルの品質と精度が向上します。 どの時間足でも対応 。 リペイントなし :信頼性の高い安定したシグナル。 アラート機能 :ポップアップとサウンド通知。 Binary Chronos — リスクを抑えたトレンドエントリーが可能なインジケーター!
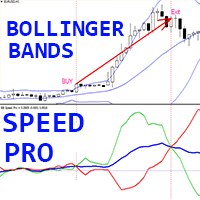
MT4向けのユニークなトレンドCrypto_Forexインジケーター「 Bollinger Bands Speed Pro 」。リペイント機能なし。
- このインジケーターの計算は物理学の方程式に基づいています。 - Speedは、標準的なボリンジャーバンドの1次導関数です。 - Bollinger Bands Speed Proインジケーターは、BBミドルラインとBBボーダーの方向転換速度を示します。 - デフォルト:青線はBBミドルラインの速度、赤線は下端ボーダーの速度、緑線は上端ボーダーの速度です。 - トレンド戦略では、BB Speed Proの使用をお勧めします。BBミドルラインの速度が0未満の場合はトレンドが下降、0を超える場合はトレンドが上昇します。 - 以下のトレードエントリーを検討できます。 - 青線が0を上回り、緑線が青線を上向きにクロスしたら、買いトレードを開始します。 - 青線が0を下回り、赤線が青線を下向きにクロスしたら、売りトレードを開始します。 - インジケーターにはモバイルとPCのアラートが組み込まれています。 - このインジケーターには、スプレッド
IMPULSE REACTOR – 賢くスキャルピングし、素早く反応する。
Impulse Reactor は、カスタム加重された価格エンジンを通じて市場構造を監視するリアルタイム実行フレームワークに基づいて構築されています。従来のオシレーターや移動平均のクロスを使用するのではなく、ローソク足内の加速と減速フェーズに基づく方向性モメンタムを追跡します。システムは各ローソク足を個別に評価し、短期的な価格のズレと動きの強度に応じてバイアスを再調整します。
最新情報を受け取る
将来のリリースやアップデートについていち早く知るには、公式チャンネルに参加してください: https://www.mql5.com/en/channels/signalsandindicators
シグナルメカニクス
すべてのローソク足は、潜在的なエントリーポイントとして解釈されます。インジケーターは、前方加重の偏差モデルを使用して各ティックで方向性の強さを再計算し、価格の流れのリズムに適応します。シグナルは反応的ではなく、予測的です。画面上に表示されるのは、短期トレンドの論理に基づく予測された反転ポイント

Prime Strike Signal – 明確なエントリー。リペイントなし。
Prime Strike Signal No Repaint Never は、視認性と安定性を求めるトレーダーのために設計された、シンプルでルールに基づくシグナルツールです。チャート上に即座に矢印を表示し、相場の短期的な方向転換にスムーズに追従できるようサポートします。
最新情報をチェック
今後のアップデートや新リリース情報を受け取るには、公式チャンネルに参加してください: https://www.mql5.com/en/channels/signalsandindicators
ロジック
このシステムは、異なる平滑化期間を用いた2つの価格ベースの計算を比較し、モメンタムの変化を検出します。算出された差分は第2のロジックレイヤーによってフィルタリングされ、有効なクロスが発生した場合にのみシグナルが発生します。これにより、ノイズではなく実際の価格の動きに基づいたエントリーが可能になります。
リペイントしますか?
しません。本ツールは、ローソク足が完全に確定してからシグナルを表示します。シグナル
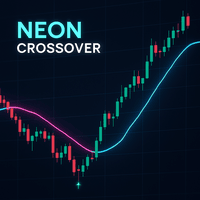
Neon Crossover – ダイナミックモメンタムおよびリバーサルインジケーター 最新情報を受け取るにはチャンネルに参加してください: https://www.mql5.com/en/channels/forexnewadvisor
Neon Crossover は、モメンタムの反転と極端な状態を高精度で検出するために設計された多機能インジケーターです。価格行動の深層分析を行い、複雑な上昇/下降圧力ロジックと動的な平滑化、BBsを組み合わせています。EURUSD、GBPUSD、USDJPY、GBPJPYなどの通貨ペアで、M1、M5、M15、M30、H1のスキャルピングおよびデイトレード戦略に最適化されていますが、すべての資産と時間足に対応可能です。
コアロジックには以下が含まれます: 価格の極端な値を使用した独自の圧力ベースの計算 ノイズを減らすための平滑化信号線(SMA、EMAなど) BBsによるボラティリティコンテキストの提供 過買い、過売り、極端な過買い/過売りの閾値検出 レベルが越えられると、インジケーターは矢印を描画し、(オプションで)標準および極端な閾値に基づいて

Bulls vs Bears Oscillator Pro Bulls vs Bears Oscillator Pro is a powerful custom indicator designed to measure the real-time strength of buyers (bulls) versus sellers (bears) in any financial market. Using a normalized approach to price deviations from a dynamic EMA baseline, this tool provides high-precision signals with clear visual markers. Key Features: Oscillator-based logic : Fluctuates around zero, showing bull/bear dominance. Clear entry signals : Buy/sell arrows when extreme zon

CCI (Commodity Channel Index) Indicator – Technical Accuracy on Your Chart Description:
The CCI (Commodity Channel Index) is a professional technical indicator designed to identify overbought and oversold conditions, as well as potential market reversal points. This indicator calculates the deviation of the typical price from its moving average, making it a powerful tool for both scalping and medium- and long-term trading.
Key Features:
Smooth CCI line with standard ±100 levels for clear re

It is a technical indicator that combines three of the most popular oscillators in technical analysis: MACD, RSI, and Stochastic. The integrated advanced formula combines their signals to provide a single, clear and effective line, eliminating noise and helping you make quick, visual decisions.
What makes this indicator unique?
Integrates the difference between the MACD, RSI, and Stochastic into a single combined formula.
It displays the result in a separate window, like the ATR, making i

Pullback Scanner Line – Pullback Signal Indicator by Mr. Rami
Pullback Scanner Line is an advanced indicator that helps accurately identify trading opportunities based on reversals within the trend. It combines the strength of an exponential moving average (EMA) and Bollinger Bands to calculate a "pullback score," which reflects the probability of a favorable price reversal or continuation.
Key Features:
Uses a configurable EMA to detect trend direction.
Uses Bollinger Bands to measure vola
BTC Halving Objective Indicator
The BTC Halving Objective Indicator is a unique tool designed for traders and investors who follow Bitcoin halving cycles. This indicator adds vertical lines to the chart to mark previous and future halving events and displays in a sub-window whether the price is meeting historical post-halving growth targets.
What does this indicator do? It automatically draws key Bitcoin halving dates (previous and projected).
Calculates a target performance scenario based
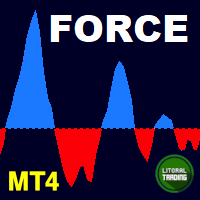
For those who like trend the Force will be a very useful indicator. This is because it is based on the famouse ADX, which measure the strenght of a trend, but without its 3 confusing lines. Force has its very simple interpretation: if the histogram is above zero level the trend is up, otherwise it is down. You can use it to find divergences too, which is very profitable. If you have any doubt or suggestion, please, contact me. Enjoy!
MT5 version: https://www.mql5.com/en/market/product/41928
T
FREE

Unlock the power of Smart Money trading with the Fear Detector – a modular, trend + signal indicator built for XAUUSD on M15 . This cutting-edge tool combines Break of Structure (BoS) , Order Blocks , Fair Value Gaps (FVG) , and custom trend logic to detect high-probability trade opportunities. Features: Smart Money Concepts (BoS, OB, FVG) Buy/Sell signals with cooldown filters Multi-timeframe MA trend confirmation Signal alerts + email notifications Custom GUI-ready & optimized for gold scalp
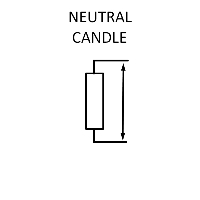
Neytral sham - Bu kunlik savdo uchun mo`ljallangan bo`lib, Neytral sham asosida daraja yaratilib ushbu darajani qaysi tarafga buzib o`tishiga qarab bozorga kirish metodlari qo`llaniladi - Taymfreym M15, H1, H4 - Valyuta paralarida qo`llash yaxshi natija beradi - Grafikda CTRL+Y vertikal darajalar yoqiladi Muhim: Savdo qilishdan oldin bektest qilishni unutmang! -

The indicator is designed to display information about current trading. The current information and statistics panel displays data on the number of trading orders, their profit and the number of lots. The equity status as a percentage of the balance of funds and the total profit of all orders on this instrument are also displayed. In the statistics panel, you can see information on closed orders from the beginning of the specified date in the settings. The panels have flexible settings for size

To get a signal, the indicator uses the linear break formula, the signal is not redrawn, since no indicators based on the moving average are used to get the signal, only price values and chart candles
Indicator settings 1 Line for signal - number of lines for forming a signal breakthrough 2 Up arrow colore - color of the up arrow 3 Down arrow colore - color of the down arrow 4 MTF period in minutes - selection of the period for multi-timeframe display (in minutes) 5 UpArrowCode - code of t

TrendMomentumLine is a powerful technical indicator that combines trend direction and market momentum strength into a single line. Its intelligent calculation integrates an Exponential Moving Average (EMA) and normalized momentum analysis, providing an accurate reading between 0 and 100 that allows you to identify optimal entry zones.
️ Detects high-probability zones by combining trend and strength. ️ Useful for scalping, intraday, and swing traders. ️ Perfect for confirming entries and exi

Detailed blog post with screenshots here: https://www.mql5.com/en/blogs/post/762513
Features:
This scanner will show: NRTR Basket Trading Trend direction Last NRTR Switch (breakout) - number of bars and if it was a high volume bar How many bars has the SR stayed steady for When price last entered an NRTR shadow When price bounced off the NRTR shadow back inside
NRTR Explained: https://www.mql5.com/en/blogs/post/762509
Basket Trading If you like to basket trade, then you can set multiple scann

This indicator help to mark the high and low of the session Asian,London,Newyork , with custom hour setting
This indicator is set to count from minute candle so it will move with the current market and stop at the designated hour and create a accurate line for the day.
below is the customization that you can adjust :
Input Descriptions EnableAsian Enables or disables the display of Asian session high and low levels.
EnableLondon Enables or disables the display of London session high and
FREE

Support and Resistance is the most basic science known to traders.
However, many people don't expect that the indicators used by big traders do not use indicators that have complex and complicated data, but rather return to using the most basic, namely Support and Resistance.
Here is the Support and Resistance Indicator that I made as simple as possible. Here you can determine the limits of strong Support and Resistance based on several provisions that you need.
In this indicator, you can fi

Template Toggle Indicator General Description The Template Toggle indicator is a custom tool for the MetaTrader 4 platform, designed to streamline the process of switching between predefined chart templates. It displays interactive buttons on either the main chart or a sub-window, allowing traders to quickly apply different templates without manually accessing the template menu. Ideal for traders who frequently switch between chart setups for various currency pairs or trading strategies. Key Fea
FREE

Phantom Bands – MT4 Indicator Zone-Based Reaction Levels for Price Action Traders Phantom Bands is a MetaTrader 4 custom indicator that draws multiple adaptive bands on your chart. These levels are designed to assist traders in identifying potential price interaction zones based on internal logic — particularly useful for short-term discretionary strategies. Description This indicator creates zone-based bands around internal pivots. The logic behind the bands is based on price interaction

Unlock precision trading with the FVG MUSKX MTF —a next-generation tool engineered to transform your market analysis on MetaTrader 4. Designed with accuracy and usability in mind, this powerful indicator identifies Fair Value Gaps (FVGs) across multiple timeframes, giving traders a clear advantage in spotting institutional footprints and potential price imbalances. Key Features Sharp FVG Detection
Detect Fair Value Gaps with high precision across selected timeframes. Never miss a
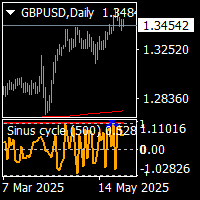
sinus cycle indicator is a non repaint indicator for mt4 terminal. it works all timeframes and all pairs. suitable for experienced traders and beginners. it gives sinus wawes .when the intensive waves appear , it is trend change points. level 1 or -1 is trend reversal . cnt numbers is the bars numbers on the chart.it can be increase ore decrease. minimum cnt value is 500. wave is default 500 value.and can not change if prices on top, cycle level 1 oe -1 means trend will down. if prices down ,c

Key Features: Instant BUY/SELL Signals with clear entry levels 3 Take Profit Levels (TP1, TP2, TP3) – customize your risk/reward Dynamic Stop Loss based on market structure Trendline Breakout Logic – detects breakout confirmation automatically Real-time Signal Notifications (alerts, emails, push notifications) Works on all timeframes (M5 to D1 recommended) Compatible with all Forex pairs, gold, indices, and crypto How it works: Wait for a BUY or SELL signal based on trendline break
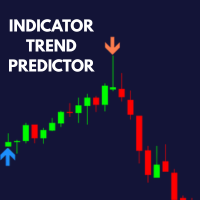
Easy Trend Predictor: Visual Signal Indicator for MT4 The Easy Trend Predictor is a straightforward and user-friendly indicator for MetaTrader 4 that displays clear directional arrows based on trend-based logic. Designed to work across any symbol or timeframe, this tool helps bring clarity to your technical analysis by visually highlighting potential shifts in price movement. Key Features: Directional Arrows
Displays prominent buy and sell arrows directly on the chart based on internal trend-d

Automated Trading Session Logging and Real-Time PnL Display Overview Trade Journal Plus is a MetaTrader 4 indicator designed to automatically document your trading sessions and display real-time performance statistics on the chart. It helps traders analyze and review sessions efficiently—without the need for manual logging. Key Features Automatic Session Logging
Automatically records trade entries and exits, trade duration, and session statistics as you trade. Real-Time PnL Display
Shows the

This indicator displays potential price levels, support and resistance levels, highest and lowest price levels for Asian, European and American sessions. It works for the day that you select from user interface. It is suitable for gold, bitcoin, all currencies, commodities, crypto currencies and all investment instruments on the metatrader. You can use on the your day trade transactions easily. This indicator is for metatrader4 platform.

The indicator pick out trending pairs in that present day as it shown in screanshorts. It designed to make the users job very easy. How the Indicator works It shows 5 trending pairs and your job is to pick ones that suit your strategy. The Indicator is suitable for day traders and it shows the action during that day. The indicator is more like Currency Strength at advanced level. The indicator shows trending pairs in pips telling you which pair is leading. The Indicator numbers is updated every

This indicator is designed to help you locate trending pairs in forex market s
Time Frames available M5 M15 M30 H1 H4 DAILY ( Recommended for day trading ) Weekly Monthly
In these time frames the indicator tells how much the markets have moved from the last 5m, 15m, last 24 hours, last 7 days, last 30 days and many others times frames tells the same thing.
Daily time frame is recommended because it tell use which per is trend during that particular day, It recommended fro trend pull back str

M1 SNIPER は使いやすいトレーディングインジケーターシステムです。M1時間足向けに設計された矢印インジケーターです。M1時間足でのスキャルピングのためのスタンドアロンシステムとして、また既存のトレーディングシステムの一部としても使用できます。このトレーディングシステムはM1時間足での取引に特化して設計されていますが、他の時間足でも使用できます。元々、この手法はXAUUSDとBTCUSDの取引用に設計しましたが、他の市場においても役立つと考えています。 インジケーターのシグナルは、トレンドの方向と逆方向に取引できます。インジケーターのシグナルを利用して両方向に取引するのに役立つ特別な取引テクニックをご紹介します。この手法は、特別な動的なサポートとレジスタンスの価格帯を利用することに基づいています。 ご購入後、M1 SNIPER矢印インジケーターをすぐにダウンロードできます。さらに、M1 SNIPERツールのすべてのユーザーに、以下のスクリーンショットに表示されているApollo Dynamic SRインジケーターを無料で提供しています。この2つのインジケーターを組み合わせることで

KT Gaussian Trend Filter は、ガウスフィルターと線形回帰スムージングを組み合わせることで、明確かつ正確なトレンド分析を実現します。わかりやすい買いと売りのシグナルを生成しながら、市場の長期的な方向性を効果的に示します。
機能
カスタマイズ可能なガウスフィルター: 期間やポール設定を調整してスムージング精度を高め、トレンドの明瞭さを向上。 線形回帰による強化: ガウススムージングをさらに最適化し、市場のノイズによる誤信号を最小限に抑えます。 マルチタイムフレームスキャナー: 複数の時間軸におけるガウストレンドの方向を自動検出し、わかりやすいダッシュボードに表示します。 トレーリングバンド機能: トレンド中の深い押し目でのエントリーポイントを簡単に把握可能。 カラーカスタマイズ対応: チャートの配色や取引スタイルに合わせて色を自由に設定できます。 内蔵アラート機能: ポップアップ、メール、プッシュ通知、サウンドアラートで即時通知を受け取れます。
使い方 このインジケーターは明確なシグナルを提供し、トレーダーがエントリーやエグジットのタイミングを判断しやすくします
KT Trend Reversal Probability は、改良された RSI ベースのアルゴリズムを使用して、トレンド反転の確率をリアルタイムで計算します。この確率は明確なパーセンテージで表示され、現在のトレンドが弱まっているのか、それとも新たなトレンドが形成されつつあるのかを判断する助けになります。 エントリータイミングの計画や、エグジットの最適化など、どの場面でもこのインジケーターは、データに基づいた優位性をあなたのトレーディングに提供します。
特徴
振動系に直接、明確な反転確率(%)を表示し、トレーダーが事前にトレンドの変化を予測するのに役立ちます。 高速と低速の RSI シグナルを組み合わせた独自のオシレーターを採用し、最小限のラグで反転の可能性を検出します。 直感的なカラーフィルター(グラデーション)を使って反転の強弱を視覚的に表現し、一目で状況を把握できます。 反転の確率が重要な水準に達したとき、または新しいトレンドが始まる兆候が現れたときにアラートを送信し、大きな市場変化を見逃さないようサポートします。 オシレーターの期間や確率のしきい値など、すべてを自由にカス
オープニングレンジブレイクアウトインジケーターは 、ICT(インナーサークルトレーダー)、スマートマネーコンセプト(SMC)、 ボリューム または オーダーフロー ベースの戦略といった機関投資家の取引コンセプトに従うトレーダー向けに設計されたセッションベースの取引ツールです。このインジケーターは重要なセッションオープニングレンジをプロットし、トレーダーが主要な世界為替セッション全体にわたって潜在的な 流動性スイープ、ブレイクアウトゾーン、フェイクアウト、 そして 重要な日中レベル を特定できるようにします。 この戦略は 、オープニングレンジの概念に基づいています。これは、 各セッションの開始後に事前に定義されたタイムボックスであり、トレーダーがマーケットメーカーの意図、短期的なバイアス、日中の方向性を判断するのに役立ちます。このインジケーターは、レンジの高値と安値をマークし、それらのレベルを拡大することで、 スマートマネーブレイクアウト 、 セッションスイープ 、 フォールスブレイクアウト 、 フェアバリューギャップ(FVG) 、 レンジ拡大を 視覚的に監視するのに役立ちます。 こ
Minotaur Waves は、市場の転換点を検出し、方向性の変化を高精度で確認するために設計された高度な分析インジケーターです。 Minotaur Oscillator と動的なアダプティブバンド構造を組み合わせ、信頼性の高い視覚的シグナルを提供し、的確なエントリー判断を支援します。すべての通貨ペアに対応しており、特に EURUSD、GBPUSD、USDJPY の M1、M5、M15、M30 タイムフレームで最適なパフォーマンスを発揮します。
アップデートとガイドはこちらからご覧ください: https://www.mql5.com/en/channels/forexnewadvisor
システムの主な構成: 動的バンド: モメンタムの変化をリアルタイムで検出し、重要なブレイクアウトゾーンを可視化 Minotaur Oscillator: モメンタムのヒストグラム表示により、反転ゾーンを視覚的に示す 極値の検出: +33(高値ピーク)または -33(安値ピーク)の確定値が検出されたときのみアラートを発動 ノイズ制御: トレンド中の過剰なシグナル発生を防ぐ内部フィルターロジックを搭

Pulse Mark Pro – トレンド転換を精密に検出 PulseMark Pro は、市場の方向転換を早期に検出するために設計されたインジケーターです。通常のインジケーターが直近のローソク足だけに依存するのに対し、PulseMark Pro は 新たなトレンドの可能性ある始まり を検出するための独自ロジックを採用しています。短期的には直感に反するように見えても、価格の勢いの変化を視覚的に表現し、カラーのシグナルポイントと動的な点線トレンドラインを提供します。
トレンド転換ロジック このツールの中核には、チャート上に カラー付きの点 として表示されるトレンド変化の検出ポイントがあります。この点は、アルゴリズムが上昇から下降、またはその逆へのモメンタムの変化を高い確率で検出した瞬間を示します。 PulseMark Pro の特徴は、このシグナルポイントが 直近のローソク足の色や方向に依存しない ことです。代わりに、ボラティリティ、過去の価格アクション、統計的偏差を考慮した独自の計算式を使用します。その結果、この点は 明確な価格変動の前または後 に表示される場合があります(市場のノイ
Trend Flip Pro
Trend Flip Pro は、従来の視覚的なオーバーレイに依存せず、内部モメンタムの変化に基づいて市場の方向転換を検出する構造型のシグナルシステムです。各矢印は、買い手と売り手の間のコントロールの明確な変化を示しており、表面的な価格変動ではなく、根本的な方向性の強さに基づいています。
リペイントなし — シグナルは固定
このツールはリペイントしません。シグナルは厳格な条件が満たされた場合にのみ表示され、一度表示されたら変更されず固定されます。他のインジケーターのようにシグナルが遅れたり修正されたりすることはなく、Trend Flip Pro は市場の不均衡が発生した瞬間に正確に反応します。
複数資産と複数時間足に対応
主要な通貨ペアとすべての時間足に対応しており、M1 の高速スキャルピングから H4 の構造的なトレードまで幅広く活用できます。中でも XAUUSD においては高いボラティリティのおかげで、鮮明なモメンタム反転を捉えるのに非常に優れています。このアダプティブロジックは、短期エントリーから構造的なリバーサルまで、様々なトレーディング
ZONE CRACK ALPHA — 市場フェーズ転換の戦略的検出ツール
Zone Crack Alpha は、価格行動における構造的な転換を二層構造のロジックで捉えるよう設計されたインジケーターです。遅延インジケーターや従来の手法に依存せず、ヒストグラムの極性変化と方向性のある視覚的シグナルを活用して、潜在的なブレイクアウトのタイミングを正確に捉えます。
シグナルロジック
本手法では、ゼロ軸をまたぐヒストグラムのクロスが主要なトリガーとして機能します。トレンドの転換が確認されると(たとえば、上昇から下降、または拡張へと変化する局面)、チャート上に矢印として視覚的なマーカーが表示されます。これらのシグナルはローソク足の確定後にのみ表示され、リペイントや予測的な描画は行われません。
シグナル生成プロセス
各シグナルは、直近の市場ダイナミクスをスムージングした分析結果に基づいて生成されます。短期的なノイズを除去しつつ、構造的な変化にのみ反応する設計により、外的インジケーターや単なる価格変動に惑わされない高精度なエントリーポイントを提供します。
実行の透明性
チャートに表示さ

Auric Pulse System
戦略的な市場の反転を検出するために精密設計されたツール
Auric Pulse System は、高ボラティリティ市場における構造的な明確さを求めるトレーダーのために開発された高解像度のシグナルシステムです。特に XAUUSD(ゴールド)の複雑な市場環境に最適化されています。従来の視覚的オーバーレイや遅延型オシレーターとは異なり、本システムは市場内部の力学と非対称的な価格変動に基づいて、方向性のあるトリガーを正確に抽出します。
最新情報を受け取る
将来のアップデートや新リリースの情報をいち早く受け取りたい方は、公式チャンネルにご参加ください: https://www.mql5.com/en/channels/signalsandindicators
モメンタム転換とレンジブレイクアウトのための設計
このシステムは、レンジ拡大の速度と一貫性、急激な流動性の引き上げ、平均ボラティリティからの乖離を分析することで、重要な転換点を特定します。各シグナルは、時間的な異常と方向圧力の整合性が確認されたときにのみ発生する、複数条件の収束によって生

Snap Entry System
高圧市場環境における正確なエントリーのために設計されたシステム
Snap Entry System は、特にボラティリティの高い相場において、タイミングと構造における正確性を求めるトレーダーのために開発された洗練されたシグナルアーキテクチャです。中心となる ロジック は、相対的な価格動向と方向性の確認を組み合わせ、外部インジケーターに頼らず、内部の価格挙動に基づいた戦術的なエントリーポイントを提供します。
最新情報を受け取る
将来のリリースやアップデート情報を受け取るには、公式チャンネルにご参加ください: https://www.mql5.com/en/channels/signalsandindicators
真の構造変化に基づいたエントリーロジック
このシステムは、ランダムなスパイクや一般的な買われすぎ・売られすぎの条件には反応しません。短期および中期の内部フローの相互作用を評価し、実際のトレンド開始前に見られる加速パターンを計測します。方向性のバイアスが確認され、圧力の変化が明確になったとき、シグナルは即座に発生し、チャート上
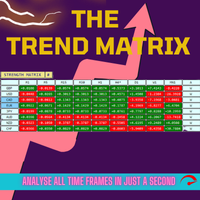
Trend Teller は、すべての主要通貨ペアと全時間足(M1 から MN1)にわたる市場トレンドを一目で把握できる、パワフルで直感的なダッシュボードツールです。
トレーダーによって、トレーダーのために作られたこのツールは、トレンド分析の迷いを排除し、市場の全体像に沿ったトレードを可能にします。 初心者トレーダーの多くが市場の方向性を判断するのに苦労しており、実はプロトレーダーでさえも見誤ることがあります。 だからこそ、Trend Teller はすべてのレベルのトレーダーに最適です。 主な機能: マルチタイムフレーム分析
全時間足にわたって、主要通貨ペアのトレンドの強さと方向性を瞬時にスキャン。スキャルピングからスイングトレードまで、あらゆるスタイルに対応。 カスタマイズ可能な表示
情報が多すぎる?問題ありません。値のみの表示、色付きシグナル、特定の時間足の非表示など、自由に調整可能。 通知機能付き
ずっと画面を見ている必要はありません! 強いトレンドやトレードアイデアが出現したときに通知を受け取り、最適なタイミングで行動できます。 初心者にもプロにも最適
トレンドの方向性を知る

TradeZones Fibonacci Pro – 動的なフィボナッチゾーンとスマートなトレーディングアラート フィボナッチを使って重要な反転ゾーンを自動検出。エントリーの精度を高めましょう。 TradeZones Fibonacci Pro は、設定可能な期間に基づいてチャート上に最も重要なフィボナッチレベルを自動で描画し、潜在的な買い・売りゾーンを特定するプロフェッショナルなインジケーターです。直感的なインターフェース、内蔵アラート、便利なON/OFFボタンにより、素早く情報に基づいた判断ができ、チャートもすっきり保てます。 主な機能: 指定期間の価格の高値安値から自動でBuy/Sellゾーンを検出 ( Fib_Period 、デフォルト240本のローソク足)。 カスタマイズ可能なフィボナッチレベル – 表示したいレベルのみ有効化可能(0%、23.6%、38.2%、50%、61.8%など)。 動的にゾーンを表示:
買いゾーン(Buy Zone)
売りゾーン(Sell Zone) ゾーンに入ると自動アラート発動:
ターミナルアラート
画面ポ

BreakAxis — 転換点における高精度シグナル
最新情報を見逃さないよう、チャンネルに参加してください: https://www.mql5.com/en/channels/forexnewadvisor
軸のクロスに基づくシグナルロジック
BreakAxis Signal は、ゼロ軸のクロスを基に価格の方向転換を検出するよう設計されています。
ヒストグラムの変化により市場のモメンタム転換が視覚的に強調され、方向矢印によって確認されます。
シグナルの確定と安定性
各シグナルは特定の数学的条件が満たされたときに生成され、リペイントを回避し、履歴データの一貫性が保たれます。
買いと売りのシグナルは、それぞれ最近の高値と安値に基づく平滑化された値の動的変化によって独立して示されます。
ビジュアルとアラート
方向転換はチャート上で視覚的に確認され、リアルタイムで監視できるようアラートの有効化も可能です。
このアルゴリズムは一般的なインジケーターに依存せず、プライスアクションの処理に特化したクリーンなロジック構成です。
柔軟なパラメーター設定
軸のクロスとヒストグラムに基

Heiken Ashi Pro – カスタマイズ可能なトレンド可視化ツール Heiken Ashi Pro は、MetaTrader 5 向けのインジケーターで、従来の Heiken Ashi 表示を拡張し、さまざまな移動平均や価格タイプを選択可能にした高度なツールです。 主な機能: SMA、EMA、KAMA、JMA、HMA、MAMA、TEMA、DEMA、McGinley、Gaussian、Super Smoother、Laguerre、FRAMA など、34 種類の移動平均に対応。 Close、Open、Median、Typical、Weighted Close、モメンタムベース、セッションベースなど、34 種類の価格タイプをサポート。 選択したパラメーターに基づいて、カスタム Heiken Ashi ローソク足を生成。 ノイズを抑えたスムーズな価格表示。 任意の通貨ペア・時間軸に対応。 活用例: トレンドの平滑化表示 マニュアル戦略の補完 相場構造の視覚的分析 柔軟なパラメーター調整により、取引スタイルに適応 プロフェッショナルなチャート表示が求められる方に最適です。

Volume Footprint Analysis is a precision-engineered, volume-based indicator that transforms raw market volume into an intuitive, color-coded signal system. Built on concepts from Volume Spread Analysis (VSA) and Smart Money principles, this tool removes the guesswork from volume interpretation and gives traders clear, actionable insights on when to buy or sell — on any timeframe and across any trading instrument. MT5 Version - https://www.mql5.com/en/market/product/138565/ Join To Learn Mark
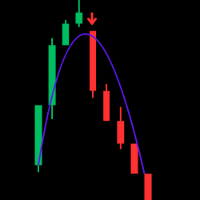
Trend WTS — Advanced Modular Trend & Signal Indicator for XAUUSD (M5 Optimized) Unlock precise trading insights with Trend WTS , a powerful and modular trend and signal indicator designed specifically for XAUUSD on the M5 timeframe. Built for traders seeking accuracy and clarity, Trend WTS combines fast moving average crossovers with a long-term EMA filter to deliver reliable buy and sell signals tailored for the gold market. Key Features: Dual Moving Average Trend Detection: Detect strong trend
FREE
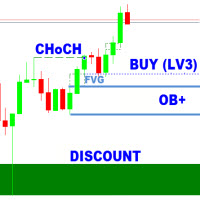
SMC Analyzer Single-Timeframe (STF) for MT4 The SMC Analyzer STF MT4 is a powerful, single-timeframe Smart Money Concepts (SMC) analysis tool designed for precision trade confirmations based on core SMC components. It evaluates market structure across four levels of confirmation using elements such as Break of Structure (BOS), Change of Character (CHoCH), Order Blocks (OB), Fair Value Gaps (FVGs), Liquidity Zones , and Higher Timeframe Trend Bias .
Each level has configurable elements (
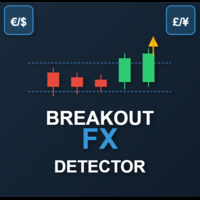
This is a powerful, session-aware breakout indicator designed for serious traders who thrive on volatility and structure. Engineered for precision, it identifies high-probability breakout zones during the London and New York trading sessions—where the market moves with intent. Key Features: Session Range Detection
Automatically detects and highlights the key price range of London and New York sessions. Breakout Confirmation
Identifies breakout candles after the session range, with cl
FREE

The Auto Fibonacci Indicator is a professional technical analysis tool that automatically draws Fibonacci retracement levels based on the most recent closed Daily (D1) or 4-Hour (H4) candle. These levels are widely used by traders to identify key support , resistance , and trend reversal zones .
This version is designed for manual trading and supports a powerful trading strategy using Fibonacci levels combined with a 50-period EMA (Exponential Moving Average) , which you can easily add from MT4
FREE

The StochasticDivergence is a custom indicator for the MetaTrader 4 (MT4) platform, designed to analyze the divergence between the Stochastic Oscillator (%K line) values of two currency pairs. It compares the Stochastic %K of the chart’s symbol (first symbol) with a user-defined second symbol, displaying both %K values and their absolute difference (divergence) in a separate subwindow. The indicator provides visual and alert-based feedback to highlight significant divergence levels, with custo
FREE

Ultra Band is a trend indicator designed for various type of traders ranging from Scalp to Long Term trader. Because it include the current bar price into the calculation, it looks like the repainting only after the bar closed then it's there forever. Strategy of choices for trading the Ultra Band: BUY at the Lower Band / SELL at the Upper Band then exit when price hit the opposite Band. SELL after retracement into Bearish cloud trend or touching the Upper Band, then target the most recent Low B

The RSIDivergence is a custom indicator for the MetaTrader 4 (MT4) platform, designed to analyze the divergence between the Relative Strength Index (RSI) values of two currency pairs. It compares the RSI of the chart’s symbol (first symbol) with a user-defined second symbol, displaying both RSI values and their absolute difference (divergence) in a separate subwindow. The indicator provides visual and alert-based feedback to highlight significant divergence levels, with customizable settings f
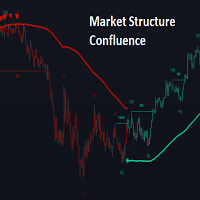
OVERVIEW
This script is called "Market Structure Confluence" and it combines classic market structure analysis with a dynamic volatility-based band system to detect shifts in trend and momentum more reliably. It tracks key swing points (higher highs, higher lows, lower highs, lower lows) to define the trend, then overlays a basis and ATR-smoothed volatility bands to catch rejection signals and highlight potential inflection points in the market.
CONCEPTS
Market structure is the foundation
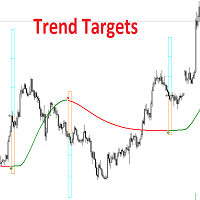
OVERVIEW
This script combines a smoothed trend-following model with dynamic price rejection logic and ATR-based target projection to give traders a complete visual framework for trading trend continuations. It overlays on price and automatically detects potential trend shifts, confirms rejections near dynamic support/resistance, and displays calculated stop-loss and take-profit levels to support structured risk-reward management. Unlike traditional indicators that only show trend direction or s

G0ldenZone — Precision Reversal Zones for Pro Trading Spot Key Levels Like a Pro! The G0ldenZone indicator automatically scans price action to detect high-probability reversal zones , using a unique combination of: Price Action Pivots (dynamic support/resistance zones). Fibonacci Confluences (critical retracement levels). Volume Profile (high-accumulation/distribution areas). Why Traders Love G0ldenZone? Real-Time Alerts (sound, email, push notifications) when a zone

優れたテクニカルインジケーター「Grabber」をご紹介します。これは、すぐに使える「オールインワン」トレーディング戦略として機能します。
ひとつのコードに、市場のテクニカル分析ツール、取引シグナル(矢印)、アラート機能、プッシュ通知が強力に統合されています。 このインジケーターを購入された方には、以下の特典を無料で提供します: Grabberユーティリティ:オープンポジションを自動で管理するツール ステップバイステップのビデオマニュアル:インジケーターのインストール、設定、取引方法を解説 カスタムセットファイル:インジケーターをすばやく自動設定し、最大限の成果を出すための設定ファイル 他の戦略はもう忘れてください!Grabberだけが、あなたを新たなトレードの高みへと導いてくれるのです。 Grabber戦略の主な特徴: 推奨タイムフレーム:M5〜H4 対応通貨ペア・資産:どれでも使用可能ですが、私が実際に検証した以下を推奨します(GBPUSD、GBPCAD、GBPCHF、AUDCAD、AUDUSD、AUDSGD、AUDCHF、NZDUSD、NZDCAD、EURCAD、EURUSD、E
適応性と正確さが出会う取引環境に浸ってください。Dynamic Grid Pro v1.7は、市場でのアプローチを洗練するために設計されたツールセットを提供します。 このシステムは、グリッド取引戦略の実行に柔軟なフレームワークを提供することを意図して開発されました。その主な機能は、絶えず変化する市場の状況に対応してグリッドのパラメータを動的に調整する能力にあります。 Dynamic Grid Pro v1.7の機能: ダイナミックグリッド: システムは、ボラティリティと価格の変動に基づいてグリッドレベルを自動的に調整し、注文の実行を最適化しようとします。 注文管理: グリッド内での注文の発注と管理を正確に制御でき、さまざまな設定オプションを提供します。 複数のエントリー戦略: さまざまな注文エントリー方法を統合し、戦略の実装に柔軟性を提供します。 カスタマイズ可能な設定: システムを好みや取引スタイルに適応させるための幅広い調整可能なパラメータを提供します。 情報パネル: グリッドとポジションに関する関連データを表示し、追跡と意思決定を容易にします。 MetaTraderとの統合:
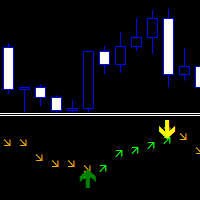
Direction Change Detector - 強気の動きと弱気の動きのバランスを分離するトレンドインジケーター。方向を確認する信号が付いた 2 列の矢印があります。
トレンドを見つけるためのスタンドアロンインジケーターとして、または取引を開始してシグナルの方向に従うための追加ツールとして機能します。
あらゆる市場と時間枠に適応します。 歴史に彼の証言を塗り替えることはない。 通知にはいくつかの種類があります。 上向きの緑の矢印は、価格が強気の方向であることを示します。 下向きのオレンジ色の矢印は、価格が弱気な方向であることを示しています。 読み取り値を変更するためのカスタマイズ可能なパラメータが 1 つあります。方向の数が増えると、価格はよりスムーズになり(低いタイム フレームに使用)、方向の数が減ると、価格はより早くなります(高いタイム フレームに使用)。
Length Directions - 方向の変化を計算するためのローソク足の数。
FREE
KT Liquidity Sweep Filter は、重要な流動性スイープゾーンを特定し、視覚的に強調表示するインジケーターです。これらのゾーンを明確なプライスアクションによる反発と適応型のトレンドフィルターと組み合わせることで、市場のトレンドに沿った正確な売買シグナルを生成します。 このインジケーターは、大きな流動性スイープゾーンと小さなゾーンを区別し、大きなゾーンには太い矢印、小さなゾーンには細い矢印で表示して、視認性を高めています。 大きな矢印: 主要な流動性スイープゾーンから発生する強い反転シグナルを示します。 小さな矢印: 二次的な流動性スイープゾーンからの弱めの反転シグナルを示します。
機能 トレンドに沿ったシグナル: ゴールドなどのトレンド性の強い銘柄において、トレンドに乗るための複数のエントリーポイントを提供します。 取引チャンスの増加: 強い反転と弱い反転の両方を明確に示すことで、より多くのエントリー機会を提供します。 カスタマイズ可能なトレンドフィルター: 取引対象の銘柄や時間足に合わせてシグナルを調整できます。 しきい値の調整: 主要スイープシグナルの感度を調

VWAP クロスオーバーシグナルインジケーター for MetaTrader 4
VWAP クロスオーバーシグナルインジケーターで精密なトレードを解き放つ!
VWAP クロスオーバーシグナルインジケーターでトレード戦略を向上させましょう。このMetaTrader 4向けに設計された強力で直感的なツールは、精度と明確さを求めるトレーダー向けに作られています。このカスタムインジケーターは、出来高加重平均価格(VWAP)を活用し、チャート上に直接アクション可能な買いと売りのシグナルを提供します。デイトレーダー、スキャルパー、スイングトレーダーにとって理想的で、高確率のエントリーとエグジットポイントを簡単に特定できます。 主な機能: 動的VWAP計算:カスタマイズ可能な期間(デフォルト:14)に基づいてVWAPを計算し、出来高で加重された平均価格を正確に反映します。 明確な視覚的シグナル:価格がVWAPを上抜けすると緑色のアップアローが「買い」ラベルと共に表示され、下抜けすると赤色のダウンアローが「売り」ラベルと共に表示され、トレード判断が簡単になります。 高いカスタマイズ性:VWAP期
FREE

Gold Flux Signal – XAUUSD専用ノンリペイント型シグナルインジケーター
明確なシグナル実行のために設計
– Gold Flux Signalは、 XAUUSD において安定した明確なエントリーシグナルを提供するために開発されました
– トレンドフォローおよびブレイクアウト戦略に最適化されており、チャートのノイズを排除します
– インジケーターは 確定済みのローソク足 に基づいてシグナルを生成します
– 推奨タイムフレーム: M1、M5、H1
安定したビジュアルシグナル
– 一度出現したシグナルは消えたり変更されたりすることはありません
– シグナルはチャート上に矢印として表示されます:
• マゼンタの矢印 = 買いシグナル
• シアンの矢印 = 売りシグナル
– すべての矢印は リペイントなし で、確定された価格動向に基づいています
適応型価格アクションに基づくロジック
– シグナルは以下に基づいて生成されます:
• リアルタイムのボラティリティ計測
• 修正されたWPRロジックを使用したモメンタムの変化確認
– ト

Sniper Flip Zones – 高精度な買い/売りシグナルシステム Sniper Flip Zones は、トレンドまたはレンジ相場においてモメンタムが急激に転換する瞬間を捉えることで、極めて正確なBUY/SELLシグナルを生成するために設計されました。特に XAUUSD の M1/M5 に最適化されていますが、設定可能なパラメータにより、あらゆる通貨ペア・時間足で使用できます。
最新情報を受け取るにはチャンネルに参加してください: https://www.mql5.com/en/channels/forexnewadvisor
コアロジックは以下の要素を組み合わせています:
– ストキャスティクスが極端なレベル(10/90)で反転するタイミング – 任意で %K と %D のクロスを使用 – 短期・長期の移動平均を用いた動的なトレンド検出 – 同一方向への連続シグナルを避けるための交互ロジック
シグナルが生成される仕組み:
– 買われすぎ/売られすぎゾーンのブレイクアウト: ストキャスティクスが極端なゾーンを抜けた際に短期的な反転を捉えます。 – クロスフィルター:

ICTニューヨークオープン・キルゾーン・インジケーターは 、 スマートマネー・コンセプト(SMC) 、 ICT取引モデル 、そして FX市場 における 流動性戦略を採用する トレーダー向けに設計されています。このツールは、機関投資家の取引量が大きな動きにつながる重要な時間帯である、 11:00~14:00 GMT の ニューヨークオープン・キルゾーン を表示します。このインジケーターは、 セッションレンジ 、 マーケットメーカーレンジ 、 流動性スイープ 、 FVGゾーン(フェアバリューギャップ) 、そして ブレイクアウトの機会を ハイライト表示し、 価格変動の激しい時間帯における価格動向 を包括的に把握できます。 このインジケーターは 、ニューヨークセッションのレンジ を タイムボックス でプロットし、セッションの 高値と安値 を描画することで、流動 性ハンティング 、 レンジスイープ 、 マーケットメーカートラップ の可能性を特定するのに役立ちます。FVG 検出機能は 、積極的な動きによって生じたギャップを表示し、潜在的な リトレースメントゾーン と 継続エリア
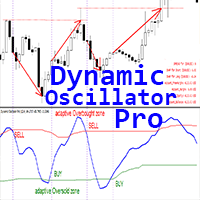
Dynamic Oscillator Pro は、MT4向けの高度なカスタムCrypto_Forexインジケーターです。効率的な取引ツールです!
- 新世代のオシレーター - 使い方は画像をご覧ください。 - Dynamic Oscillatorは、適応型の売られ過ぎ/買われ過ぎゾーンを備えています。 - オシレーターは、売られ過ぎ/買われ過ぎエリアから正確なエントリーポイントを見つけるための補助ツールです。 - 売られ過ぎ値:グリーンラインより下、買われ過ぎ値:レッドラインより上。 - 標準的なオシレーターよりもはるかに正確です。対応時間足:M30、H1、H4、D1、W1。 - インジケーターにはモバイルとPC向けのアラートが組み込まれています。 - スプレッド/スワップ情報表示機能 - インジケーターが接続されている通貨ペアの現在のスプレッドとスワップを表示します。 - 画面には、口座残高、エクイティ、マージンも表示されます。 - Info Spread Swap Displayはチャートの任意の場所に配置できます。 0 - 左上隅、1 - 右上隅、2 - 左下隅、3 - 右下
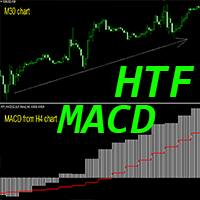
Crypto_Forex インジケーター HTF MACD オシレーター(MT4 対応)
- HTF とは、高時間枠を意味します。 - MACD インジケーター自体は、トレンドトレードで最も人気のあるインジケーターの一つです。 - このインジケーターは、プライスアクションエントリーや他のインジケーターと組み合わせたマルチタイムフレームトレードシステムに最適です。 - HTF MACD インジケーターを使用すると、高時間枠の MACD を現在のチャートに表示できます --> これはプロフェッショナルなトレード手法です。 - インジケーターには、モバイルと PC の両方でアラートが組み込まれています。
高品質のトレーディングロボットとインジケーターをご覧になるにはここをクリックしてください! これは、この MQL5 ウェブサイトでのみ提供されるオリジナル製品です。

デルタトリガーインジケーター
明確なシグナル。迅速なアラート。リペイントなし。
Delta Triggerは、ADXのDI+およびDI–ラインを使用してトレンドの変化に即座に反応する高精度の矢印インジケーターです。 リペイントなし、遅延なし、シグナルの消失なしで、明確な買い/売りシグナルを提供します。
おすすめの通貨ペア:XAUUSD
Delta Triggerはすべての通貨ペアと時間足(M1からH4以上)に対応していますが、特にモメンタム変化が急激なXAUUSDで非常に優れたパフォーマンスを発揮します。 あなたのトレーディングスタイルに瞬時に適応します。
主な機能
時間足の柔軟な対応
M1での高速スキャルピングから、H4での戦略的エントリーまで、すべてのチャートで使用可能です。
正確な買い/売りシグナル
ADXのロジックに基づき、DI+がDI–を上回ると緑の矢印(買い)、DI–がDI+を上回ると赤の矢印(売り)を表示します。
視認性の高い矢印
緑=買い、赤=売り。矢印は大きく、明確で、一度表示されると消えることはありません。
リアルタイムアラートシステム
Ghost Entry Signal は再描画しないトレンドフォロー指標で、高精度な取引エントリーを目的として設計されています。動的なモメンタム検出、価格アクションフィルター、および独自の交代ロジックを組み合わせて、誤検出を避け、クリーンなBUY/SELLシグナルを提供します。 EURUSD, USDJPY, GBPUSD で、 M1, M5, M15, M30 の時間枠において最も効果的に機能します。
最新情報を受け取るには: https://www.mql5.com/en/channels/forexnewadvisor
シグナルエンジンには以下が含まれます: 適応型トレンド追跡: デュアルEMA構造(Fast 13、Slow 21)を使用して、リアルタイムでトレンドの勢いを特定します。 モメンタムフィルター: 平滑化されたRSIが、50レベルの基準線をもとに方向性の強さを確認します。 価格アクション検証: シグナルはローソク足構造でフィルタリングされます。拒絶のヒゲ、ブレイクアウトボディ、セッションの反転中にトリガーされたシグナルが優先されます。 交代ロジック: ノイズと過剰
MetaTraderプラットフォームのためのアプリのストアであるMetaTraderアプリストアで自動売買ロボットを購入する方法をご覧ください。
MQL5.community支払いシステムでは、PayPalや銀行カードおよび人気の支払いシステムを通してトランザクションをすることができます。ご満足いただけるように購入前に自動売買ロボットをテストすることを強くお勧めします。
取引の機会を逃しています。
- 無料取引アプリ
- 8千を超えるシグナルをコピー
- 金融ニュースで金融マーケットを探索
新規登録
ログイン