Delta Fusion Pro
- インディケータ
- バージョン: 8.0
- アップデート済み: 6 12月 2025
- アクティベーション: 5

Delta Fusion Pro – 日中取引のための高度なオーダーフロー分析
Delta Fusion Pro は MetaTrader 4 用のプロフェッショナル指標で、アグレッシブな注文フローを明らかにし、機関投資家の圧力の強度と方向をリアルタイムで表示します。従来のボリューム指標とは異なり、Ask と Bid のボリューム差(デルタ)を分析し、反転の予測、トレンドの確認、プロフェッショナルな関心ゾーンの特定を可能にします。
主な特徴
インテリジェント自動調整システム
以下に基づき、すべてのパラメータを自動調整:
- 銘柄タイプ(FX、暗号資産、指数、コモディティ、株式)
- 運用タイムフレーム
- 市場のボラティリティ(ATR)
- 最近の平均ボリューム
初心者トレーダー向けに手動設定不要 — インジケーターが自動でキャリブレーション!
機能概要
- NetDelta と累積デルタ
- Ask/Bid のアグレッシブボリューム差を計算、カスタマイズ可能な EMA スムージング
- リアルタイムで方向性圧力を表示
- ヒストグラムの色をカスタマイズ(買い/売り)
- 価格/ボリュームのダイバージェンス
- 通常および隠れたダイバージェンスを自動検出
- 強度分類:強/中/弱
- 高度なフィルター:ボリューム確認、トレンド、時間距離
- カラフルな矢印でグラフィック信号表示
- マーケット・インバランス
- Ask/Bid の顕著な不均衡を検出(比率設定可能)
- 検証のための最小ボリューム閾値
- チャート上にカラードット表示(ブル/ベア)
- Infusion Volume
- 平均に対して異常なボリュームスパイクを検出
- 乗数係数と期間をカスタマイズ可能
- 機関投資家の介入やボリュームクライマックスを強調
- Splash Signal
- ボリュームピークのグラフィカル表示
- ローソク足の上下に Wingdings シンボル
- シグナルはローソク足のクローズ時に生成(リペイントなし)
- オフセットとサイズをカスタマイズ可能
- POC Delta(コントロールポイント)
- デルタ集中度が最も高い価格を計算
- 自動計算方法:Freedman-Diaconis または ATR
- 水平ライン + オプションバンド
- セッション中に動的更新
- Delta Profile
- アグレッシブデルタに基づくボリュームプロファイル
- モード:Net Delta または Absolute
- 左右アンカー設定可能
- 最も重要な N レベルを強調表示
- 強度に比例したカラーレクト表示
- VWAP Delta
- アグレッシブボリュームに基づく加重平均価格
- 3 つの計算モード:
- NET_DELTA_WEIGHTED:純デルタのみ
- NET_ALL_VWAP:Ask + Bid と方向
- NET_AVG_BUY_SELL:買い/売り VWAP 平均
- 買い、売り、ネットのラインを分離表示
インタラクティブパネル
- コントロールパネル(UCP)
すべての機能をリアルタイムで ON/OFF 管理:
- Delta Profile
- POC Delta
- VWAP Net
- ダイバージェンス
- インバランス
- Infusion
- Splash
ドラッグ可能 — チャート上で自由に配置、カラーインジケーター付き(青 = ON / 灰 = OFF)。
買い/売りパーセンテージパネル
- アグレッシブな買い/売りボリュームの割合を表示
- 動的カラー(買い > 売りなら緑)
- カスタマイズ可能なテキストテンプレート
- マルチタイムフレーム強度パネル
- 現在の TF + M15 + H1 + H4 の集約分析
- 強度分類付きのプログレッシブバー(強/中/弱)
- 各タイムフレームの詳細値をツールチップで表示
- パフォーマンス最適化のキャッシュシステム
設定可能なパラメータ
- セッションリセット:カスタム開始時間
- スムーズ期間:累積デルタの EMA フィルター(デフォルト:10)
- ダイバージェンス:7 つの高度パラメータ(スイング、閾値、トレンド/ボリュームフィルター)
- インバランス:比率と最小ボリューム
- Infusion/Splash:期間と乗数係数
- POC:計算方法、バンド、スナップトゥティック
- Delta Profile:ビン、Top N、幅、カラー
- VWAP:計算モード、ラインカラー、スタイル
- パネル:位置、フォントサイズ、カラー、テンプレート
運用上のメリット
- POC と Delta Profile による機関ゾーンの特定
- マルチ確認ダイバージェンスで反転を予測
- インバランスと Infusion でブレイクアウトを確認
- 買い/売りパネルと MTF によるリアルタイムセンチメント
- インタラクティブパネルでコンテキスト適応
- 確認済みシグナルに遅延なし(Splash はリペイントなし)
- カラー、閾値、表示の完全カスタマイズ
対象ユーザー
- FX、指数、暗号資産、コモディティの日中トレーダー
- 高度なボリューム分析を必要とするスキャルパーやデイトレーダー
- マルチシグナル確認を求める裁量トレーダー
- 初心者:Auto-Tuning 有効で自動キャリブレーション
- 上級者:高度パラメータの完全制御
技術要件
- プラットフォーム:MetaTrader 4
- タイムフレーム:すべて(M1–H4 に最適化)
- 対象:FX、指数、暗号資産、コモディティ、株式
- リソース:軽量で最適化(スマートキャッシュ、オンデマンド計算)
完全なドキュメント
詳細な技術マニュアル、ベストプラクティス、各機能のステップガイドは購入後、MQL5 のプライベートメッセージで販売者に直接連絡してください。
免責事項
Delta Fusion Pro はトレード活動をサポートする分析ツールです。運用推奨やパフォーマンス保証を構成するものではありません。取引決定はユーザーの自己責任です。技術的知識と適切なリスク管理が必要です。
プロフェッショナルなオーダーフロー分析で、あなたの日中取引を変革!
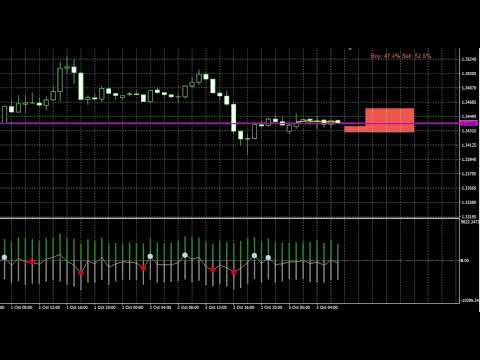


buonasera, ho appena acquistato il tuo indicatore e vorrei avere maggiori informazioni sui parametri da usare per avere leggibile i volume profile che vedo in foto e la linea vwap, grazie