YouTubeにあるマーケットチュートリアルビデオをご覧ください
ロボットや指標を購入する
仮想ホスティングで
EAを実行
EAを実行
ロボットや指標を購入前にテストする
マーケットで収入を得る
販売のためにプロダクトをプレゼンテーションする方法
MetaTrader 4のための新しいテクニカル指標 - 18

Auto Optimized Bollinger Bands – 実際の市場に対応する適応型ボラティリティツール Auto Optimized Bollinger Bandsは、従来のボリンジャーバンドを強化したMT4用の高度なインジケーターで、過去のトレードシミュレーションに基づいて最適な期間と偏差の値を自動で選択します。 固定された設定に依存するのではなく、市場の実際の動きに基づいてリアルタイムで最適化を行い、ボラティリティや価格構造の変化に動的に対応できるバンドを生成します。手動での調整は不要です。 主な機能: 過去のパフォーマンスに基づいたボリンジャーバンドパラメーターの自動最適化 重要な反転ポイントでの矢印による売買シグナルを表示 アラート内蔵:サウンド、ポップアップウィンドウ、プッシュ通知 最適化の深さ、表示方法、シグナルなどのカスタマイズが可能 FX、ゴールド、株価指数、暗号通貨など様々な市場で使用可能 本ツールはデイトレードやスイングトレードに最適で、固定パラメーターの従来型インジケーターよりも、よりスマートなボラティリティ取引アプローチを提供します。
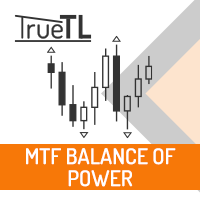
マルチタイムフレーム対応、カスタマイズ可能なビジュアルシグナル、設定可能なアラートシステムを備えたBalance of Power(BOP)インジケーター。
BOPとは? Balance of Power(BOP)は、価格の変化をバーの範囲と比較することで、買い手と売り手の強さを測定するオシレーターです。このインジケーターは(Close - Open)/(High - Low)として計算され、次に単純移動平均(SMA)で平滑化されます。 BOPの値は-1から+1の間で変動します。正の値は買い手が強いこと(終値が始値より高い)を示し、負の値は売り手が強いこと(終値が始値より低い)を示します。値の大きさは動きの強さを示します。BOPは、買いと売りの圧力のバランスを示すことで、市場の強さと潜在的な反転を識別するのに役立ちます。 機能: 矢印と垂直線を使用したビジュアルシグナルマーカー 設定可能なトリガーを持つ3つの独立したシグナルバッファー シグナル検出オプション:方向転換、レベルクロス、ピーク/バレー 各シグナルに設定可能なアラート機能(メール、プッシュ、サウンド、ポップアップ) 補間
FREE

クイックラインツール:トレンドラインと長方形をプロットするための便利な指標
クイックラインツールは、テクニカル分析のための迅速かつ効果的なツールを必要とするトレーダーのために設計されたMetaTrader4のための強力で直感的な指標 この指標を使用すると、トレンドライン、サポート/抵抗レベル(AP/DW)、および長方形を簡単に作成して、チャートレイアウトプロセスを最適化できます。 この指標は、分析の精度と速度を向上させようとしている初心者とプロのトレーダーの両方にとって理想的です。
主な利点
直感的なインターフェイス:"ショー"機能をサポートするユーザーフレンドリーなボタンパネルを介してすべての機能を制御します。|気を散らすものを最小限に抑えるために「非表示にします。
設定の柔軟性:カスタマイズ可能な色、ラインスタイルと太さだけでなく、あなたの取引スタイルに適応するためのボタンのサイズと位置。
マルチタイムフレームのサポート:トレンドラインと長方形は現在の時間枠と下の時間枠に表示され、AP/DWラインとキーボタンはすべての時間枠に表示さ
安定した配置:
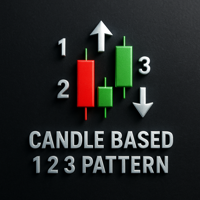
ローソク足ベースの 1 2 3 パターン ローソク足ベースの 1 2 3 パターン は、クラシックな 1-2-3 の価格構造に基づいて高確率の反転パターンを識別するインジケーターです。ローソク足とスイングポイントを活用し、 ブレイクアウトが確定した後にのみ シグナルを表示するため、ノイズを減らし早すぎるエントリーを回避できます。 主な特徴: 確定済みの強気・弱気 1-2-3 パターンをローソク足ベースで検出 パターンのポイント間にトレンドラインを描画し、ブレイクアウト時に矢印を表示 アラート(ターミナル、メール、プッシュ通知、サウンド)対応 見た目やシグナルバー、パターン期間など柔軟にカスタマイズ可能 すべての時間足と金融商品で、反転・押し目買い・ブレイクアウト戦略に最適です。

指標はその作成において普通です。 これは、高値と安値を計算し、平均価格とそれらを相関させます。 それの唯一の美しさは、それが過去の日のパラメータと現在のパラメータを相関させることであり、それが私がそれを「その日」と呼んだ理由です。"これは、H1時間チャートの期間のために開発されました。 そして、それは彼が正しく行動する場所です。 設定では、パラメータを設定するのは簡単です。長さは平均価格を決定します。 パラメータ:primは、指標が平均価格を計算するために使用する価格を示します。 たとえば、2つの指標をチャートに配置し、1つの指標の低価格をプリムパラメータで指定し、もう1つの指標の高価格を指定すると、これら2つの指標がコリドーを作成します。 また、2つの指標を使用してストップロスを設定することもできます。 最初のパラメータがprim=Low、2番目のパラメータが=Medianであり、買い注文または売り注文の配置に応じて、ストップロスを中央線を超えて移動できるとします。 パラメータ:countは、最大値と最小値の計算を行います。 つまり、カウントするバーの数です。

PipStartexはスキャルピング用のインジケーターです。買われすぎ/売られすぎの価格帯をチャネルの形でチャート上に描画します。また、価格がチャネルを超えると、チャート上に黄色のドットが描画されます。価格がこのチャネルを超えると、必ず元のチャネルに戻ろうとします。このパターンを理解すれば、すべてのトレーダーが取引に活用できます。売られすぎゾーンの価格がチャネルの赤いゾーンを下回ると、買い注文がオープンします。買われすぎゾーンの価格がチャネルの青いゾーンを上回ると、売り注文がオープンします。97%のケースでは、価格は常にすぐにコンフォートゾーンに戻ろうとします。コンフォートゾーンとは、価格がチャネル内にあるときです。価格がチャネルを超えると、そこに不快感を覚えます。この現象を確認するには、インジケーターのデモ版をダウンロードし、ビジュアルモードのストラテジーテスターでテストしてください。 このインジケーターを使用する理由: このインジケーターは、97%のケースで機能するパターンをチャート上に示します。 インジケーターは値を再描画しません。 日足のM5、M15、M30、H1で効果的に機
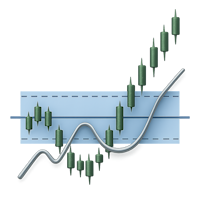
PriceDensity – Professional Price Density Indicator for Accurate Market Level Detection PriceDensity is a smart, non-volume-based indicator that analyzes historical price action to determine key price levels with the highest frequency of occurrence . It automatically detects where the market has spent the most time – revealing hidden areas of support and resistance based on actual market behavior, not subjective drawing. This tool is ideal for traders using price action, support/resistance conce
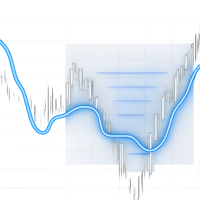
ShiftedPriceDensity — Professional Price Density Indicator with Shifted Historical Levels ShiftedPriceDensity is an advanced technical custom indicator for the MetaTrader 5 platform that visualizes the most significant horizontal price levels based on historical shifts . This tool is ideal for traders who practice cluster analysis , build support and resistance levels , and look for key price zones in volatile market conditions. The indicator is built upon the concept of

ShiftedPriceDensitySet – Advanced Price Density Level Analysis with Time Shifts ShiftedPriceDensitySet is a powerful professional indicator for MetaTrader 5 , designed to visualize key price density levels across multiple time-shifted segments of historical data. It builds multiple instances of the embedded PriceDensity indicator with configurable depth and shift settings to reveal consistent price clusters that often act as support/resistance zones or areas of strong market interest. This is an
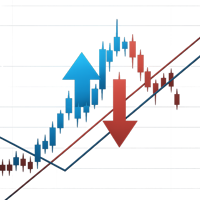
Pointer Trend Switch — precision trend reversal indicator Pointer Trend Switch is a high-precision arrow indicator designed to detect key moments of trend reversal based on asymmetric price behavior within a selected range of bars. It identifies localized price impulses by analyzing how far price deviates from the opening level, helping traders find accurate entry points before a trend visibly shifts. This indicator is ideal for scalping, intraday strategies, and swing trading, and performs equa

Trend TD Ultimate — The All-in-One Trend Indicator for MetaTrader Trend TD Ultimate is a modern, all-in-one trend indicator for MetaTrader 5. It combines advanced trend-following logic, smart price pattern analysis, and integrated trade evaluation features — all in one powerful tool. It is built for traders who need accuracy, flexibility, and visual clarity — on forex, stocks, indices, commodities, and crypto . Key Features & Benefits 1. Multi-Purpose Trend Signal Engine Generates Bu

Directional Trend Line — Directional Trend Indicator for MetaTrader
**Directional Trend Line** is a professional tool for traders that allows you to:
* Accurately determine the current market trend * Timely detect phase shifts in market structure * Clearly visualize the dominant price movement direction
### ** Key Features **
#### 1. ** Automatic Adaptation to Any Timeframe **
* Automatically adjusts the CCI period for M1…MN * Enables optimal sensitivity across different timeframes *
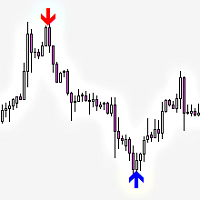
Railway Tracks Pattern — Reversal Pattern Indicator Railway Tracks Pattern is an indicator that automatically detects a powerful two-candle reversal pattern on the chart. It looks for two candles with opposite directions (bullish and bearish), similar in size, and with minimal wicks — a clear sign of momentum shift. How it works: The first candle is strong and directional. The second candle moves in the opposite direction and is of similar size. Both candles have small shadows (wicks). The
FREE
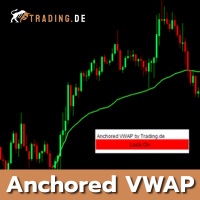
With the Anchored VWAP for MT4 from Trading.de, you can easily calculate and display the volume-based average price starting from a specific point in the chart (anchor). The indicator is ideal for our Trading.de 1-minute chart strategy, but can also be used in all other timeframes. The AVWAP for MetaTrader 4 is calculated using volume or an average period. In the settings, you can specify whether or not to use real trading volume. The indicator also has a "Lock" button in the upper right corner

Highly configurable Fisher Transform indicator.
Features: Highly customizable alert functions (at levels, crosses, direction changes via email, push, sound, popup) Multi timeframe ability Color customization (at levels, crosses, direction changes) Linear interpolation and histogram mode options Works on strategy tester in multi timeframe mode (at weekend without ticks also) Adjustable Levels Parameters:
Fisher Transform Timeframe: You can set the lower/higher timeframes for Stochastic. Fisher
FREE

Moving MinMax is a custom trend indicator that helps you easily identify the current market direction , reversals , and high-probability trade setups . This tool uses a unique calculation method that measures price pressure from both buyers and sellers, helping you see who is in control and when the market is likely to change direction. Unlike basic oscillators or moving averages, this indicator computes trend likelihoods using a distribution-based exponential model applied over a moving price w

Purpose : The AllAverages indicator plots a moving average line on the chart, with options to select from a wide range of MA types and price applications. It also displays buy and sell signals as arrows when the trend changes, and supports alerts (sound, email, push notifications) for these signals. Key Features : Supports multiple moving average types (e.g., SMA, EMA, HMA, TEMA, etc.). Allows customization of the price type (e.g., Close, Open, High, Low, Heiken Ashi variants). Displays a colore

About:
QQE Dual Pulse is best for people who are using QQE with their existing trading strategies to validate trends. It is an oscillator that combines two QQE calculations with Bollinger Band filtering to identify high-probability trading signals. This indicator helps traders spot momentum shifts and trend changes with reduced false signals.
Detailed description with screenshots is in blog post: https://www.mql5.com/en/blogs/post/763582
What is QQE and QQE Mod?
QQE original: is an enhanced

This indicator is deliberately constructed to avoid repainting. Once a candle has closed, the output it produces remains fixed and unchanged. This behavior ensures accuracy during backtesting and provides reliability in real-time strategy execution.
Unlike traditional methods such as linear or polynomial regression, kernel-based methods don't assume any specific form or distribution for the data. Instead, they rely on a kernel function —a mathematical tool that assigns influence to each nearby

High Timeframe Exponential Moving Average (HTF EMA) Spot the Trend with Clarity – No Matter Your Timeframe!
The HTF EMA Indicator brings the power of higher timeframe analysis right onto your current chart. Whether you're trading M5,M15, H1, or any intraday timeframe, this tool overlays the Exponential Moving Average (EMA) from your chosen higher timeframe—such as H1, H4, or D1—so you can make smarter, more confident decisions.
Key Features: Displays EMA from Higher Timeframes directly o

Common Channel Index (CCI) Multi-Period Overlay Overview:
The Common Channel Index Multi-Period Overlay is a powerful -based tool that brings clarity and multi-timeframe insight into your trading decisions. By combining three different Commodity Channel Index (CCI) periods — 5 , 15 , and 60 — into a single, unified display, this indicator offers a layered view of market momentum and overbought/oversold conditions. Key Features: Triple CCI Overlay:
See short-term (5), mid-term (15), a

Keltner Channel MultiBand – Period 20 | ATR 10 | Bands 1.5, 2.0, 2.5 Unlock Precise Market Timing with Triple-Band Trend Mapping The Keltner Channel MultiBand is a powerful technical tool designed to help traders identify trend opportunities , optimize entry points , and strategically place Take Profit (TP) and Stop Loss (SL) levels. Key Features: Triple Bands (1.5x, 2.0x, 2.5x ATR) : Offers a multi-layered view of price volatility, helping you gauge the strength of market momentum with gr
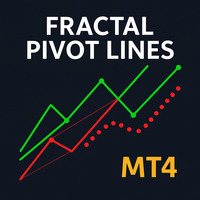
Fractal Pivot Lines — Indicator Overview Fractal Pivot Lines is a custom trend-structure indicator for MetaTrader 4 .
It automatically connects key fractal highs and lows with dynamic lines so you can see how price is respecting local structure, building channels, and preparing for potential reversals. Instead of staring at dozens of candles and guessing where the real pivots are, the indicator turns fractals into clear support/resistance paths and trend channels . What the Indicator Does C

The Trend and Revesal Indicator is a custom indicator designed to help traders identify trend direction, reversal points, and high-probability trade setups. It uses advanced mathematical calculations to analyze market behavior and highlight potential turning points with great accuracy. This indicator measures buying and selling pressure over a defined period and shows which side is in control. It provides a clear visual display of trend zones, reversal arrows, and momentum signals in a separate

CustomMultiBarFractal Indicator Description
Overview The CustomMultiBarFractal indicator identifies and displays fractal patterns on price charts. Fractals represent significant price reversal points that can serve as signals for trading strategies.
Key Features - Detects fractals based on a user-defined analysis period - Displays upper and lower fractals with customizable colors - Allows offset adjustment from price extremes - Provides flexible visualization settings - Support
FREE

Elevate your chart analysis with precision visual signals. The CandleBodyArrows indicator is designed for traders who value clear, actionable chart insights. It automatically identifies significant candle movements based on user-defined thresholds and highlights them with intuitive up and down arrows. Whether you're trading trends or volatility, this tool offers an additional layer of visual confirmation that integrates seamlessly with your existing technical approach. Key Features: Highlights c

Triple Momentum Pro - The Ultimate 3-in-1 Trend Indicator for MT4 Unlock the power of Triple Momentum Pro , the all-in-one indicator that combines three powerful, customized trend-following systems into a single, easy-to-read visual tool. Stop cluttering your charts with multiple indicators and get clear, confident signals for any market and any timeframe. Key Features: Three Powerful Indicators in One: Combines a unique FollowLine trend-tracker, a classic SuperTrend , and the dynamic PMax (Prof

VertexVision Pro – Precision-Powered Trading Signals VertexVision Pro is a professional-grade trading indicator designed for MetaTrader 4 that combines intelligent price action analysis, smart trend filtering, and optional multi-timeframe (MTF) confirmation to generate high-confidence BUY and SELL signals . Whether you're a beginner or a seasoned trader, VertexVision Pro gives you the visual edge and analytical power to make confident decisions in volatile markets. Key Features: Accur
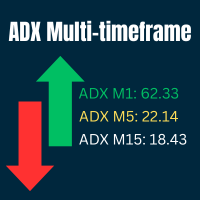
Ultimate ADX Multi-timeframe Indicator This indicator provides real-time ADX values for multiple timeframes in one unobtrusive label panel. It i s especially useful for gauging trend strength across timeframes without constantly switching charts. Choose which periods to display, anchor the panel to any chart corner, and color-code ADX strength levels to your taste. Key Features & Personalization Multi-Timeframe ADX - Toggle visibility for 9 built-in periods (M1, M5, M15, M30, H1, H4, D1, W1, MN1
FREE

Smart Money Concepts (SMC) Indicator The SMC Indicator is an advanced market structure tool designed for traders who want to trade like institutions. It automatically detects and plots key Smart Money concepts on your chart, giving you a clear view of market intent and high-probability trade setups. Core Features Market Structure Detection – Automatically identifies Break of Structure (BOS) and Change of Character (CHoCH) to spot trend shifts and reversals. Multi-Timeframe Support – Analyz
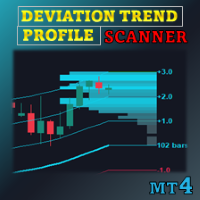
特別オファー : ALL TOOLS 、各 $35 のみ! 新しいツール は $30 ( 最初の1週間 または 最初の3件の購入 まで)です! MQL5のTrading Toolsチャンネル :最新情報を受け取るにはチャンネルに参加してください Deviation Trend Profile Scanner (DTPS) は、トレンド方向を検出し、ボラティリティを測定し、複数のシンボル/時間足の情報を1つのテーブルに整理するインジケーターです。設定可能な移動平均、適応型標準偏差ゾーン、分布ヒストグラムを使用して、価格行動を統計的に簡潔に表示します。 MT5版を見る: Deviation Trend Profile MT5 Scanner 他の製品はこちら: All P roducts 1. 概要 このインジケーターは次の3要素で構成されます: 移動平均 (MA) 標準偏差ゾーン (±1, ±2, ±3 × ATR) トレンド分布プロファイル (ヒストグラム) 2. コア概念 MAの傾き (|Slope| > 0.1): トレンド転換を検出 — 正 =

Market Structure ICT インジケーター 1. 自動化された市場構造 (Market Structure) 最大の利点は、主観的な判断によるミスを減らせることです。 正確なトレンド識別: トレンド継続のための BOS (Break of Structure) と、トレンド反転のための CHoCH (Change of Character) を自動的に識別します。 スイングの分類: ユーザーは市場構造のタイプ(短期、中期、長期)を選択でき、スキャルパーにもスイングトレーダーにも適しています。 2. プロフェッショナル・ダッシュボード 他のタイムフレームを確認するために画面を切り替える必要はありません。 一目でわかる分析: ダッシュボードは、1つの画面にすべてのタイムフレーム(M1からW1)のステータスを表示します。 スコアリングシステム: 小さなタイムフレームからのスコアを集計し、 全体的なバイアス (Overall Bias) (例:「強い強気」や「混在」)を要約します。これにより、自信を持ってエントリーできます。 トレンドの鮮度: BOSが「フレッシュブレイク(発生し
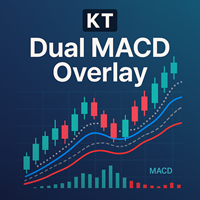
KT Dual MACD Overlay は、現在足と上位足の 2 本の完全な MACD オシレーターを価格チャート上に重ねて表示します。高速 MACD は短期モメンタムを捉え、低速 MACD は大局的なトレンドとの整合性を保ちます。 2 本をローソク足に重ねることで、ウインドウを切り替えることなく市場モメンタムを一望できます。
買いエントリー
メイン買い: 上昇トレンド開始時に青い縦線を表示。 追撃買い: 高速 MACD がシグナルラインを上抜け、低速 MACD と上昇トレンドが一致したときに発生。 売りエントリー メイン売り: 下降トレンド開始時にオレンジの縦線を表示。 追撃売り: 高速 MACD がシグナルラインを下抜け、低速 MACD と下降トレンドが一致したときに発生。
特徴 高速+低速の 2本 MACD で構成され、単体 MACD より文脈が明確。 新トレンド開始を示す縦線をチャートに描画。 メインサインを逃しても、複数回の再エントリー機会を提供。 標準 MACD クロスと比べて精度と視認性が大幅に向上。 3 つの主要イベントでアラート送信:トレンド変化・高速 MACD

トレンドの波に乗る「追随」のための明確なサイン 相場において、もっとも安定した利益を得やすいのは「明確なトレンドが発生している場面」と言われています。しかし、その波に確実に乗ることは、経験者にとっても簡単ではありません。 Ride the Trend Signal は、トレンド相場の「押し目買い」「戻り売り」に焦点を当てたサイン型インジケーターです。あえてトレンドの初動には乗らず、一定の方向性が確認されたあとに第2波・第3波を捉えることで、より信頼性の高いエントリータイミングを示します。 移動平均線・ストキャスティクス・平均足の3つのテクニカル要素を活用し、シンプルかつ実用的なロジックで設計されています。裁量判断の補助として、トレンドフォロー戦略を安定的に運用したい方に適しています。 使用しているインジケーターと役割 移動平均線: トレンドの有無と方向を測る指標です。このインジケーターでは、価格が移動平均線から乖離し、再び回帰する動きを利用して、トレンドの継続を見極めています。 ストキャスティクス: トレンド方向に順張りするタイミングを測るために使用します。特定の条件を満たしたとき
FREE
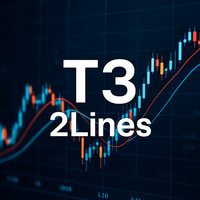
T3 2Lines – ダブルラインで捉えるトレンドの精度 「T3 2Lines」は、T3(Triple Exponential Moving Average)をベースにした2本の移動平均ラインを表示するMT4インジケーターです。短期および長期のT3ラインを同時に描画することで、トレンドの転換点や持続性をより精緻に判断することが可能になります。 このインジケーターでできること 短期と長期、2種類のT3移動平均線をチャートに同時表示 各ラインの期間と平滑係数(smoothing factor)を個別に設定可能 トレンドの初動や継続判断、押し目・戻りの識別に活用 視認性の高いライン表示で裁量トレードの補助に最適 T3とは? T3(Triple Exponential Moving Average)は、一般的な移動平均(SMAやEMA)よりも滑らかなカーブを描くのが特徴です。従来の移動平均に比べてノイズが少なく、トレンドの本質をより明確に視覚化することができます。「T3 2Lines」では、このT3を短期・長期で重ねることで、より多角的な相場分析が可能になります。 主な用途と活用シナリオ ク
FREE
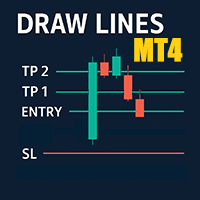
エントリー、テイクプロフィット、ストップロスのレベルをチャートに簡単に描画し、トレードシグナルを分析・追跡できます。 主な機能 エントリー、TP1、TP2、TP3、SL の値を簡単に入力 シグナルの発生時刻を示す垂直線(オプション) 各ラインのラベルや色を自由にカスタマイズ可能 シグナルの精度やリスクリワード比を視覚的に確認 すべての銘柄・時間足に対応 再描画なし、遅延なし、常に安定した表示 使用例 Telegram、WhatsApp などのチャンネルからのシグナルを可視化 過去のシグナルを分析し、市場の反応を学ぶ クライアントやコミュニティに対し、分かりやすいシグナル構成を提示 手動または自動戦略と組み合わせて使用 キーワード シグナル, ライン描画, エントリー, テイクプロフィット, ストップロス, 外国為替, テレグラム, ビジュアルシグナル, マニュアルトレード, シグナル分析, TP, SL, チャート, レベル, 評価, 教育, インジケーター, ツール
FREE

概要 TSI(True Strength Index)インジケーターは、価格の勢いを示すオシレーターであり、MT4上のサブウィンドウに描画されます。MTM(Momentum)とその絶対値を二重の指数移動平均(EMA)で平滑化し、その比率を100倍して算出します。相場のトレンドの強弱や転換点を視覚的に把握しやすく設計されています。 主な機能 二重EMAによるノイズ除去と滑らかなライン表示 シグナルEMAによる売買タイミングの補助 ±100%の範囲での値動き表示(自動スケーリング) 0%/±50%のレベルライン表示による視認性向上 期間設定を自由に変更可能(高速EMA、低速EMA、シグナルEMA) インストール方法 MT4の「ファイル」→「データフォルダを開く」を選択。 「MQL4」→「Indicators」フォルダに本インジケーター(TSI.mq4)をコピー。 MT4を再起動、または「ナビゲーター」ウィンドウで右クリックして「更新」を実行。 チャート上で「挿入」→「カスタム」→「TSI」を選択し、パラメーターを設定して表示。 パラメーターの説明 変数名 初期値 説明 FastEMAPer
FREE
Schaff Trend Cycleとは Schaff Trend Cycle(STC)は、トレンドの転換点をタイムリーに捉えるために設計されたオシレーター系インジケーターです。従来の移動平均やMACDと比較して、サイクル的な動きとモメンタムを組み合わせることで、トレンドの始まりと終わりをより明確に把握できます。 主な特徴 トレンド転換シグナルの明確化:上昇トレンドではサイクルラインが上向きに、下降トレンドでは下向きに推移します。 レンジ相場でのだましを抑制:サイクル周期を考慮した平滑化処理により、短期的なノイズを減少させます。 パラメーター調整が容易:期間や平滑化係数を変更するだけで、動作感度を初心者から上級者まで幅広く調整可能です。 計算ロジック概要 モメンタムの算出
指定期間の価格変化をもとに、短期および長期のモメンタムを計算します。 サイクル平滑化
モメンタムに対し、二重平滑化(ダブル・スムージング)を適用し、サイクル的な振動成分を抽出します。 正規化処理
0~100の範囲に正規化し、オシレーターとして表示します。 シグナル生成
水平ライン(通常は25と75)を上下に抜
FREE

Aroon Classic インジケーターの概要 Aroon Classic は、チャート上でトレンドの発生と持続性を定量的に把握できるテクニカル指標です。トレンドの強さや転換タイミングを「Aroon Up」と「Aroon Down」という2本のラインで示し、0~100 の範囲で表示されます。Aroon Up が高値圏にあるほど上昇トレンドが強く、Aroon Down が高値圏にあるほど下降トレンドが強いことを意味します。 主な特徴 トレンドの発生から転換までを視覚的に判別可能 カスタマイズ可能な計算期間(デフォルト14期間) 線の色・太さ・スタイルを自由に設定可能 インジケーターのパラメーター パラメーター名 説明 デフォルト値 Period Aroon の計算に使用するバー数 14 Aroon Up Color Aroon Up ラインの色 DodgerBlue Aroon Down Color Aroon Down ラインの色 Tomato Line Width ラインの太さ(ピクセル) 2 インジケーターの計算方法 Aroon Up は、直近期間内の最高値が発生してからのバー数
FREE

Range Filtered AlgoAlphaは、市場のボラティリティを分析することで潜在的な取引機会を特定するためのテクニカル分析ツールです。このMetaTrader向けAlgoAlphaオリジナルTradingViewインジケーターの改訂版は、複数の分析方法を組み合わせて視覚的な市場評価を提供します。 技術的特徴
価格平滑化にカルマンフィルター(Kalman Filtering)を採用
ボラティリティ測定にATRベースバンド(ATR-based Bands)を統合
トレンド分析にスーパートレンド(Supertrend)要素を組み込み
カラーろうそく足(Candles)とマーカー(Markers)で視覚的シグナルを提供
設定可能なアラート機能(Configurable Alerts)を装備 機能性
当インジケーターは市場データを処理し以下を実現:
ATR(平均真の範囲)を使用したボラティリティレンジ計算
市場ノイズ低減のためのフィルタリング技術(Filtering Techniques)適用
視覚的要素(Visual Elements)による潜在的なトレンド方向の表示 使用事例
ボ

Radius Trend by ChartPrime MT5 で取引戦略を強化しましょう。この先進的なツールは, 価格アクションとボラティリティに基づいてトレンドバンドを動的に調整し, トレンド方向, 強度, 潜在的な反転についてのリアルタイムインサイトを提供します. ChartPrimeによって開発されたこのインジケーターは, 静的なトレンドラインとは異なり, グラフをレーダーのようにスキャンするユニークな半径ベースの方法を使用し, 市場条件に適応します. MQL5で革新的なアプローチにより人気があり, マルチタイムフレームサポートとExpert Advisor統合で好評を博し, ボラティリティの高い環境でトレンドの流動的なビューを提供します. Radius Trend はボラティリティに拡張/収縮する外部と内部バンドでトレンドを視覚化し, 正確な配置のために平滑化計算を使用します. メイントレンドラインはステップベースの半径を通じて角度をシフトし, 上昇トレンド (chartreuse) または下降トレンド (赤) を強調し, 点線の内部バンドは反転や継続を検知するのに役立ちます.
Cm Ultimate Ma Mtf MT5 で取引決定を強化しましょう, さまざまなMAタイプをサポートする多機能移動平均インジケーターで, マルチタイムフレーム分析のための広範なカスタマイズを提供します. TradingViewの人気ツールにインスパイアされ, MT5用に洗練されたこのインジケーターは, SMA, EMA, WMA, HullMA, VWMA, RMA, TEMA, Tilson T3 を含む, 2010年代以降, 異なるタイムフレームからデュアルMAをプロットする能力で人気を集めています. 非再描画でユーザー友好, 価格クロスとMA交差を強調, forexや暗号のようなボラティリティの高い市場でのトレンド検知に理想的です. トレーダーは Cm Ultimate Ma Mtf をデュアルMA機能で好み, 上位タイムフレームから第2 MA (例: H1チャートでのデイリー) を許可してクロス検知と方向に基づく色変更を行います. Highlight bars は価格がプライマリまたはセカンダリMAをクロスするシグナル, 潜在的なエントリー/エグジットを検知するのに役

2 copies left at $65, next price is $120
Scalper System is a user-friendly indicator designed to detect market consolidation zones and anticipate breakout movements. Optimized for the M1 or M15 timeframe, it performs best on highly volatile assets like gold (XAUUSD). Although originally designed for the M1 or M15 timeframe, this system performs well across all timeframes thanks to its robust, price action-based strategy.
You can visually backtest the indicator to evaluate the accuracy of its si
** All Symbols x All Time frames scan just by pressing scanner button ** After 18 years of experience in the markets and programming, Winner indicator is ready. I would like to share with you! *** Contact me to send you " Trend Finder indicator " free, instruction and add you in "M1 Signal Scanner group" for sharing or seeing experiences with other users. Introduction: M1 Signal Scanner is the indicator designed scalping M1 time frame to detect Small trend switching in the direction

VWAP Ultimate Pro MT4 – Anchored VWAP | Session VWAP | Dynamic Bands & Smart Alerts Bring Institutional-Grade VWAP Precision to the Classic MetaTrader 4 Platform
WHY TRADERS CHOOSE VWAP ULTIMATE PRO MT4?
VWAP (Volume-Weighted Average Price) is a popular benchmark used by professional traders to gauge fair value and session bias. VWAP Ultimate Pro MT4 delivers that same core power to retail traders, optimised for MT4’s architecture while preserving a full professional workflow. This Indicator

Buy Sell Magic AI is a professional MetaTrader 4 indicator that combines the strength of Bollinger Bands with a dynamic central midline functioning as a real‑time trend line. It generates clear entry signals based on consecutive candle closes above or below the midline, which shifts color to immediately reflect bullish or bearish momentum. The upper and lower Bollinger Bands provide a visual representation of volatility, while the midline acts as both a price equilibrium and a dynamic confirmati
FREE

It's a very convenient and easy to use indicator, as well as powerful and accurate. It detects and visually displays the start of a new trend. It is presented in a two-color bar chart: one for the start of an uptrend and one for the start of a downtrend. The indicator only requires the number of bars to look at for its calculation. Calculation. a) The indicator compares the current candlestick close with the high or low of the previous candle group. If it's higher than the high, it indicates an

RSIBandsTREND is a custom trend-focused indicator that enhances the classic RSI approach by visualizing dynamic upper and lower bands based on RSI calculations.
It plots three clean bands (upper, lower, and midline) directly on the chart, helping traders identify overbought and oversold zones with precision. Features: Three-band system: upper, lower, and center RSI lines EMA-smoothed RSI band calculation Clear trend zone visualization on chart Works on all timeframes (M1 to Monthly) Fully opt

Detailed Description with screenshots here: https://www.mql5.com/en/blogs/post/763562
Features Three Hull MA Variations: Classic HMA, Exponential HMA (EHMA), and Triangular HMA (THMA) Multi-Timeframe Support: View higher timeframe Hull MA on any chart Dynamic Color Coding: Automatic trend-based color switching for easy visualization Candle Body Coloring: Color candle bodies based on Hull trend or price position Real-Time Alerts: Get notified on trend changes and candle color switches Customiza
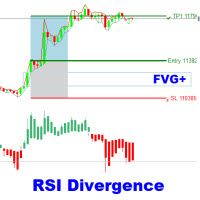
The RSI Divergence + FVG Signal indicator combines Relative Strength Index (RSI) Divergence with Fair Value Gap (FVG) detection to generate high-probability buy and sell signals based on both momentum shifts and institutional imbalance zones. Core Features: RSI Divergence Detection :
Identifies both regular and hidden bullish/bearish divergences between price and RSI. Divergences indicate potential trend reversals or continuation. FVG Zone Recognition :
Detects Fair Value Gaps (imbal

Forex Target Zones Indicator – Master Key Support & Resistance Levels
Unlock the power of precise trading with the Forex Target Zones Indicator, the ultimate tool for identifying high-probability buy and sell zones based on previous weekly and daily highs and lows. Designed for both scalpers and swing traders, this indicator highlights critical levels where price is likely to react, giving you a competitive edge in the forex market.
Key Features: Smart Weekly & Daily Zones – Instantly
FREE

Mantis Shrimp Convergence (MSC) A new way to see market momentum — no lag, no confusion.
What is MSC? Mantis Shrimp Convergence (MSC) is a powerful non-repainting oscillator, inspired by the logic of MACD but rebuilt for modern trading: zero lag, no false divergences, and dual-line precision. Designed for traders who demand clarity, speed, and reliability, MSC reveals momentum shifts with unmatched visual and structural accuracy.
How it Works MSC uses two signal lines — Fast and Slow,
Welcome to order block indicator – your complete solution for identifying high-probability zones using order blocks , BOS (Break of Structure) , and CHOCH (Change of Character) .
Designed for precision and speed, this tool gives you the edge in spotting potential reversal and continuation zones just like the pros.
Features : Automatic Order Block Detection: Effortlessly identifies valid bullish and bearish order blocks based on price structure and market behavior. BOS & CHOCH Detect

Last frontier. Spartan is a premium "AI powered indicator" designed to identify the direction of price movements and potential reversal and exhaustion points. This tool is particularly beneficial for individuals seeking a clearer price movement. It can function as an enhancement to existing trading systems, operate independently, or assist in scalping strategies.
Price $499 for the first 5 customers, then it will reach $1999
Suggested time frame M1
1. Open BUY trades on arrow signal. Open S
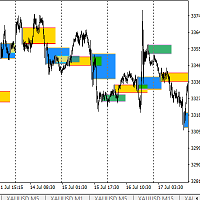
Trade are base on Breakout Session Box ( based on Time Setting ) . Can use for scalping , intraday or reversal ( based on your experience ) Can be use on M1 to M30 chart . Best use on M30 and Trade on M5 . Trade can be use buy limit/sell limit or buy stop/sell stop depend on your trading style .
Setting file are The best time setup to trade for Gold or Xauusd as per my trading style .
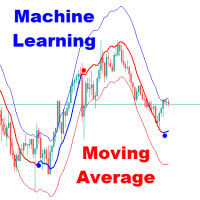
The Adaptive Gaussian Moving Average or also known as Machine Learning Moving Average (MLMA) is an advanced technical indicator that computes a dynamic moving average using a Gaussian Process Regression (GPR) model. Unlike traditional moving averages that rely on simple arithmetic or exponential smoothing, MLMA applies a data-driven, non-linear weighting function derived from the Gaussian process, allowing it to adaptively smooth the price while incorporating short-term forecasting cap
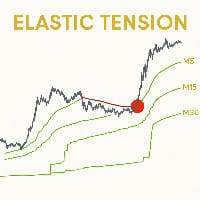
Elastic Tension MTF (M5 Only)
Индикатор многотаймфреймового натяжения цены Автор: Александр Лапин Профиль на MQL5
---
Описание
Elastic Tension MTF — это интеллектуальный авторский индикатор, основанный на концепции «упругой силы» в движении цены. Он анализирует рыночные данные с нескольких таймфреймов и визуализирует потенциальные уровни натяжения цены, отображая их на графике M5.
Индикатор моделирует поведение цены как движение под действием силы упругости, рассчитываемой по

TrendPeakValley Scanner v1 – Advanced Reversal Detection Tool
TrendPeakValley Scanner v1 is a powerful custom indicator designed to detect price peaks and valleys based on price action analysis. It visually highlights local tops and bottoms, making it ideal for traders who rely on market structure, support/resistance zones, and reversal patterns.
---
Key Features:
Peak & Valley Detection: Scans historical price action and identifies swing highs/lows based on customizable sensitivi
FREE

Robinhood Gold EA – Smart Auto Trading Expert (MT4) Version: 1.00
Platform: MetaTrader 4
Recommended Timeframes: M15 & H1
Main Pair: XAUUSD (Gold), also works with GBPUSD, EURUSD, GBPJPY What is Robinhood Gold EA? Robinhood Gold EA is a fully automated trading system designed to enter trades only at the most confirmed breakout moments. It combines trend structure logic with RSI confirmation and executes trades based on visual arrow signals provided by the Robinhood Arrow Indicator , which

Clearly displays uptrend and downtrend lines based on SmartTrend333 logic
Shows arrow signals at key trend reversals to help you catch early entries
Works great for scalping, intraday, and swing strategies across all timeframes
Trend detection based on advanced mathematical smoothing and normalization
Helps reduce noise and filter fakeouts in sideways markets
Lightweight and optimized for fast performance with zero lag
Compatible with all MT4 brokers and instruments (forex, crypto

Momentum Hunter – 高度なリペイントなしモメンタムインジケーター Momentum Hunter は、新しいモメンタムを検出し、トレーダーが市場の動きを正確に捉えるために設計された強力で信頼性の高いインジケーターです。特に M1タイムフレーム 用に最適化されていますが、上位タイムフレームでもシームレスに動作し、スキャルパーやスイングトレーダーにも適しています。 主な特徴: リペイントなし & 遅延なし :シグナルは安定しており、矢印はローソク足が確定した後にのみ表示されます。 シンプルなインターフェース :矢印、ストップロスラベル、トレーリングストップラベルのみが表示され、複雑なボタンなどはありません。 即時アラート :シグナルが表示されるとすぐにMetaTraderとモバイルデバイスに通知が届きます。 全てのトレーダー向けに設計 :M1でスキャルピングをする場合でも、上位タイムフレームでトレードする場合でも、Momentum Hunterはあなたのスタイルに適応します。 この高度なツールは、複数の実証済み戦略を組み合わせています:
移動平均線 でトレンド方向を分析
ボ

皆さん、こんにちは。自信を持ってお勧めできる新製品が長らくありませんでしたが、ついにその時が来ました。 これは私の最初のインジケーターを基にした新製品で、余計な設定を省き、ゴールド(金)に最適化された改良版です。取引に便利なものを作ってほしいとよく頼まれましたが、テストとデバッグには非常に多くの時間がかかるため、簡単にはいきませんでした。 前作同様、このインジケーターにも独自のニュアンスがありますが、最適化における主な目標は、インジケーターを実用的なものにすることでした。 このインジケーターは通知の送信をサポートしています。 使用推奨事項: 銘柄 - XAUUSD (メイン、これに最適化済み) 銘柄 - XAUEUR (サブ、最適化はしていませんが、結果は良好です) チャート時間足 - H4。 インジケーターをチャートに設定したら、そのままにして触らないでください。 買いシグナル - 青い矢印。 売りシグナル - 赤い矢印。 エントリーポイントを探すための主要な情報源として使用できます。 ストップロス (黄色の点) - これに従うことをお勧めします。 使用シナリ

Auto Optimized MFI は、自動で最適なMFIの買い・売りレベルを調整するインジケーターです。過去のデータに基づいて実際のトレードシミュレーションを行い、あなたの市場や時間足に合わせて最も効果的なエントリーポイントを見つけ出します。従来の80/20といった固定的なMFI基準ではなく、実際の価格と出来高の動きに適応するのが特徴です。 動作の仕組み 指定した範囲の過去のローソク足を分析し、MFIシグナルに基づくエントリーとエグジットをシミュレーションします。勝率、ドローダウン、TP/SL(利益確定/損切り)などの成績を記録し、これらの結果から最適なMFIレベルを毎日、毎週、または毎月自動で更新します。 主な機能 設定可能なMFI期間(デフォルト:14) 最適化するローソク足の範囲を指定可能 買い/売りレベルの範囲をカスタマイズ可能 細かい調整が可能なステップサイズ設定 最小利益ターゲットの設定で弱い戦略を排除 MFIラインとシグナル矢印のスタイル設定が可能 このツールは、市場の変化に柔軟に対応したいトレーダーに最適で、固定ルールに頼らず常に市場に適応する戦略を実現します。

概要 BBWidth 3Lines は、ボリンジャーバンドの上下幅(+σと−σの差)をポイント単位で数値化し、サブウィンドウにラインとして表示するカスタムインジケーターです。 通常のボリンジャーバンドでは「価格との乖離」や「バンドへの接触」に注目されがちですが、本ツールは バンド幅そのもの に着目し、 ボラティリティの状態を視覚的に分析 することに特化しています。 主な特徴 ボリンジャーバンドの上下幅(+σと−σの差)をPoint単位で数値化してライン表示 表示されるラインは最大3本まで、任意のσ値(標準偏差)を個別に設定可能 各ラインは表示/非表示を個別に切り替え可能で、分析の目的に応じて柔軟に使用可能 ラインカラーは視認性を重視し色分け(例:Aqua・Lime・YellowGreen) サブウィンドウに表示されるため、ローソク足や他のインジケーターと干渉せず、見やすい バンド幅の変化を視覚的に捉えることで、 スクイーズ(収縮)やエクスパンション(拡大) といったボラティリティ状態の識別が容易 レベルラインを設定することで、低ボラティリティ環境におけるトレードを制限するフィルターとし
FREE
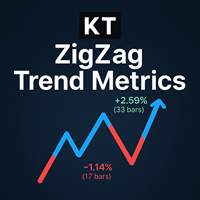
KT ZigZag Trend Metrics は、市場のスイングをわかりやすいトレンド&構造マップに変換し、初心者でも一目で転換点と価格の流れを把握できます。各スイングを「Higher High」「Lower High」「Lower Low」「Higher Low」に分類し、前回スイングからの変化率を表示します。 さらに、新高値・新安値が形成されるまでに要したローソク足本数を示し、直近の高値と安値を線で結ぶことで、ハーモニックパターンを捉えやすい X 線ビューを提供します。
特徴
市場構造を瞬時に俯瞰でき、プライスアクショントレーダーの分析時間を大幅短縮。 スイング高低をマーキングし、変化率とバー数を併記。 余計な情報を排除し、必要なスイング指標だけを可視化。 精密なスイング検出で定評ある ZigZag 指標をベースに全メトリクスを計算。 スイング感度(depth period)を調整し、検出位置を微調整可能。 色・線幅・文字サイズを自由にカスタマイズし、チャートテーマに統一感を持たせられる。
標準 ZigZag より優れている点 従来の ZigZag は過去のスイングを結ぶだけ

RCI(Rank Correlation Index)インジケーター 概要 RCI(Rank Correlation Index)インジケーターは、価格データの順位相関をもとに相場のトレンドや転換点を分析できるオシレーター系の指標です。
指定期間の価格順位と時間順位の相関をもとに、-100~+100の範囲で数値化し、上昇・下落・転換局面をシンプルなラインで可視化します。
裁量トレードから自動売買ロジックのフィルターまで、幅広い戦略で活用可能です。 主な特徴 RCIの値は+100付近で強い上昇、-100付近で強い下落、0付近でトレンド転換・レンジを示唆 チャート上にシンプルなライン表示で視認性が高い 順位相関を利用した独自のトレンド・タイミング把握 逆張り・順張りどちらの戦略にも活用できる パラメーター パラメーター名 説明 RCI期間 RCIの計算対象となる期間(例:9, 14, 20など任意に設定可能) パラメーター名・メッセージは英語表記です。 主な利用シーン トレンド判定(相場の勢い・転換ポイントの把握) 押し目買い・戻り売りポイントの発見 逆張りシグナルの参考指標として 自動売
FREE

DhanSutraXは、チャートの再描画なしでエントリーポイントと決済ポイントを正確に表示する、完全に機能するトレーディングシステムです。買いと売りのシグナルに従うだけでOKです!
このインジケーターは、以下の機能を備えた完全に機能するトレーディングシステムであるため、すべてのトレーダーが使用すべきです。
チャート上に視覚的なヒントで、トレードのオープンとクローズのタイミングを正確に示します。 再描画なし - シグナルは表示された後も変更されません。 標準偏差チャネルの傾きとSARを用いて市場ノイズをフィルタリングし、誤ったエントリーを95%削減します! 自律的に動作 - 追加のインジケーターや設定は不要です。 手動取引だけでなく、EAでも使用できます。 テストでは、94%以上のシグナル精度を示しました。これは、100個のシグナルのうち、94個が成功し、6個のみが失敗したことを意味します。
取引推奨: 通貨ペア:EURUSD、GBPUSD、XAUUSD 期間:M5、M15、M30、H1 ブローカー:任意 追加インジケーターは不要です。
このインジケーターは、方向性インパルスの

MurreyGannQuantum - Professional Trading Indicator Advanced Murrey Math & Gann Angle Technical Analysis with Complete EA Integration Professional technical indicator combining Murrey Math level analysis with Gann angle calculations. Features comprehensive visual analysis, multi-timeframe adaptation, and complete EA integration capabilities for automated trading systems. The blog: https://www.mql5.com/en/blogs/post/763757
CORE FEATURES Technical Implementation: Murrey Math Levels: 9 dynamic su

Arsi Scalper Pro – Smart Entry/Exit Signal System Arsi Scalper Pro is a powerful, non-repainting signal indicator built for precision scalping and intraday trading. Designed with statistical logic and volatility filtering, it helps traders enter and exit with clarity and speed. It works across multiple timeframes and pairs, especially effective on M1 to M30 charts. Key Features Buy ( ^ ) and Sell ( v ) text signals directly on chart Advanced logic with ATR and dynamic smoothing Timef

About: Someone recently shared a pinescript with me. And asked me to convert it to MT4. I found the FVG blocks very effective as SR areas. So here it is. Enjoy!!
What are Fair Value Gaps (FVG)? Fair Value Gaps occur when price moves so quickly that it creates an imbalance between buyers and sellers. These gaps represent areas where price "skipped" levels, creating potential zones for price to return and "fill the gap". Think of it as unfinished business in the market that often gets revisited.
FREE
MetaTraderマーケットが取引戦略とテクニカル指標を販売するための最適な場所である理由をご存じですか?宣伝もソフトウェア保護も必要なく、支払いのトラブルもないことです。これらはすべて、MetaTraderマーケットで提供されます。
取引の機会を逃しています。
- 無料取引アプリ
- 8千を超えるシグナルをコピー
- 金融ニュースで金融マーケットを探索
新規登録
ログイン