Advanced Breakout Scanner Dashboard
- インディケータ
- バージョン: 7.0
- アップデート済み: 29 9月 2025
- アクティベーション: 20

Super Signal Series – V6 PRO
Advanced Breakout Scanner Dashboard Exclusive Bonus When you purchase this indicator, you receive 2 professional Gold EAs:
MT4 Gold EA
XAU Trend Matrix EA – Worth $150 : See the EA https://www.mql5.com/en/market/product/162870MT5 Gold EA
XAU Steady Gain Pro – Worth $150 : See the EA https://www.mql5.com/en/market/product/162861
Total Bonus Value: $300
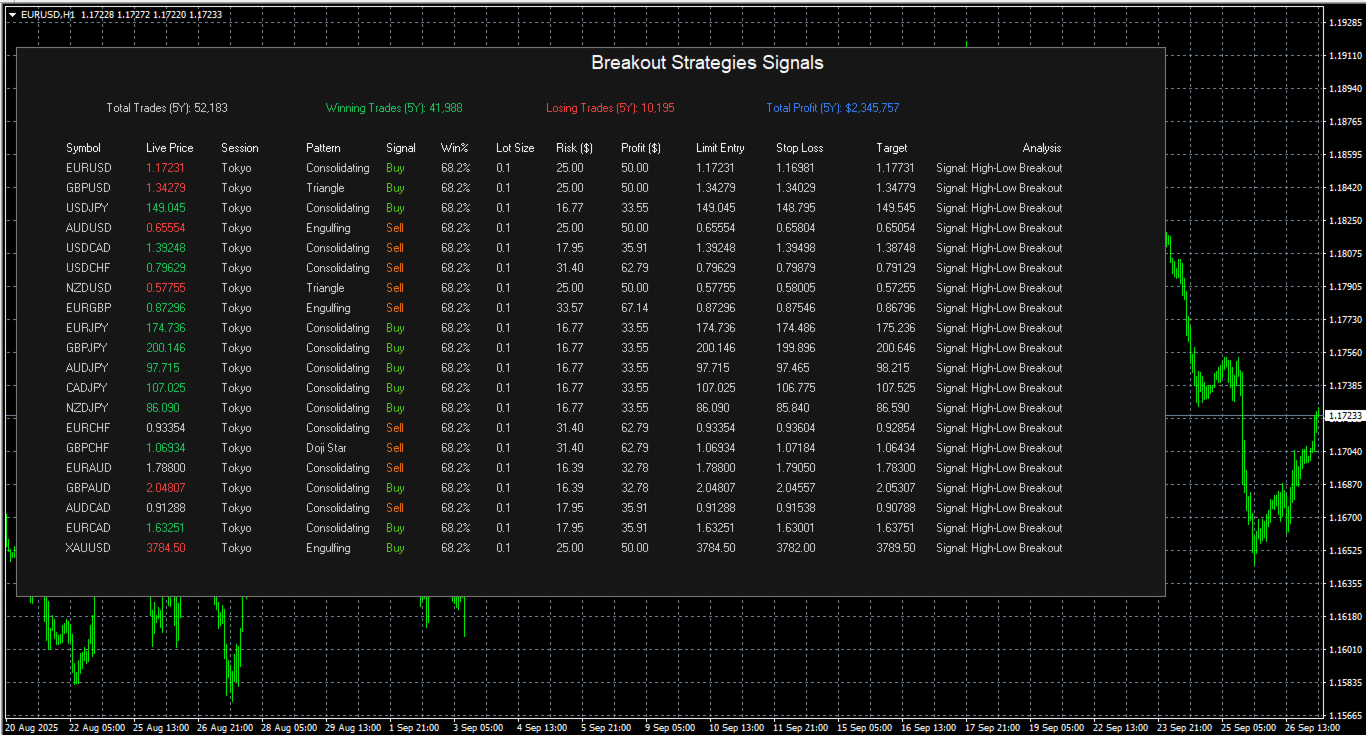
Advanced Breakout Scanner Dashboard
Super Signal Series – V6 PRO is a professional multi-pair breakout scanner that monitors up to 28 currency pairs in real time from a single chart. It identifies high-probability BUY / SELL breakout signals with clearly defined Entry, Stop Loss, and Target levels, allowing traders to act quickly and efficiently.
This is not just a signal indicator — it is a complete breakout trading dashboard built for serious traders.
Key Features• Scans 28 major & cross pairs + XAUUSD
• 10 proven breakout strategies
• Clear BUY / SELL signals with full trade levels
• Strategy name & breakout type displayed
• Built-in dynamic win-rate statistics
• Fully customizable & lightweight
Asian, London & New York Session Breakouts
Opening Range & Previous Day High/Low
Bollinger, Keltner & Donchian Channels
Flag, Pennant & Triangle Breakouts
Timeframes: M5, M30, H1
Account: ECN / Low-spread
Lot Size: 0.01 per $100 equity
This indicator is for informational and analytical purposes only and does not guarantee profits. Trading involves significant risk; always apply proper risk and money management.