MQL4 と MQL5 を利用してフラクタルベースのトレンドラインをプロットする。
目次
- はじめに
- 1. 入力パラメータ、関数と変数の初期宣言
- 2. 直近のフラクタル検索
- 3. フラクタルの価格と時間値決定
- 4. オブジェクトのクリアとそのプロパティ編集ラインの再描画
- 5. バー履歴ロードの確認
- 6. トレンドラインブレークスルーのシグナル、プッシュ通知
- 7. トレーディングにおけるトレンドラインの実用的利用
- おわりに
はじめに
最近私はトレンドラインを利用することを考えていました。ラインをプロットするポイイントの決定方法の選択とラインを正確にプロットすることに関する疑問がありました。そこで私は基本にフラクタルを使用することにしました。
私はトレーディングに時間をいくらか費やすことのできるメインの業務で頻繁にマーケットを分析します。また大きなタイムフレームではただ単にラインをひくことはできません。ラインは15分までの精度で極値によってプロットされる必要があるのです。その理由はおおきなタイムフレームにおけるフラクタル時間は必ずしも M15 の同じ端点に一致するわけではないためです。要するに、これは自動化が役に立つ場面です。MQL5 を使用してコードを書き始め、MQL4に移るということがありました。なぜなら私がこのプログラムを必要としたのはMetaTrader 4 に対してだったのです。
本稿では MQL4 および MQL5 を使用した問題解決方を提供します。比較展望を提供しますが、ここで MQL4 と MQL5 hの効率を比較するのは適切ではないでしょう。またおそらく私のものより効果的な他の解決法もあることは解っています。 MQL4 か MQL5 のどちらかでスクリプトを各初心者の糧にとっては便利です。とりわけフラクタルとトレンドラインの利用を考えている方にとっては有用でしょう。
1. 入力パラメータ、関数と変数の初期宣言
私は入力パラメータとして以下の変数を使用しました。
input color Resistance_Color=Red;       // setting the resistance line color
input ENUM_LINE_STYLE Resistance_Style; // setting the resistance line style
input int Resistance_Width=1;           // setting the resistance line width
input color Support_Color=Red;          // setting the support line color
input ENUM_LINE_STYLE Support_Style;    // setting the support line style
input int Support_Width=1;              // setting the support line width
これらパラメータは MQL4 と MQL5 に共通です。
MQL5 では事前にインディケータを作成する必要があります。
//--- iFractals indicator handle
int Fractal;
//+------------------------------------------------------------------+
//| Expert initialization function                                   |
//+------------------------------------------------------------------+
int OnInit()
  {
//--- getting the iFractals indicator handle
   Fractal=iFractals(Symbol(),PERIOD_D1);
//---
   return(INIT_SUCCEEDED);
  }
プログラムがグラフィカルオブジェクトを描画するため、チャートから Expert Advisor を削除する際それらを削除することには理にかなっています。
void OnDeinit(const int reason)
  {
   ObjectDelete(0,"TL_Resistance");
   ObjectDelete(0,"TL_Support");
  }
ラインを 2 本(サポートラインとレジスタンスライン)引くには4点が必要です。ラインを横切る点を決めるには、時刻と価格を知る必要があります。
座標は次の順序で決まります。:まず極端なバーを見つけます。極端なバーがわかると極値端点の価格と時刻を決定することができます。
OnTick() 関数内で変数を宣言します。
| MQL4 |
|---|
//--- declaration of variables int n,UpperFractal_1,UpperFractal_2,LowerFractal_1,LowerFractal_2; |
| MQL5 |
|---|
//--- declaration of variables int n,UpperFractal_1,UpperFractal_2,LowerFractal_1,LowerFractal_2; //--- declaring the arrays for writing values of the iFractal indicator buffer double FractalDown[],FractalUp[]; double UpFractal_1,UpFractal_2,LowFractal_1,LowFractal_2; |
最初に形成されたフラクタルを持つバーのインデックスを格納する変数を宣言しました。
MQL4では以下です。
- n-この変数は for ループ演算子によって直近の既知フラクタルを検索するのに必要です。
- UpperFractal_1、UpperFractal_2、LowerFractal_1、 LowerFractal_2 -これら変数は高値/安値を持つ1番目と2番目に近い極点でのバーのインデックスを格納します。
MQL5 ではもう一つ別の変数を取り入れます。
- FractalDown[],FractalUp[]; -iFractals インディケータバッファの値を格納するためにダブル値の配列を宣言します。
- 次にダブルタイプ変数です。:UpFractal_1、UpFractal_2、LowFractal_1、LowFractal_2。それらは端点の価格値を格納します。
2. 直近のフラクタル検索
形成されたフラクタルを持つバーのインデックスを見つけるには for ループ演算子を使用します。
最初と2番目の上側フラクタルに対応する最初の2本のバーのインデックスを決定します。
| MQL4 |
|---|
//--- finding the bar index of the first nearest upper fractal for(n=0; n<(Bars-1);n++) { if(iFractals(NULL,1440,MODE_UPPER,n)!=NULL) break; UpperFractal_1=n+1; } //--- finding the bar index of the second nearest upper fractal for(n=UpperFractal_1+1; n<(Bars-1);n++) { if(iFractals(NULL,1440,MODE_UPPER,n)!=NULL) break; UpperFractal_2=n+1; } |
| MQL5 |
|---|
//--- first, we need to write the Fractal indicator buffer values into the arrays //--- filling arrays with buffer values CopyBuffer(Fractal,0,TimeCurrent(),Bars(Symbol(),PERIOD_D1),FractalUp); CopyBuffer(Fractal,1,TimeCurrent(),Bars(Symbol(),PERIOD_D1),FractalDown); //--- indexing like in timeseries ArraySetAsSeries(FractalUp,true); ArraySetAsSeries(FractalDown,true); //--- next, we use the for loop operator to find the first upper fractal for(n=0; n<Bars(Symbol(),PERIOD_D1); n++) { //--- if the value is not empty, break the loop if(FractalUp[n]!=EMPTY_VALUE) break; } //--- writing the price value of the first fractal into the variable UpFractal_1=FractalUp[n]; //--- writing the index of the first fractal into the variable UpperFractal_1=n; //--- finding the second upper fractal for(n=UpperFractal_1+1; n<Bars(Symbol(),PERIOD_D1); n++) { if(FractalUp[n]!=EMPTY_VALUE) //if the value is not empty, break the loop break; } //--- writing the price value of the second fractal into the variable UpFractal_2=FractalUp[n]; //--- writing the index of the second fractal into the variable UpperFractal_2=n; |
ここで私は MQL5 と MQL4 の主な違いの一つを示しました。時系列にアクセスする関数を使用することです。
MQL4 では私はすぐに形成されたフラクタルを持つバーのインデックスを探し始めましたが、MQL5 ではCopyBuffer() 関数を持つiFractals インディケータにアクセスすることで上下のフラクタル価格値を格納するために配列 FractalUp[] および FractalDown[] を指定しました。次に ArraySetAsSeries() 関数によって時系列としてこれら配列のインデクシングを設定しました。
MQL4 では既知のフラクタルを持つバーのインデックスだけ取得しましたが、 MQL5 ではバーインデックスとフラクタルの価格値を取得するために CopyBuffer()関数を使いました。
同様に低い方のフラクタルで最初の2つを見つけます。
| MQL4 |
|---|
//--- finding the bar index of the first nearest lower fractal for(n=0; n<(Bars-1);n++) { if(iFractals(NULL,1440,MODE_LOWER,n)!=NULL) break; LowerFractal_1=n+1; } //--- finding the bar index of the second nearest lower fractal for(n=LowerFractal_1+1; n<(Bars-1);n++) { if(iFractals(NULL,1440,MODE_LOWER,n)!=NULL) break; LowerFractal_2=n+1; } |
| MQL5 |
|---|
//--- finding the values of the lower fractals //--- finding the first lower fractal for(n=0; n<Bars(Symbol(),PERIOD_D1); n++) { //--- if the value is not empty, break the loop if(FractalDown[n]!=EMPTY_VALUE) break; } //--- writing the price value of the first fractal into the variable LowFractal_1=FractalDown[n]; //--- writing the index of the first fractal into the variable LowerFractal_1=n; //--- finding the second lower fractal for(n=LowerFractal_1+1; n<Bars(Symbol(),PERIOD_D1); n++) { if(FractalDown[n]!=EMPTY_VALUE) break; } //--- writing the price value of the second fractal into the variable LowFractal_2=FractalDown[n]; //--- writing the index of the second fractal into the variable LowerFractal_2=n; |
ご覧のように、 MQL4 と MQL5 でコードは非常に似通っています。構文にはわずかな違いがあります。
3. フラクタルの価格と時間値決定
ラインを描くにはフラクタルの時刻と価格を決めることが必要です。もちろん、MQL4 ではただ 定義済み時系列の High[] および Low[]とiTime()関数を使用できました。ですが、トレンドラインを確実に正しくプロットするにはより正確な時刻座標を取得する必要があります。
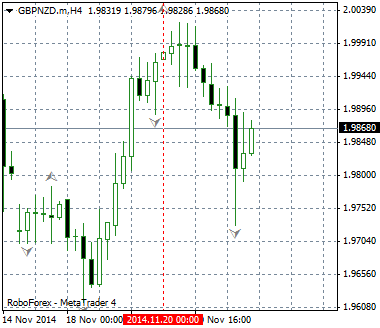
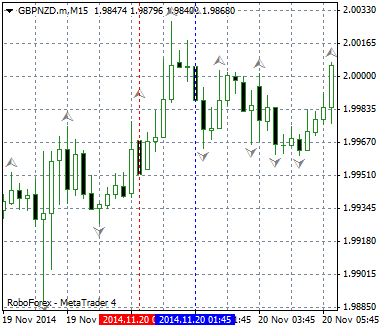
図1、2 タイムフレーム H4 と M15 におけるは極点の時刻値の差を表示しています。

図1 H4 における極点時刻値

図2 M15 における極点時刻値
極点精度15分は私の目的にはひじょうに適しているという結論に至りました。
一般的に極点計算の原則は MQL4 と MQL5 についてほとんど同じですが、細部には一定の違いがあります。
| MQL4 | MQL5 |
|---|---|
|
|
各ステップのコードは以下に表記します。
| MQL4 |
|---|
// ステップ1 大きなタイムフレームにおける端点時刻値決定 //--- determining the time of fractals datetime UpFractalTime_1=iTime(NULL, 1440,UpperFractal_1); datetime UpFractalTime_2=iTime(NULL, 1440,UpperFractal_2); datetime LowFractalTime_1=iTime(NULL, 1440,LowerFractal_1); datetime LowFractalTime_2=iTime(NULL, 1440,LowerFractal_2); |
// ステップ2 小さなタイムフレームにおける極端なバーのインデックス決定 //--- finding the fractal index on M15 int UpperFractal_1_m15=iBarShift(NULL, 15, UpFractalTime_1,true); int UpperFractal_2_m15=iBarShift(NULL, 15, UpFractalTime_2,true); int LowerFractal_1_m15=iBarShift(NULL, 15, LowFractalTime_1,true); int LowerFractal_2_m15=iBarShift(NULL, 15, LowFractalTime_2,true); |
// ステップ3 М15について明確になった端点を検索するための配列使用 //--- using the arrays to find the clarified extreme points //--- introducing the i variable to use in the for loop operator int i; //--- 1. まず低い方の端点を見つけます。 //--- 3.1 低い方の端点検索 //--- declaring the array for storing the index values of the bars int Lower_1_m15[96]; //--- declaring the array for storing the price values double LowerPrice_1_m15[96]; //--- starting the for loop: for(i=0;i<=95;i++) { //--- filling the array with the bar index values Lower_1_m15[i]=LowerFractal_1_m15-i; //--- filling the array with the price values LowerPrice_1_m15[i]=iLow(NULL,15,LowerFractal_1_m15-i); } //--- determining the minimum price value in the array int LowestPrice_1_m15=ArrayMinimum(LowerPrice_1_m15,WHOLE_ARRAY,0); //--- determining the bar with the lowest price in the array int LowestBar_1_m15=Lower_1_m15[LowestPrice_1_m15]; //--- determining the time of the lowest price bar datetime LowestBarTime_1_m15=iTime(NULL,15,Lower_1_m15[LowestPrice_1_m15]); //--- 3.2 2番目の低い方の端点検索 int Lower_2_m15[96]; double LowerPrice_2_m15[96]; for(i=0;i<=95;i++) { //--- filling the array with the bar index values Lower_2_m15[i]=LowerFractal_2_m15-i; //--- filling the array with the price values LowerPrice_2_m15[i]=iLow(NULL,15,LowerFractal_2_m15-i); } //--- determining the minimum price value in the array int LowestPrice_2_m15=ArrayMinimum(LowerPrice_2_m15,WHOLE_ARRAY,0); //--- determining the bar with the lowest price in the array int LowestBar_2_m15=Lower_2_m15[LowestPrice_2_m15]; //--- determining the time of the lowest price bar datetime LowestBarTime_2_m15=iTime(NULL,15,Lower_2_m15[LowestPrice_2_m15]); //--- 3.3 最初の高い方の端点検索 int Upper_1_m15[96]; double UpperPrice_1_m15[96]; for(i=0;i<=95;i++) { //--- filling the array with the bar index values Upper_1_m15[i]=UpperFractal_1_m15-i; //--- filling the array with the price values UpperPrice_1_m15[i]=iHigh(NULL,15,UpperFractal_1_m15-i); } //--- determining the maximum price value in the array int HighestPrice_1_m15=ArrayMaximum(UpperPrice_1_m15,WHOLE_ARRAY,0); //--- determining the bar with the highest price in the array int HighestBar_1_m15=Upper_1_m15[HighestPrice_1_m15]; //--- determining the time of the highest price bar datetime HighestBarTime_1_m15=iTime(NULL,15,Upper_1_m15[HighestPrice_1_m15]); //--- 3.4 2番目の高い方の端点検索 int Upper_2_m15[96]; double UpperPrice_2_m15[96]; for(i=0;i<=95;i++) { //--- filling the array with the bar index values Upper_2_m15[i]=UpperFractal_2_m15-i; //--- filling the array with the price values UpperPrice_2_m15[i]=iHigh(NULL,15,UpperFractal_2_m15-i); } |
| MQL5 |
|---|
// ステップ1 大きなタイムフレームにおける端点時刻値決定 //--- declaring the arrays for storing the time values of the corresponding bar index on a larger timeframe datetime UpFractalTime_1[],LowFractalTime_1[],UpFractalTime_2[],LowFractalTime_2[]; //--- determining the time of fractals on a larger timeframe CopyTime(Symbol(),PERIOD_D1,UpperFractal_1,1,UpFractalTime_1); CopyTime(Symbol(),PERIOD_D1,LowerFractal_1,1,LowFractalTime_1); CopyTime(Symbol(),PERIOD_D1,UpperFractal_2,1,UpFractalTime_2); CopyTime(Symbol(),PERIOD_D1,LowerFractal_2,1,LowFractalTime_2); |
// ステップ 2. 翌日バーの生成時刻決定 //--- determining the generation time of the next day bar (the stop time for CopyHigh(), CopyLow() and CopyTime()) datetime UpFractalTime_1_15=UpFractalTime_1[0]+86400; datetime UpFractalTime_2_15=UpFractalTime_2[0]+86400; datetime LowFractalTime_1_15=LowFractalTime_1[0]+86400; datetime LowFractalTime_2_15=LowFractalTime_2[0]+86400; |
// ステップ3 15分足タイムフレームにおける価格と時刻値を格納するための配列の宣言と書き込み //--- declaring the arrays for storing the maximum and minimum price values double High_1_15[],Low_1_15[],High_2_15[],Low_2_15[]; //--- filling the arrays with the CopyHigh() and CopyLow() functions CopyHigh(Symbol(),PERIOD_M15,UpFractalTime_1[0],UpFractalTime_1_15,High_1_15); CopyHigh(Symbol(),PERIOD_M15,UpFractalTime_2[0],UpFractalTime_2_15,High_2_15); CopyLow(Symbol(),PERIOD_M15,LowFractalTime_1[0],LowFractalTime_1_15,Low_1_15); CopyLow(Symbol(),PERIOD_M15,LowFractalTime_2[0],LowFractalTime_2_15,Low_2_15); //--- declaring the arrays for storing the time values corresponding to the extreme bar indexes datetime High_1_15_time[],High_2_15_time[],Low_1_15_time[],Low_2_15_time[]; //--- filling the arrays CopyTime(Symbol(),PERIOD_M15,UpFractalTime_1[0],UpFractalTime_1_15,High_1_15_time); CopyTime(Symbol(),PERIOD_M15,UpFractalTime_2[0],UpFractalTime_2_15,High_2_15_time); CopyTime(Symbol(),PERIOD_M15,LowFractalTime_1[0],LowFractalTime_1_15,Low_1_15_time); CopyTime(Symbol(),PERIOD_M15,LowFractalTime_2[0],LowFractalTime_2_15,Low_2_15_time); |
// ステップ4 高値と安値と明確になった端点の値検索 //--- determining the highest and lowest price and time values with the ArrayMaximum() and ArrayMinimum() functions int Max_M15_1=ArrayMaximum(High_1_15,0,96); int Max_M15_2=ArrayMaximum(High_2_15,0,96); int Min_M15_1=ArrayMinimum(Low_1_15,0,96); int Min_M15_2=ArrayMinimum(Low_2_15,0,96); |
最終的イン以下のトレンドライン座標を決定しました。
1. サポートラインに対して
| MQL4 | MQL5 |
|---|---|
|
|
2. レジスタンスラインに対して
| MQL4 | MQL5 |
|---|---|
|
|
4. オブジェクトのクリアとそのプロパティ編集ラインの再描画
ラインの座標がわかったところで必要なのは、グラフィカルオブジェクトを作成するだけです。
| MQL4 |
|---|
//--- creating the support line ObjectCreate(0,"TL_Support",OBJ_TREND,0,LowestBarTime_2_m15,LowerPrice_2_m15[LowestPrice_2_m15], LowestBarTime_1_m15,LowerPrice_1_m15[LowestPrice_1_m15]); ObjectSet("TL_Support",OBJPROP_COLOR,Support_Color); ObjectSet("TL_Support",OBJPROP_STYLE,Support_Style); ObjectSet("TL_Support",OBJPROP_WIDTH,Support_Width); //--- creating the resistance line ObjectCreate(0,"TL_Resistance",OBJ_TREND,0,HighestBarTime_2_m15,UpperPrice_2_m15[HighestPrice_2_m15], HighestBarTime_1_m15,UpperPrice_1_m15[HighestPrice_1_m15]); ObjectSet("TL_Resistance",OBJPROP_COLOR,Resistance_Color); ObjectSet("TL_Resistance",OBJPROP_STYLE,Resistance_Style); ObjectSet("TL_Resistance",OBJPROP_WIDTH,Resistance_Width); |
| MQL5 |
|---|
//--- creating the support line ObjectCreate(0,"TL_Support",OBJ_TREND,0,Low_2_15_time[Min_M15_2],Low_2_15[Min_M15_2],Low_1_15_time[Min_M15_1],Low_1_15[Min_M15_1]); ObjectSetInteger(0,"TL_Support",OBJPROP_RAY_RIGHT,true); ObjectSetInteger(0,"TL_Support",OBJPROP_COLOR,Support_Color); ObjectSetInteger(0,"TL_Support",OBJPROP_STYLE,Support_Style); ObjectSetInteger(0,"TL_Support",OBJPROP_WIDTH,Support_Width); //--- creating the resistance line ObjectCreate(0,"TL_Resistance",OBJ_TREND,0,High_2_15_time[Max_M15_2],High_2_15[Max_M15_2],High_1_15_time[Max_M15_1],High_1_15[Max_M15_1]); ObjectSetInteger(0,"TL_Resistance",OBJPROP_RAY_RIGHT,true); ObjectSetInteger(0,"TL_Resistance",OBJPROP_COLOR,Resistance_Color); ObjectSetInteger(0,"TL_Resistance",OBJPROP_STYLE,Resistance_Style); ObjectSetInteger(0,"TL_Resistance",OBJPROP_WIDTH,Resistance_Width); |
私は必要なラインを作成し、入力パラメータを基にそのパラメータを指定しました。
ここで必要なのでトレンドラインの描画を実装することです。
マーケット状況が変化すると、たとえば新たな端点が出現すると、既存のラインをただ消去します。
| MQL4 |
|---|
//--- redrawing the support line //--- writing the values of the support line time coordinates into the variables datetime TL_TimeLow2=ObjectGet("TL_Support",OBJPROP_TIME2); datetime TL_TimeLow1=ObjectGet("TL_Support",OBJPROP_TIME1); //--- if the line coordinates don't match the current coordinates if(TL_TimeLow2!=LowestBarTime_1_m15 && TL_TimeLow1!=LowestBarTime_2_m15) { //--- remove the line ObjectDelete(0,"TL_Support"); } //--- redrawing the resistance line //--- writing the values of the resistance line time coordinates into the variables datetime TL_TimeUp2=ObjectGet("TL_Resistance",OBJPROP_TIME2); datetime TL_TimeUp1=ObjectGet("TL_Resistance",OBJPROP_TIME1); //--- if the line coordinates don't match the current coordinates if(TL_TimeUp2!=HighestBarTime_1_m15 && TL_TimeUp1!=HighestBarTime_2_m15) { //--- remove the line ObjectDelete(0,"TL_Resistance"); } |
| MQL5 |
|---|
//--- redrawing the support line //--- writing the values of the support line time coordinates into the variables datetime TL_TimeLow2=(datetime)ObjectGetInteger(0,"TL_Support",OBJPROP_TIME,0); datetime TL_TimeLow1=(datetime)ObjectGetInteger(0,"TL_Support",OBJPROP_TIME,1); //--- if the line coordinates don't match the current coordinates if(TL_TimeLow2!=Low_2_15_time[Min_M15_2] && TL_TimeLow1!=Low_1_15_time[Min_M15_1]) { //--- remove the line ObjectDelete(0,"TL_Support"); } //--- redrawing the resistance line //--- writing the values of the resistance line time coordinates into the variables datetime TL_TimeUp2=(datetime)ObjectGetInteger(0,"TL_Resistance",OBJPROP_TIME,0); datetime TL_TimeUp1=(datetime)ObjectGetInteger(0,"TL_Resistance",OBJPROP_TIME,1); //--- if the line coordinates don't match the current coordinates if(TL_TimeUp2!=High_2_15_time[Max_M15_2] && TL_TimeUp1!=High_1_15_time[Max_M15_1]) { //--- remove the line ObjectDelete(0,"TL_Resistance"); } |
5. バー履歴ロードの確認
検証中、私はラインがかならずしも正しく描かれないことに気づきました。
まず、私が思ったのは、コードにバグがあるか、私のソリューションがまったく役にたっていないのか、ということでしたが、それから問題は小さなタイムフレームにバー履歴が十分ロードされていないことが原因であると解りました。私の場合このタイムフレームは15分でした。この問題について読者の方に警告するため、私はバーが M15 に存在するかどうかの確認を追加でプログラムすることにしました。
このため MQL4 ではセクション 『フラクタルの価格と時刻値決定』でもともと使った iBarShift() 関数の機能を利用しました。
バーがみつからなければ、iBarShift() 関数は -1 を返します。それでこの警告を出力します。
| MQL4 |
|---|
//--- checking the bars history loading //--- if at least one bar is not found on M15 if(UpperFractal_1_m15==-1 || UpperFractal_2_m15==-1 || LowerFractal_1_m15==-1 || LowerFractal_2_m15==-1) { Alert("The loaded history is insufficient for the correct work!"); } |
MQL5 では、時系列データがターミナルに生成されていなければ空の値を返す Bars()関数を使用しました。
//--- checking the bars history loading //--- 1. determining the number of bars on a specified timeframe int High_M15_1=Bars(Symbol(),PERIOD_M15,UpFractalTime_1[0],UpFractalTime_1_15); int High_M15_2=Bars(Symbol(),PERIOD_M15,UpFractalTime_2[0],UpFractalTime_2_15); int Low_M15_1=Bars(Symbol(),PERIOD_M15,LowFractalTime_1[0],LowFractalTime_1_15); int Low_M15_2=Bars(Symbol(),PERIOD_M15,LowFractalTime_2[0],LowFractalTime_2_15); //--- 2. check if the loaded history is insufficient for the correct line drawing //--- if at least one bar is not found if(High_M15_1==0 || High_M15_2==0 || Low_M15_1==0 || Low_M15_2==0) { Alert("The loaded history is insufficient for the correct work!"); } |
6. トレンドラインブレークスルーのシグナル、プッシュ通知
画像を完了するのに、私はトレンドラインのブレークスルーのシグナルを実装することにしました。トレンドラインは日足のタイムフレームの端点によってプロットされますが、もっと前のブレークスルーを特定するにはバーは H4 のトレンドラインより低いか高いかでクローズされる必要があります。
一般的にはこのプロセスを3ステップに分けることできます。
- バーの終値とトレンドライン価格を決める。
- 価格がトレンドラインを突破する条件を決める。
- ブレークスルーについてのプッシュ通紙を送信する。
| MQL4 |
|---|
// 1. トレンドラインの価格パラメータ取得 //--- determining the closing price of a bar with index 1 double Price_Close_H4=iClose(NULL,240,1); //--- determining the time of a bar with index 1 datetime Time_Close_H4=iTime(NULL,240,1); //--- determining the bar index on H4 int Bar_Close_H4=iBarShift(NULL,240,Time_Close_H4); //--- determining the price of the line on H4 double Price_Resistance_H4=ObjectGetValueByShift("TL_Resistance",Bar_Close_H4); //--- determining the price of the line on H4 double Price_Support_H4=ObjectGetValueByShift("TL_Support",Bar_Close_H4); |
// 2. トレンドラインブレークスルーの条件 //--- for breaking through the support line bool breakdown=(Price_Close_H4<Price_Support_H4); //--- for braking through the resistance line bool breakup=(Price_Close_H4>Price_Resistance_H4); |
// 3. プッシュ通知の配信 if(breakdown==true) { //--- send no more than one notification per 4 hours int SleepMinutes=240; static int LastTime=0; if(TimeCurrent()>LastTime+SleepMinutes*60) { LastTime=TimeCurrent(); SendNotification(Symbol()+"The price has broken through the support line"); } } if(breakup==true) { //--- send no more than one notification per 4 hours SleepMinutes=240; LastTime=0; if(TimeCurrent()>LastTime+SleepMinutes*60) { LastTime=TimeCurrent(); SendNotification(Symbol()+"The price has broken through the resistance line"); } } |
| MQL5 |
|---|
// 1. トレンドラインの価格パラメータ取得 double Close[]; CopyClose(Symbol(),PERIOD_H4,TimeCurrent(),10,Close); //--- setting the array indexing order ArraySetAsSeries(Close,true); //--- datetime Close_time[]; CopyTime(Symbol(),PERIOD_H4,TimeCurrent(),10,Close_time); //--- setting the array indexing order ArraySetAsSeries(Close_time,true); //--- double Price_Support_H4=ObjectGetValueByTime(0,"TL_Support",Close_time[1]); double Price_Resistance_H4=ObjectGetValueByTime(0,"TL_Resistance",Close_time[1]); |
// 2. トレンドラインブレークスルーの条件 bool breakdown=(Close[1]<Price_Support_H4); bool breakup=(Close[1]>Price_Resistance_H4); |
ブレークスルーを特定するために、私は MQL4 ではObjectGetValueByShift() 関数を、MQL5ではObjectGetValueByTime() 関数を使用しました。
おそらく ObjectGetValueByShift()のパラメータとしてBar_Close_H4 の代わりに単に1を設定することもできたでしょうが、まずにおけるインデックスを決定することに決めました。このフォーラムスレッドに発表される送信済みメッセージ数を限定するためのソリューションを使用し、著者のみなさんに感謝を述べたいと思います。
7. トレーディングにおけるトレンドラインの実用的利用
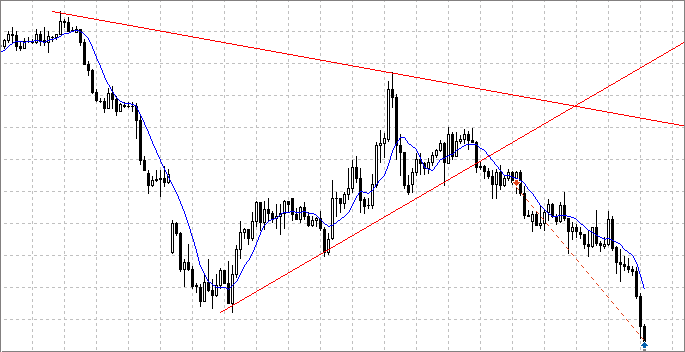
もっともシンプルな方法:ブレークスルーを特定し、プルバックを待ってその後マーケットにエンターする。
自走的には以下のようなものを取得します。

図3 トレンドラインブレークスルー
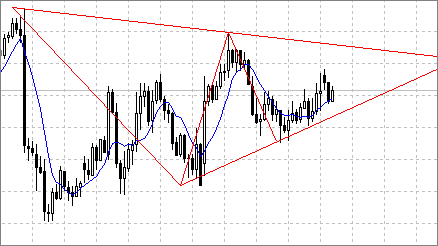
ご自身のイマジネーションを駆使して編成、すなわち、テクニカル分析のパターン、たとえば三角形など、を特定してみてください。

図4 三角形パターン
ラインは上の画像では小さなタイムフレームでははっきりしませんでした。.
おわりに
これで本稿は締めくくりです。みなさんが本稿を有用であると思われることを願っております。本稿はプログラミングの初心者、私のようなアマチュアを対象としています。
私は本稿執筆中に多くのことを学びました。まず、より意味のあるコードのコメントを付け始めました。次に、最初、端点を明確にするためにもっと面倒で複雑なソリューションを採用していましたが、その後本稿内でご披露したようなシンプルなソリューションを思いつきました。
お読みいただきありがとうございました。フィードバックは大歓迎です。
MetaQuotes Ltdによってロシア語から翻訳されました。
元の記事: https://www.mql5.com/ru/articles/1201
警告: これらの資料についてのすべての権利はMetaQuotes Ltd.が保有しています。これらの資料の全部または一部の複製や再プリントは禁じられています。
この記事はサイトのユーザーによって執筆されたものであり、著者の個人的な見解を反映しています。MetaQuotes Ltdは、提示された情報の正確性や、記載されているソリューション、戦略、または推奨事項の使用によって生じたいかなる結果についても責任を負いません。
 リキッドチャート
 MQL5 クックブック:BookEvent の処理
 MQL5 プログラミングの基礎:ターミナルのグローバル変数
 MetaTrader 4 と MetaTrader 5 の仮想ホスティングが通常の VPS より優れている理由
- 無料取引アプリ
- 8千を超えるシグナルをコピー
- 金融ニュースで金融マーケットを探索
こんにちは - コーディングのすべてを理解したふりはできませんが、まさに私が自分でコーディングしようとしていたことをやってくれているので、何とかやっています(ひどく初心者ですが)。
私はEAを再作成し、MQL4にうまく適合させました。最初の初期化でサポートラインとレジスタンスラインを引き、通知を送りますが、新しい極端なポイントフラクタルが現れたときに新しいサポートラインとレジスタンスラインを再描画しません。何か見落としていることがあるのでしょうか?
また、フラクタルをチャートに表示させることはできませんでしたが、ストラテジーテスターで EAをテストすると、テストを停止した後、フラクタルは正しく表示されました。また何か見落としているのでしょうか?
ところで、フラクタルと極端なポイントに対するトレンドラインは、コード化することはおろか、説明することも簡単ではありません。)
よろしく
アンディ
最初の質問について:新しいトレンドラインが再描画されない場合、作成されたオブジェクトを削除するコードを使用していない可能性があります。記事の4番目を見てください。二つ目の質問について:フラクタルを含む新しいテンプレートをテスター用に作成し、それを "tester.tpl "と呼ぶことができます。その後、testerを使用すると、常にフラクタルをチャート上に表示することができます。
最初の質問について:もし新しいトレンドラインが再描画されないのであれば、作成されたオブジェクトを削除するコードを使用していないのかもしれません。記事の4番目の部分を見てください。二つ目の質問について:フラクタルを含む新しいテンプレートをテスター用に作成し、それを "tester.tpl "と呼ぶことができます。その後、testerを使用すると、常にフラクタルをチャート上に表示することができます。
回答ありがとうございます。一晩中EAを2つのチャート(1x 4hrチャートと1x 15m=Mチャート)にアタッチしたままにしておいたのですが、再描画されてしまいました。
tester.plに関する情報ありがとうございます。
ありがとうございました。
テスターで線を引くのを正しく動作させ、それらが時間内の最初のポイントに固執しないようにするには、トレンドラインの作成の上に下から線の制御を置く必要があります。
記事をありがとうございました。アイデアを検討し、私のEAに適応させようと思います。
いつもありがとうございます、そして良い取引を。
Expert Advisorとしても、MQL4のインジケーターとしても、全く兆候を示しません!!!!!!!!!!!!!!!!!!!!!!!!!!!!!!!!!!!!!!!!!!!!評価を上げるためだけに、何でもかんでもたくさんアップロードするのがそんなに楽しいのでしょうか?
初期化後にOnTick関数を追加して、週末や一般的に新しい価格が来たときではなく、チャートに貼り付けたらすぐに動くようにしましょう。