MQL4 ve MQL5 kullanarak fraktallara dayalı trend çizgileri çizme
İçerik Tablosu
- Giriş
- 1. Girdi parametreleri, DeInit() işlevi ve değişkenlerin ilk bildirimi
- 2. En yakın fraktalları arama
- 3. Fraktalların fiyat ve zaman değerlerinin belirlenmesi
- 4. Nesneleri oluşturma ve özelliklerini düzenleme. Çizgileri yeniden çizme
- 5. Çubuk geçmişi yüklemesini kontrol etme
- 6. Trend çizgileri fiyat rekorları sinyalleri, anlık bildirimler
- 7. Trend çizgilerinin alım satım işlemlerinde pratik kullanımı
- Sonuç
Giriş
Son zamanlarda trend çizgilerini kullanmayı düşünüyorum. Çizgileri çizerken noktaları belirleme yöntemi seçme ve ayrıca çizim doğruluğu hakkında soru işareti vardı. Fraktalları bir temel olarak kullanmaya karar verdim.
Alım satım işlemlerine biraz zaman ayırabildiğim asıl işimde piyasaları sıklıkla analiz ederim. Ayrıca çizgileri yalnızca daha geniş bir zaman diliminde çizemezsiniz - çizgi, 15 dakikaya kadar olan doğrulukla uç noktalar ile çizilmelidir. Bunun nedeni, daha büyük bir zaman dilimindeki fraktal zamanın M15'teki aynı uç noktanın zamanı ile her zaman eşleşmemesidir. Kısacası, otomasyonun yardımcı olduğu yer burasıdır. MQL5 kullanarak kodu yazmaya başladım ve ardından MQL4'e geçtim çünkü MetaTrader 4 için bu programa ihtiyacım vardı.
Bu makalede, MQL4 ve MQL5 kullanarak problem çözme yöntemimi sundum. Makale karşılaştırmalı bir görünüm sağlar, ancak burada MQL4 ve MQL5'in verimliliğini karşılaştırmak uygun olmaz. Ayrıca muhtemelen benimkinden daha etkili başka çözümler olabilmesini de anlayabilirim. Makale, MQL4 veya MQL5 kullanarak script yazmaya yeni başlayanlar, özellikle fraktallar ve trend çizgilerini kullanmayı planlayanlar için yararlı olabilir.
1. Girdi parametreleri, DeInit() işlevi ve değişkenlerin ilk bildirimi
Aşağıdaki değişkenleri girdi parametreleri olarak kullandım:
input color Resistance_Color=Red;       // setting the resistance line color
input ENUM_LINE_STYLE Resistance_Style; // setting the resistance line style
input int Resistance_Width=1;           // setting the resistance line width
input color Support_Color=Red;          // setting the support line color
input ENUM_LINE_STYLE Support_Style;    // setting the support line style
input int Support_Width=1;              // setting the support line width
Bu parametreler MQL4 ve MQL5 için aynıdır.
MQL5'teki göstergeyi önceden oluşturmamız gereklidir:
//--- iFractals indicator handle
int Fractal;
//+------------------------------------------------------------------+
//| Expert initialization function                                   |
//+------------------------------------------------------------------+
int OnInit()
  {
//--- getting the iFractals indicator handle
   Fractal=iFractals(Symbol(),PERIOD_D1);
//---
   return(INIT_SUCCEEDED);
  }
Program grafik nesneler çizeceği için, bunları Expert Advisor grafikten çıkarılırken kaldırmak mantıklıdır:
void OnDeinit(const int reason)
  {
   ObjectDelete(0,"TL_Resistance");
   ObjectDelete(0,"TL_Support");
  }
İki çizgi (destek ve direnç) çizmek için dört nokta gerekir. Çizgi geçiş noktasını belirlemek için zamanı ve fiyatı bilmemiz gerekir.
Koordinatlar şu sırayla belirlenir: ilk önce uç çubuğu buluruz, uç çubuğu bulursak, uç noktanın fiyatını ve zamanını belirleyebiliriz.
OnTick() işlevindeki değişkenleri bildirme:
| MQL4 |
|---|
//--- declaration of variables int n,UpperFractal_1,UpperFractal_2,LowerFractal_1,LowerFractal_2; |
| MQL5 |
|---|
//--- declaration of variables int n,UpperFractal_1,UpperFractal_2,LowerFractal_1,LowerFractal_2; //--- declaring the arrays for writing values of the iFractal indicator buffer double FractalDown[],FractalUp[]; double UpFractal_1,UpFractal_2,LowFractal_1,LowFractal_2; |
İlk önce, çubuk endekslerini yalnızca biçimlendirilmiş fraktallarla saklayan değişkenleri bildirdim.
MQL4'te:
- döngü operatörü kullanılarak bilinen en yakın fraktalı bulmak için n - değişkeni gerekmektedir;
- UpperFractal_1, UpperFractal_2, LowerFractal_1, LowerFractal_2 - bu değişkenler çubuğun endeksini en yüksek/en düşük fiyatla, (fraktalları belirleme açısından) birinci ve ikinci en yakın uç noktada saklayacaktır;
MQL5'te ek değişkenler sunarız:
- FractalDown[],FractalUp[]; - iFractals gösterge arabelleği değerlerini depolamak için çift değerli diziler bildirme;
- Ardından, çift tür değişkenler: UpFractal_1,UpFractal_2,LowFractal_1,LowFractal_2. Bunlar uç noktaların fiyat değerlerini depolayacaklar.
2. En yakın fraktalları arama
Biçimli bir fraktal içeren çubuğun endeksini bulmak için döngü operatörünü kullanırız.
Birinci ve ikinci üst fraktala karşılık gelen ilk iki çubuğun endekslerini belirleyelim:
| MQL4 |
|---|
//--- finding the bar index of the first nearest upper fractal for(n=0; n<(Bars-1);n++) { if(iFractals(NULL,1440,MODE_UPPER,n)!=NULL) break; UpperFractal_1=n+1; } //--- finding the bar index of the second nearest upper fractal for(n=UpperFractal_1+1; n<(Bars-1);n++) { if(iFractals(NULL,1440,MODE_UPPER,n)!=NULL) break; UpperFractal_2=n+1; } |
| MQL5 |
|---|
//--- first, we need to write the Fractal indicator buffer values into the arrays //--- filling arrays with buffer values CopyBuffer(Fractal,0,TimeCurrent(),Bars(Symbol(),PERIOD_D1),FractalUp); CopyBuffer(Fractal,1,TimeCurrent(),Bars(Symbol(),PERIOD_D1),FractalDown); //--- indexing like in timeseries ArraySetAsSeries(FractalUp,true); ArraySetAsSeries(FractalDown,true); //--- next, we use the for loop operator to find the first upper fractal for(n=0; n<Bars(Symbol(),PERIOD_D1); n++) { //--- if the value is not empty, break the loop if(FractalUp[n]!=EMPTY_VALUE) break; } //--- writing the price value of the first fractal into the variable UpFractal_1=FractalUp[n]; //--- writing the index of the first fractal into the variable UpperFractal_1=n; //--- finding the second upper fractal for(n=UpperFractal_1+1; n<Bars(Symbol(),PERIOD_D1); n++) { if(FractalUp[n]!=EMPTY_VALUE) //if the value is not empty, break the loop break; } //--- writing the price value of the second fractal into the variable UpFractal_2=FractalUp[n]; //--- writing the index of the second fractal into the variable UpperFractal_2=n; |
Burada MQL5 ve MQL4 arasındaki temel farklardan biri olan - zaman serilerine erişim işlevlerini kullanmayı, açıkça gösterdim.
MQL4'te oluşturulmuş bir fraktal ile çubuğun endeksini hemen bulmaya başladım ancak MQL5'te CopyBuffer() işlevine sahip iFractals göstergesine erişerek üst ve alt fraktalların fiyat değerlerini depolamak için FractalUp[] ve FractalDown[] dizilerini belirledim. Daha sonra bu dizilerin endekslenmesini, ArraySetAsSeries() işlevini kullanarak zaman serilerindeki gibi ayarladım.
MQL4'te yalnızca bilinen fraktallara sahip çubuk endekslerini aldım ancak MQL5'teki çubuk endekslerini ve fraktalların fiyat değerlerini almak için CopyBuffer() işlevini kullandım.
Benzer şekilde, ilk iki alt fraktal buluruz:
| MQL4 |
|---|
//--- finding the bar index of the first nearest lower fractal for(n=0; n<(Bars-1);n++) { if(iFractals(NULL,1440,MODE_LOWER,n)!=NULL) break; LowerFractal_1=n+1; } //--- finding the bar index of the second nearest lower fractal for(n=LowerFractal_1+1; n<(Bars-1);n++) { if(iFractals(NULL,1440,MODE_LOWER,n)!=NULL) break; LowerFractal_2=n+1; } |
| MQL5 |
|---|
//--- finding the values of the lower fractals //--- finding the first lower fractal for(n=0; n<Bars(Symbol(),PERIOD_D1); n++) { //--- if the value is not empty, break the loop if(FractalDown[n]!=EMPTY_VALUE) break; } //--- writing the price value of the first fractal into the variable LowFractal_1=FractalDown[n]; //--- writing the index of the first fractal into the variable LowerFractal_1=n; //--- finding the second lower fractal for(n=LowerFractal_1+1; n<Bars(Symbol(),PERIOD_D1); n++) { if(FractalDown[n]!=EMPTY_VALUE) break; } //--- writing the price value of the second fractal into the variable LowFractal_2=FractalDown[n]; //--- writing the index of the second fractal into the variable LowerFractal_2=n; |
Gördüğünüz gibi, MQL4 ve MQL5'teki koda çok benzer. Sözdiziminde küçük bir fark vardır.
3. Fraktalların fiyat ve zaman değerlerinin belirlenmesi
Çizgi çizmek için fraktalın zamanını ve fiyatını belirlememiz gerekilidir. Tabii ki, MQL4'teki Yüksek[] ve Düşük[] önceden tanımlanmış zaman serilerini ve iTime() işlevini kullanabilirdik ancak aynı zamanda trend çizgisinin doğru çizmek için daha kesin zaman koordinatları almamız gereklidir.
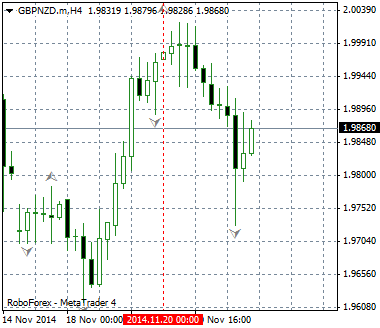
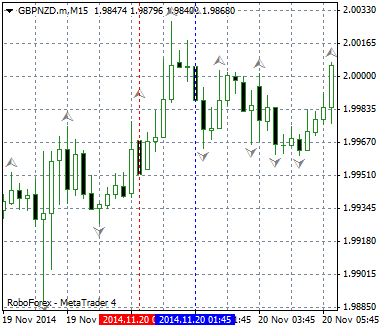
Şekil 1-2, H4 ve M15 zaman dilimlerindeki uç noktaların zaman değerleri arasındaki farkı göstermektedir.

Şek.1. H4'teki uç nokta zaman değeri

Şek.2. M15'teki uç nokta zaman değeri
15 dakikalık uç nokta doğruluğunun amaçlarım için oldukça yeterli olduğu sonucuna vardım.
Genel olarak, uç nokta açıklama prensibi hem MQL4 hem de MQL5 için hemen hemen aynıdır, ancak ayrıntılarda belirli farklılıklar vardır:
| MQL4 | MQL5 |
|---|---|
|
|
Her adım kodu aşağıda gösterilmiştir:
| MQL4 |
|---|
// Step 1. Determining the extreme point time value on a larger timeframe: //--- determining the time of fractals datetime UpFractalTime_1=iTime(NULL, 1440,UpperFractal_1); datetime UpFractalTime_2=iTime(NULL, 1440,UpperFractal_2); datetime LowFractalTime_1=iTime(NULL, 1440,LowerFractal_1); datetime LowFractalTime_2=iTime(NULL, 1440,LowerFractal_2); |
// Step 2. Determining the index of the extreme bar on a smaller timeframe: //--- finding the fractal index on M15 int UpperFractal_1_m15=iBarShift(NULL, 15, UpFractalTime_1,true); int UpperFractal_2_m15=iBarShift(NULL, 15, UpFractalTime_2,true); int LowerFractal_1_m15=iBarShift(NULL, 15, LowFractalTime_1,true); int LowerFractal_2_m15=iBarShift(NULL, 15, LowFractalTime_2,true); |
// Step 3. Using the arrays to find the clarified extreme points on М15: //--- using the arrays to find the clarified extreme points //--- introducing the i variable to use in the for loop operator int i; //--- 1. First, find the lower extreme points //--- 3.1 Finding the first lower extreme point //--- declaring the array for storing the index values of the bars int Lower_1_m15[96]; //--- declaring the array for storing the price values double LowerPrice_1_m15[96]; //--- starting the for loop: for(i=0;i<=95;i++) { //--- filling the array with the bar index values Lower_1_m15[i]=LowerFractal_1_m15-i; //--- filling the array with the price values LowerPrice_1_m15[i]=iLow(NULL,15,LowerFractal_1_m15-i); } //--- determining the minimum price value in the array int LowestPrice_1_m15=ArrayMinimum(LowerPrice_1_m15,WHOLE_ARRAY,0); //--- determining the bar with the lowest price in the array int LowestBar_1_m15=Lower_1_m15[LowestPrice_1_m15]; //--- determining the time of the lowest price bar datetime LowestBarTime_1_m15=iTime(NULL,15,Lower_1_m15[LowestPrice_1_m15]); //--- 3.2 Finding the second lower extreme point int Lower_2_m15[96]; double LowerPrice_2_m15[96]; for(i=0;i<=95;i++) { //--- filling the array with the bar index values Lower_2_m15[i]=LowerFractal_2_m15-i; //--- filling the array with the price values LowerPrice_2_m15[i]=iLow(NULL,15,LowerFractal_2_m15-i); } //--- determining the minimum price value in the array int LowestPrice_2_m15=ArrayMinimum(LowerPrice_2_m15,WHOLE_ARRAY,0); //--- determining the bar with the lowest price in the array int LowestBar_2_m15=Lower_2_m15[LowestPrice_2_m15]; //--- determining the time of the lowest price bar datetime LowestBarTime_2_m15=iTime(NULL,15,Lower_2_m15[LowestPrice_2_m15]); //--- 3.3 Finding the first upper extreme point int Upper_1_m15[96]; double UpperPrice_1_m15[96]; for(i=0;i<=95;i++) { //--- filling the array with the bar index values Upper_1_m15[i]=UpperFractal_1_m15-i; //--- filling the array with the price values UpperPrice_1_m15[i]=iHigh(NULL,15,UpperFractal_1_m15-i); } //--- determining the maximum price value in the array int HighestPrice_1_m15=ArrayMaximum(UpperPrice_1_m15,WHOLE_ARRAY,0); //--- determining the bar with the highest price in the array int HighestBar_1_m15=Upper_1_m15[HighestPrice_1_m15]; //--- determining the time of the highest price bar datetime HighestBarTime_1_m15=iTime(NULL,15,Upper_1_m15[HighestPrice_1_m15]); //--- 3.4 Finding the second upper extreme point int Upper_2_m15[96]; double UpperPrice_2_m15[96]; for(i=0;i<=95;i++) { //--- filling the array with the bar index values Upper_2_m15[i]=UpperFractal_2_m15-i; //--- filling the array with the price values UpperPrice_2_m15[i]=iHigh(NULL,15,UpperFractal_2_m15-i); } |
| MQL5 |
|---|
// Step 1. Determining the extreme point time value on a larger timeframe: //--- declaring the arrays for storing the time values of the corresponding bar index on a larger timeframe datetime UpFractalTime_1[],LowFractalTime_1[],UpFractalTime_2[],LowFractalTime_2[]; //--- determining the time of fractals on a larger timeframe CopyTime(Symbol(),PERIOD_D1,UpperFractal_1,1,UpFractalTime_1); CopyTime(Symbol(),PERIOD_D1,LowerFractal_1,1,LowFractalTime_1); CopyTime(Symbol(),PERIOD_D1,UpperFractal_2,1,UpFractalTime_2); CopyTime(Symbol(),PERIOD_D1,LowerFractal_2,1,LowFractalTime_2); |
// Step 2. Determining the generation time of the next day bar: //--- determining the generation time of the next day bar (the stop time for CopyHigh(), CopyLow() and CopyTime()) datetime UpFractalTime_1_15=UpFractalTime_1[0]+86400; datetime UpFractalTime_2_15=UpFractalTime_2[0]+86400; datetime LowFractalTime_1_15=LowFractalTime_1[0]+86400; datetime LowFractalTime_2_15=LowFractalTime_2[0]+86400; |
// Step 3. Declaring and filling the arrays for storing the price and time values for the 15-minute timeframe: //--- declaring the arrays for storing the maximum and minimum price values double High_1_15[],Low_1_15[],High_2_15[],Low_2_15[]; //--- filling the arrays with the CopyHigh() and CopyLow() functions CopyHigh(Symbol(),PERIOD_M15,UpFractalTime_1[0],UpFractalTime_1_15,High_1_15); CopyHigh(Symbol(),PERIOD_M15,UpFractalTime_2[0],UpFractalTime_2_15,High_2_15); CopyLow(Symbol(),PERIOD_M15,LowFractalTime_1[0],LowFractalTime_1_15,Low_1_15); CopyLow(Symbol(),PERIOD_M15,LowFractalTime_2[0],LowFractalTime_2_15,Low_2_15); //--- declaring the arrays for storing the time values corresponding to the extreme bar indexes datetime High_1_15_time[],High_2_15_time[],Low_1_15_time[],Low_2_15_time[]; //--- filling the arrays CopyTime(Symbol(),PERIOD_M15,UpFractalTime_1[0],UpFractalTime_1_15,High_1_15_time); CopyTime(Symbol(),PERIOD_M15,UpFractalTime_2[0],UpFractalTime_2_15,High_2_15_time); CopyTime(Symbol(),PERIOD_M15,LowFractalTime_1[0],LowFractalTime_1_15,Low_1_15_time); CopyTime(Symbol(),PERIOD_M15,LowFractalTime_2[0],LowFractalTime_2_15,Low_2_15_time); |
// Step 4. Finding the lowest and highest price values, and the time values of the clarified extreme points: //--- determining the highest and lowest price and time values with the ArrayMaximum() and ArrayMinimum() functions int Max_M15_1=ArrayMaximum(High_1_15,0,96); int Max_M15_2=ArrayMaximum(High_2_15,0,96); int Min_M15_1=ArrayMinimum(Low_1_15,0,96); int Min_M15_2=ArrayMinimum(Low_2_15,0,96); |
Aşağıda en sonda, trend çizgisi koordinatlarını belirttik:
1. Destek çizgisi için:
| MQL4 | MQL5 |
|---|---|
|
|
2. Direnç çizgisi için:
| MQL4 | MQL5 |
|---|---|
|
|
4. Nesneleri oluşturma ve özelliklerini düzenleme. Çizgileri yeniden çizme
Şimdi çizgi koordinatlarını bildiğimize göre, sadece grafik nesneleri oluşturmamız gereklidir:
| MQL4 |
|---|
//--- creating the support line ObjectCreate(0,"TL_Support",OBJ_TREND,0,LowestBarTime_2_m15,LowerPrice_2_m15[LowestPrice_2_m15], LowestBarTime_1_m15,LowerPrice_1_m15[LowestPrice_1_m15]); ObjectSet("TL_Support",OBJPROP_COLOR,Support_Color); ObjectSet("TL_Support",OBJPROP_STYLE,Support_Style); ObjectSet("TL_Support",OBJPROP_WIDTH,Support_Width); //--- creating the resistance line ObjectCreate(0,"TL_Resistance",OBJ_TREND,0,HighestBarTime_2_m15,UpperPrice_2_m15[HighestPrice_2_m15], HighestBarTime_1_m15,UpperPrice_1_m15[HighestPrice_1_m15]); ObjectSet("TL_Resistance",OBJPROP_COLOR,Resistance_Color); ObjectSet("TL_Resistance",OBJPROP_STYLE,Resistance_Style); ObjectSet("TL_Resistance",OBJPROP_WIDTH,Resistance_Width); |
| MQL5 |
|---|
//--- creating the support line ObjectCreate(0,"TL_Support",OBJ_TREND,0,Low_2_15_time[Min_M15_2],Low_2_15[Min_M15_2],Low_1_15_time[Min_M15_1],Low_1_15[Min_M15_1]); ObjectSetInteger(0,"TL_Support",OBJPROP_RAY_RIGHT,true); ObjectSetInteger(0,"TL_Support",OBJPROP_COLOR,Support_Color); ObjectSetInteger(0,"TL_Support",OBJPROP_STYLE,Support_Style); ObjectSetInteger(0,"TL_Support",OBJPROP_WIDTH,Support_Width); //--- creating the resistance line ObjectCreate(0,"TL_Resistance",OBJ_TREND,0,High_2_15_time[Max_M15_2],High_2_15[Max_M15_2],High_1_15_time[Max_M15_1],High_1_15[Max_M15_1]); ObjectSetInteger(0,"TL_Resistance",OBJPROP_RAY_RIGHT,true); ObjectSetInteger(0,"TL_Resistance",OBJPROP_COLOR,Resistance_Color); ObjectSetInteger(0,"TL_Resistance",OBJPROP_STYLE,Resistance_Style); ObjectSetInteger(0,"TL_Resistance",OBJPROP_WIDTH,Resistance_Width); |
Bu yüzden gerekli satırları oluşturdum ve giriş parametrelerine göre parametrelerini belirledim.
Şimdi trend çizgilerinin yeniden çizilmesini uygulamamız gerekiyor.
Piyasa durumu değiştiğinde, örneğin yeni bir uç nokta göründüğünde, mevcut çizgiyi kaldırabiliriz:
| MQL4 |
|---|
//--- redrawing the support line //--- writing the values of the support line time coordinates into the variables datetime TL_TimeLow2=ObjectGet("TL_Support",OBJPROP_TIME2); datetime TL_TimeLow1=ObjectGet("TL_Support",OBJPROP_TIME1); //--- if the line coordinates don't match the current coordinates if(TL_TimeLow2!=LowestBarTime_1_m15 && TL_TimeLow1!=LowestBarTime_2_m15) { //--- remove the line ObjectDelete(0,"TL_Support"); } //--- redrawing the resistance line //--- writing the values of the resistance line time coordinates into the variables datetime TL_TimeUp2=ObjectGet("TL_Resistance",OBJPROP_TIME2); datetime TL_TimeUp1=ObjectGet("TL_Resistance",OBJPROP_TIME1); //--- if the line coordinates don't match the current coordinates if(TL_TimeUp2!=HighestBarTime_1_m15 && TL_TimeUp1!=HighestBarTime_2_m15) { //--- remove the line ObjectDelete(0,"TL_Resistance"); } |
| MQL5 |
|---|
//--- redrawing the support line //--- writing the values of the support line time coordinates into the variables datetime TL_TimeLow2=(datetime)ObjectGetInteger(0,"TL_Support",OBJPROP_TIME,0); datetime TL_TimeLow1=(datetime)ObjectGetInteger(0,"TL_Support",OBJPROP_TIME,1); //--- if the line coordinates don't match the current coordinates if(TL_TimeLow2!=Low_2_15_time[Min_M15_2] && TL_TimeLow1!=Low_1_15_time[Min_M15_1]) { //--- remove the line ObjectDelete(0,"TL_Support"); } //--- redrawing the resistance line //--- writing the values of the resistance line time coordinates into the variables datetime TL_TimeUp2=(datetime)ObjectGetInteger(0,"TL_Resistance",OBJPROP_TIME,0); datetime TL_TimeUp1=(datetime)ObjectGetInteger(0,"TL_Resistance",OBJPROP_TIME,1); //--- if the line coordinates don't match the current coordinates if(TL_TimeUp2!=High_2_15_time[Max_M15_2] && TL_TimeUp1!=High_1_15_time[Max_M15_1]) { //--- remove the line ObjectDelete(0,"TL_Resistance"); } |
5. Çubuk geçmişi yüklenmesini kontrol etme
Test sırasında, çizgilerin her zaman doğru şekilde çizilmediğini fark ettim.
İlk başta, kodda bir bag olduğunu veya çözümümün hiç işe yaramadığını düşündüm ancak daha sonra sorunun, benim durumumda M15 olan daha küçük bir zaman diliminde çubuk geçmişinin yetersiz yüklenmesinden kaynaklandığını fark ettim. Kullanıcıyı bu konularda uyarmak için ayrıca, M15'te bir çubuk olup olmadığını progroma kontrol ettirmeye karar verdim.
Bu amaçla MQL4'teki, orijinal olarak "Fraktalların fiyat ve zaman değerlerinin belirlenmesi" bölümünde kullandığım iBarShift() işlev imkanlarını kullandım.
Çubuk bulunamazsa, iBarShift() işlevi -1 değerini dönüştürür. Bu nedenle, şu uyarıyı verebiliriz:
| MQL4 |
|---|
//--- checking the bars history loading //--- if at least one bar is not found on M15 if(UpperFractal_1_m15==-1 || UpperFractal_2_m15==-1 || LowerFractal_1_m15==-1 || LowerFractal_2_m15==-1) { Alert("The loaded history is insufficient for the correct work!"); } |
MQL5'teki zaman serisi verileri terminalde oluşturulmamışsa boş değeri dönüştüren Bars() işlevini kullanırım:
//--- checking the bars history loading //--- 1. determining the number of bars on a specified timeframe int High_M15_1=Bars(Symbol(),PERIOD_M15,UpFractalTime_1[0],UpFractalTime_1_15); int High_M15_2=Bars(Symbol(),PERIOD_M15,UpFractalTime_2[0],UpFractalTime_2_15); int Low_M15_1=Bars(Symbol(),PERIOD_M15,LowFractalTime_1[0],LowFractalTime_1_15); int Low_M15_2=Bars(Symbol(),PERIOD_M15,LowFractalTime_2[0],LowFractalTime_2_15); //--- 2. check if the loaded history is insufficient for the correct line drawing //--- if at least one bar is not found if(High_M15_1==0 || High_M15_2==0 || Low_M15_1==0 || Low_M15_2==0) { Alert("The loaded history is insufficient for the correct work!"); } |
6. Trend çizgileri fiyat rekorları sinyalleri, anlık bildirimler
Resmi tamamlamak için trend çizgisi fiyat rekoru sinyali uygulamaya karar verdim. Trend çizgisi, gün zaman dilimin uç noktaları boyunca çizilir ancak fiyat rekorunu daha erken belirlemek için çubuk, H4'teki trend çizgisinin altında veya üstünde kapatılmalıdır.
Genel olarak, süreci üç adıma ayırabiliriz:
- Çubuk kapanış fiyatını ve trend çizgisi fiyatını belirleyin;
- Fiyatın trend çizgisini geçtiği koşulları belirleyin;
- Fiyat rekoru hakkında anlık bildirim gönderin.
| MQL4 |
|---|
// 1. Getting the price parameters of the trend line //--- determining the closing price of a bar with index 1 double Price_Close_H4=iClose(NULL,240,1); //--- determining the time of a bar with index 1 datetime Time_Close_H4=iTime(NULL,240,1); //--- determining the bar index on H4 int Bar_Close_H4=iBarShift(NULL,240,Time_Close_H4); //--- determining the price of the line on H4 double Price_Resistance_H4=ObjectGetValueByShift("TL_Resistance",Bar_Close_H4); //--- determining the price of the line on H4 double Price_Support_H4=ObjectGetValueByShift("TL_Support",Bar_Close_H4); |
// 2. Conditions for trend line breakthroughs //--- for breaking through the support line bool breakdown=(Price_Close_H4<Price_Support_H4); //--- for braking through the resistance line bool breakup=(Price_Close_H4>Price_Resistance_H4); |
// 3. Delivering the push notifications if(breakdown==true) { //--- send no more than one notification per 4 hours int SleepMinutes=240; static int LastTime=0; if(TimeCurrent()>LastTime+SleepMinutes*60) { LastTime=TimeCurrent(); SendNotification(Symbol()+"The price has broken through the support line"); } } if(breakup==true) { //--- send no more than one notification per 4 hours SleepMinutes=240; LastTime=0; if(TimeCurrent()>LastTime+SleepMinutes*60) { LastTime=TimeCurrent(); SendNotification(Symbol()+"The price has broken through the resistance line"); } } |
| MQL5 |
|---|
// 1. Getting the price parameters of the trend line double Close[]; CopyClose(Symbol(),PERIOD_H4,TimeCurrent(),10,Close); //--- setting the array indexing order ArraySetAsSeries(Close,true); //--- datetime Close_time[]; CopyTime(Symbol(),PERIOD_H4,TimeCurrent(),10,Close_time); //--- setting the array indexing order ArraySetAsSeries(Close_time,true); //--- double Price_Support_H4=ObjectGetValueByTime(0,"TL_Support",Close_time[1]); double Price_Resistance_H4=ObjectGetValueByTime(0,"TL_Resistance",Close_time[1]); |
// 2. Conditions for trend line breakthroughs bool breakdown=(Close[1]<Price_Support_H4); bool breakup=(Close[1]>Price_Resistance_H4); |
// 3. Delivering the push notifications if(breakdown==true) { //--- send no more than one notification per 4 hours int SleepMinutes=240; static int LastTime=0; if(TimeCurrent()>LastTime+SleepMinutes*60) { LastTime=(int)TimeCurrent(); SendNotification(Symbol()+"The price has broken through the support line"); } } if(breakup==true) { //--- send no more than one notification per 4 hours int SleepMinutes=240; static int LastTime=0; if(TimeCurrent()>LastTime+SleepMinutes*60) { LastTime=(int)TimeCurrent(); SendNotification(Symbol()+"The price has broken through the resistance line"); } } |
Fiyat rekorunu belirlemek için MQL4'te ObjectGetValueByShift() işlevini ve MQL5'te ObjectGetValueByTime() işlevini kullandım.
Belki ObjectGetValueByShift() için parametre olarak Bar_Close_H4 yerine 1 ayarlayabilirdim, ancak önce H4'teki endeksi belirlemeye karar verdim. Çözümü, bu forum başlığında yayınlanan gönderilen mesajların sayısını sınırlamak için kullandım ve yazara çok teşekkür etmek istiyorum.
7. Trend çizgilerinin alım satım işlemlerinde pratik kullanımı
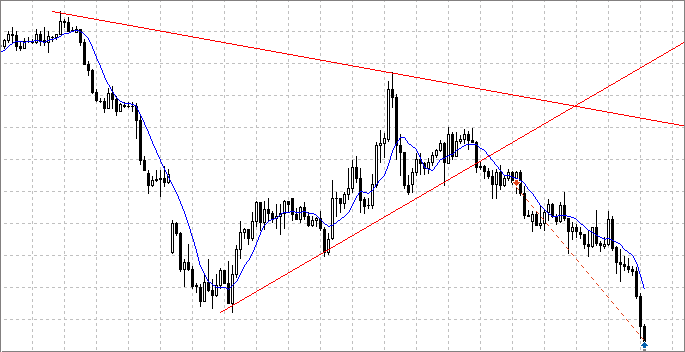
En basit yol: bir fiyat rekoru belirleyin, geri çekilip bekleyin ve ondan sonra piyasaya girin.
İdeal olarak, şöyle bir şey almalısınız:

Şek. 3. Trend çizgisi fiyat rekoru
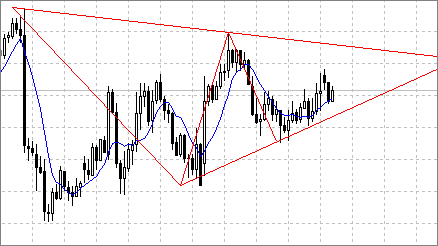
Daha sonra hayal gücünüzü kullanabilir ve biçimleri, yani üçgen gibi teknik analiz formasyonlarını belirlemeye çalışabilirsiniz:

Şek.4. Üçgen formasyonu
Yukarıdaki resimlerde, çizgiler daha küçük bir zaman dilimi ile netleştirilmemiştir.
Sonuç
Bu cümleyle makaleyi sonlandırıyoruz, umarım faydalı bulursunuz. Makale programlamaya yeni başlayanlar, benim gibi amatörler için tasarlandı.
Bu yazıyı yazarken çok şey öğrendim: öncelikle daha anlamlı kod yorumları yapmaya başladım; ikincisi, başlangıçta uç noktaların netleştirilmesi için daha külfetli ve karmaşık bir çözüm yöntemim vardı ancak daha sonra burada göstermiş olduğum daha basit çözümü buldum.
Okuduğunuz için teşekkür ederim, herhangi bir geri bildirim beni çok memnun eder.
MetaQuotes Ltd tarafından Rusçadan çevrilmiştir.
Orijinal makale: https://www.mql5.com/ru/articles/1201
Uyarı: Bu materyallerin tüm hakları MetaQuotes Ltd.'a aittir. Bu materyallerin tamamen veya kısmen kopyalanması veya yeniden yazdırılması yasaktır.
Bu makale sitenin bir kullanıcısı tarafından yazılmıştır ve kendi kişisel görüşlerini yansıtmaktadır. MetaQuotes Ltd, sunulan bilgilerin doğruluğundan veya açıklanan çözümlerin, stratejilerin veya tavsiyelerin kullanımından kaynaklanan herhangi bir sonuçtan sorumlu değildir.
 Likit Grafik
 MQL5 Cookbook: BookEvent İşleme
 MQL5 Programlama Temelleri: Terminalin Global Değişkenleri
 Neden MetaTrader 4 ve MetaTrader 5'teki Sanal Barındırma Sıradan VPS'den Daha İyidir?
- Ücretsiz alım-satım uygulamaları
- İşlem kopyalama için 8.000'den fazla sinyal
- Finansal piyasaları keşfetmek için ekonomik haberler
Gizlilik ve Veri Koruma Politikasını ve MQL5.com Kullanım Şartlarını kabul edersiniz
Merhaba - Tüm kodlamayı anladığımı iddia edemem, ancak tam olarak kendim kodlamaya çalıştığım şeyi yaptığı için (kötü bir şekilde çok acemi olarak) yolumda ilerliyorum.
EA'yı yeniden oluşturdum ve MQL4'te başarıyla uydum ve ilk başlatmada destek ve direnç çizgilerini çizecek ve bildirimleri gönderecek, ancak YENİ aşırı nokta fraktalları göründüğünde YENİ destek ve direnç çizgilerini yeniden çizmiyor - öyle mi olması gerekiyor? Kaçırdığım bir şey mi var?
Ayrıca fraktalların grafikte gösterilmesini sağlayamadım, ancak EA'yı strateji test cihazında test ettikten sonra fraktallar testi durdurduktan sonra doğru şekilde görünecek mi? Yine neyi kaçırdığıma dair bir fikriniz var mı?
Bu arada dahiyane bir çalışma, fraktallar ve uç noktalara karşı trend çizgilerini kodlamak bir yana açıklamak bile kolay değil :)
Saygılarımla
Andy
Merhaba, ilk soru hakkında: yeni trend çizgilerini yeniden çizmezse, belki de oluşturulan nesneleri silen kodu kullanmamışsınızdır. Makalenin 4. bölümüne bakın. İkinci soru hakkında: tester için fraktallar içeren yeni bir şablon oluşturabilir ve buna "tester.tpl" adını verebilirsiniz. Bundan sonra tester kullandığınızda fraktallar her zaman grafikte gösterilecektir
Merhaba, ilk soru hakkında: yeni trend çizgilerini yeniden çizmezse, belki de oluşturulan nesneleri silen kodu kullanmamışsınızdır. Makalenin 4. bölümüne bakın. İkinci soru hakkında: tester için fraktallar içeren yeni bir şablon oluşturabilir ve buna "tester.tpl" adını verebilirsiniz. Bundan sonra test cihazını kullandığınızda fraktallar her zaman grafikte gösterilecektir
Cevap için teşekkürler, EA'yı bir gecede iki grafiğe bağlı bıraktım (1x 4 saatlik grafik ve 1x 15m = M grafik) ve onları yeniden çizdi, bu yüzden biraz sabır için benim hatam.
tester.pl ile ilgili ipucu için teşekkürler.
Çok teşekkürler
Test cihazında çizgi çizmenin doğru çalışması ve zaman içinde ilk noktaya yapışmaması için, çizgilerin kontrolünü alttan trend çizgilerinin oluşturulmasının üzerine koymanız gerekir
Makaleniz için teşekkür ederim, fikri keşfedeceğim ve EA'larım için uyarlamaya çalışacağım.
Tekrar teşekkürler ve mutlu ticaret.
Ne bir Uzman Danışman olarak ne de MQL4'te bir gösterge olarak hiçbir işaret göstermiyor!!!!!!!!!!!!!!!!!!!. Sadece puanınızı yükseltmek için herhangi bir şey ve çok şey yüklemek bu kadar eğlenceli mi?
Yeni fiyatlar geldiğinde değil, hafta sonları ve genel olarak grafiğe yapıştırdığınız anda çalışmasını sağlamak için başlatmadan sonra OnTick işlevini ekleyelim.